Article

Study on the Law of Nitrogen Transfer and Conversion and Use of Fertilizer Nitrogen in Paddy Fields under Water-Saving Irrigation Mode

1
Rural Water Conservancy Research Institute, Zhejiang Institute of Hydraulics and Estuary, Hangzhou 310020, China
2
School of Water Conservancy, North China University of Water Resources and Electric Power, Zhengzhou 450045, China
3
Management Office of Qiantang River Irrigation District, Xiaoshan District, Hangzhou 311200, China
4
Institute of Hydraulic and Environmental Engineering, Zhejiang University of Water Resources and Electric Power, Hangzhou 310018, China
5
Research Center of Fluid Machinery Engineering and Technology, Jiangsu University, Zhenjiang 212013, China
*
Author to whom correspondence should be addressed.
Water 2019, 11(2), 218; https://doi.org/10.3390/w11020218
Submission received: 26 December 2018 / Revised: 18 January 2019 / Accepted: 23 January 2019 / Published: 28 January 2019

Abstract

:
The research on the effect of water-saving irrigation technology on the loss of nutrients and chemical substances in farmland has become a hot issue in the field of agricultural water and soil. Based on comparative experiments and combined with the isotope N15 tracer technique, the mechanism of nitrogen migration and transformation and the trend of fertilizer nitrogen use under different irrigation modes were studied. The results showed that water-saving irrigation modes (thin and wet irrigation W1 and intermittent irrigation W2) could reduce the NO3-N leaching loss by reducing the water leakage amount and the NO3-N concentration, and effectively inhibit the leaching loss of fertilizer nitrogen. Compared with conventional irrigation (W0), the leaching loss amount of fertilizer nitrogen in W1 and W2 decreased by 62% and 64%, respectively. Under the same amount of fertilizer, water-saving irrigation mode can significantly reduce the total amount of ammonia (NH3) volatilization and the proportion of NH3 volatilization of fertilizer nitrogen in total NH3 volatilization, and significantly increase the nitrogen uptake of rice plants. Meanwhile, water-saving irrigation mode can increase the total nitrogen content of paddy soil by 14.0% but reduce the residual rate of fertilizer nitrogen in soil by 14.6%. Moreover, crop nitrogen uptake can be significantly increased under water-saving irrigation. Compared with W0, the nitrogen fertilizer use rate of W1 and W2 increased by 5.0% and 9.7%, respectively. The research results can provide an important basis for controlling agricultural non-point source pollution, curbing the decline of soil fertility and deterioration of soil quality in paddy fields.

1. Introduction

China is the world’s largest rice producer, with total rice production ranking first in the world [1]. The rice area and production in Zhejiang Province accounts for 30% and 40% of the total grain production in China. Therefore, water conservation and high yield of rice has important practical significance [2].
The research results at home and abroad show that some high-efficiency water-saving irrigation techniques causing drought in paddy fields may lead to the decline in soil fertility after several years, and the fertility characteristics of paddy soils were attenuated or even lost, which was not conducive to sustaining high yield [3,4,5]. Many studies have shown that water and fertilizer are two factors that influence and restrict each other during crop growth and development. Appropriate irrigation can promote the conversion and absorption of fertilizer nutrients and improve the use rate of fertilizers. Also, suitable fertilization could regulate the water use process and improve water use efficiency [6,7]. To improve the use of water and fertilizer in paddy fields, many scholars have done research on the regulation of water and fertilizer of rice. For example, in the regulation of paddy field moisture, water-saving irrigation techniques such as “thin-shallow-wet-drying”, “intermittent irrigation”, “controlled humidification” and “semi-drought cultivation” were proposed [8,9,10]. Previous study of rice field fertility has mainly been on the transformation of nitrogen in paddy soil, the migration of fertilizer nitrogen in roots and the use rate of nitrogen fertilizer under the condition of sufficient water supply. Mao [11] and Yang et al. [12] proposed a specific combination of irrigation and drainage modes and fertilization application for high-efficiency water-saving and sustainable high yield through systematic field experiments, and revealed the mechanism of fertilization system on yield under water-saving irrigation conditions. Li [13] systematically studied the spatial and temporal distribution and migration of nitrogen in rice fields, the volatilization and leaching law, and the distribution characteristics of nitrogen in rice plants under different water and fertilizer conditions through N15 tracer method. Wang [14] showed that the water-saving irrigation mode can significantly reduce the CH4 and N2O emissions and ammonia volatilization loss in paddy fields through changing the water status of rice fields. Kreyea [15] and Okubo [16] found that the total nitrogen runoff load can be effectively reduced by reducing the amount of irrigation water in paddy fields, and the nutrient runoff loss can be reduced by controlling surface drainage. Zhu [17] conducted research on the transformation of soil nitrogen and the migration of fertilizer nitrogen in roots, mainly focusing on nitrogen transformation, the nitrogen cycle, and nitrogen balance in rice fields, and absorption and distribution of the nitrogen, as well as the kinetics of nitrogen uptake and the dynamics of rhizosphere nutrition in rice. However, these studies were based on sufficient water supply of rice, without considering the water factor, and rarely involved the nitrogen transport law in the soil-plant system and the coupling effect of water and nitrogen and the comprehensive transport characteristics. At the same time, systematic achievements have been made in the high-yield irrigation mode and mechanism of water-saving in rice. Xiao [18,19,20] studied the water-saving and emission reduction benefits and nitrogen transport mechanism of paddy fields under the joint regulation of water-saving irrigation-controlled drainage. The results showed that the joint regulation of water-saving irrigation-controlled drainage had a positive effect on water, fertilizer, gas, and heat in the paddy field, but the fertilizer factor was not considered in the study.
In general, the research on rice water-saving irrigation and drainage technology at home and abroad was mainly focused on the sustainable use of water resources, the physical and chemical properties of farmland and the physiological and ecological effects of rice [21,22]. There were few studies on resource and environmental effects under water-saving irrigation condition, especially on reducing the emission of non-point source pollutants, the impact on soil environmental quality, the coupling effect and mechanisms of water and fertilizer, and the combination of regional water-saving irrigation technology and agricultural measures [23,24]. Based on the above studies, this paper presents research on nitrogen’s fate including quantitative analysis of crop absorption, soil residue, leaching loss, and gas loss after the application of nitrogen fertilizer, in particular reporting innovative research on the transfer of fertilizer nitrogen in the soil-plant-atmosphere continuum (SPAC) using N15 tracer technology. The results are of great significance for improving rice water-saving cultivation technology systems, further improving the level of rice water-saving irrigation technology, and promoting sustainable agricultural development.

2. Methods

2.1. Experimental Site

This study was conducted at Zhejiang Irrigation Test Center Station in 2015. Nitrogen migration and transformation in the paddy field under different irrigation modes of single cropping rice was systematically studied by using stable isotope N15 tracer technology in the large-scale barrel evaporator test area. The test base is in the high-tech agricultural park of water conservancy reclamation in Zhejiang Province, located at 120°39’ E, 30°18’ N. The average annual precipitation is 1320.5 mm, the average temperature is 16.1 °C, the frost-free period is 224 days, the annual relative humidity is 82%, the annual sunshine is 2116.6 h, and the annual radiation is 109.6 kcal/m2. The tested soils are paddy soils with pH value of 8.06, total nitrogen of 0.5 g/kg, organic matter of 8.0 g/kg, alkali-hydrolyzed nitrogen of 56.6 mg/kg, available phosphorus of 15.2 mg/kg, and exchangeable potassium of 60.2 kg/kg. A total of 40 barrels with a single diameter of 0.618 m were installed in the test area of large-barrel evaporator, and a filter layer and a lateral drainage device were installed at the bottom. A mass comparator with large tonnage and high precision was used to observe the change of water requirement by weighing method, and an automatic rain shelter was installed in the test area to eliminate the influence of external rainfall on the test.

2.2. Experimental Design

Three irrigation modes, including conventional irrigation (W0), the thin and wet irrigation (W1) and intermittent irrigation (W2), were set up in the experiment. Two kinds of fertilizer application—non-application of nitrogen fertilizer N0 and normal application of nitrogen fertilizer F—were adopted, and other potassium and phosphorus fertilizers were treated in the same way. Conventional irrigation referred to the flooding irrigation mode that farmers were used to. Except for the dew-drying and drying fields in the late tilling stage of rice, the other growth stages generally maintained the water depth of 20–50 mm in the field. Thin and wet irrigation required that the open field should be dried up naturally, and each irrigation amount should be below 20 mm. In case of continuous rainfall during plum rain season and typhoon season, the field should be flooded for more than 5 days and then drained to dry the open field. Compared with thin and wet irrigation, intermittent irrigation should increase the water depth of irrigation (less than 40 mm), and then make it dry and wet intermittently. The field water control standards for different irrigation modes are shown in Table 1. Nitrogen fertilizer was uniformly applied with urea at 240 kg/hm2 including 50% of base fertilizer, 30% of tiller fertilizer and 20% of jointing-booting fertilizer. The application time of base fertilizer, tiller fertilizer, and jointing-booting fertilizer was 9 July, 25 July and 20 August, respectively. The application amount of phosphate and potassium fertilizer was the same in all treatments. Phosphate fertilizer was superphosphate, the application amount was 390 kg/hm2; potassium fertilizer was potassium chloride, the application amount was 90 kg/hm2; and it was a one-time application as base fertilizer. Ten repeats were arranged for each treatment, of which 10% N15 urea was arranged for three repeats and ordinary urea for seven repeats.

2.3. Method

Using large tonnage and a high-precision quality comparator to weigh the barrel evaporator, the water consumption of rice can be obtained by the difference between the front and back periods. The bottom of the barrel evaporator was equipped with a drainage device. The tap was regularly opened to drain water. The water samples were collected at intervals of the 1st, 3rd, 6th, and 10th days after each fertilization and one day before the next fertilization or harvest, and the amount of water leakage during the two sampling periods was weighed. The NO3-N concentration was measured by ultraviolet spectrophotometry method. N15 isotope with 10% abundance was used in this study, and the labeling and content of N15 isotope were analyzed by mass spectrometry method. NH3 volatilization was collected by PVC tube ventilation method. NH3 volatilization collection device was placed in the middle of barrel evaporator. Samples were taken on the 1st day and 5th day after the application of base fertilizer, tiller fertilizer, and jointing-booting fertilizer. The samples were sent to the laboratory for elution and nitrogen content detection. NH3 volatilization was determined by distillation titration. Plants were sampled once per growth period, which required representativeness. Soil samples were collected before soaking fields and after the off-test. Nitrogen content in plant and soil was determined by Kjeldahl method.

3. Results and Discussion

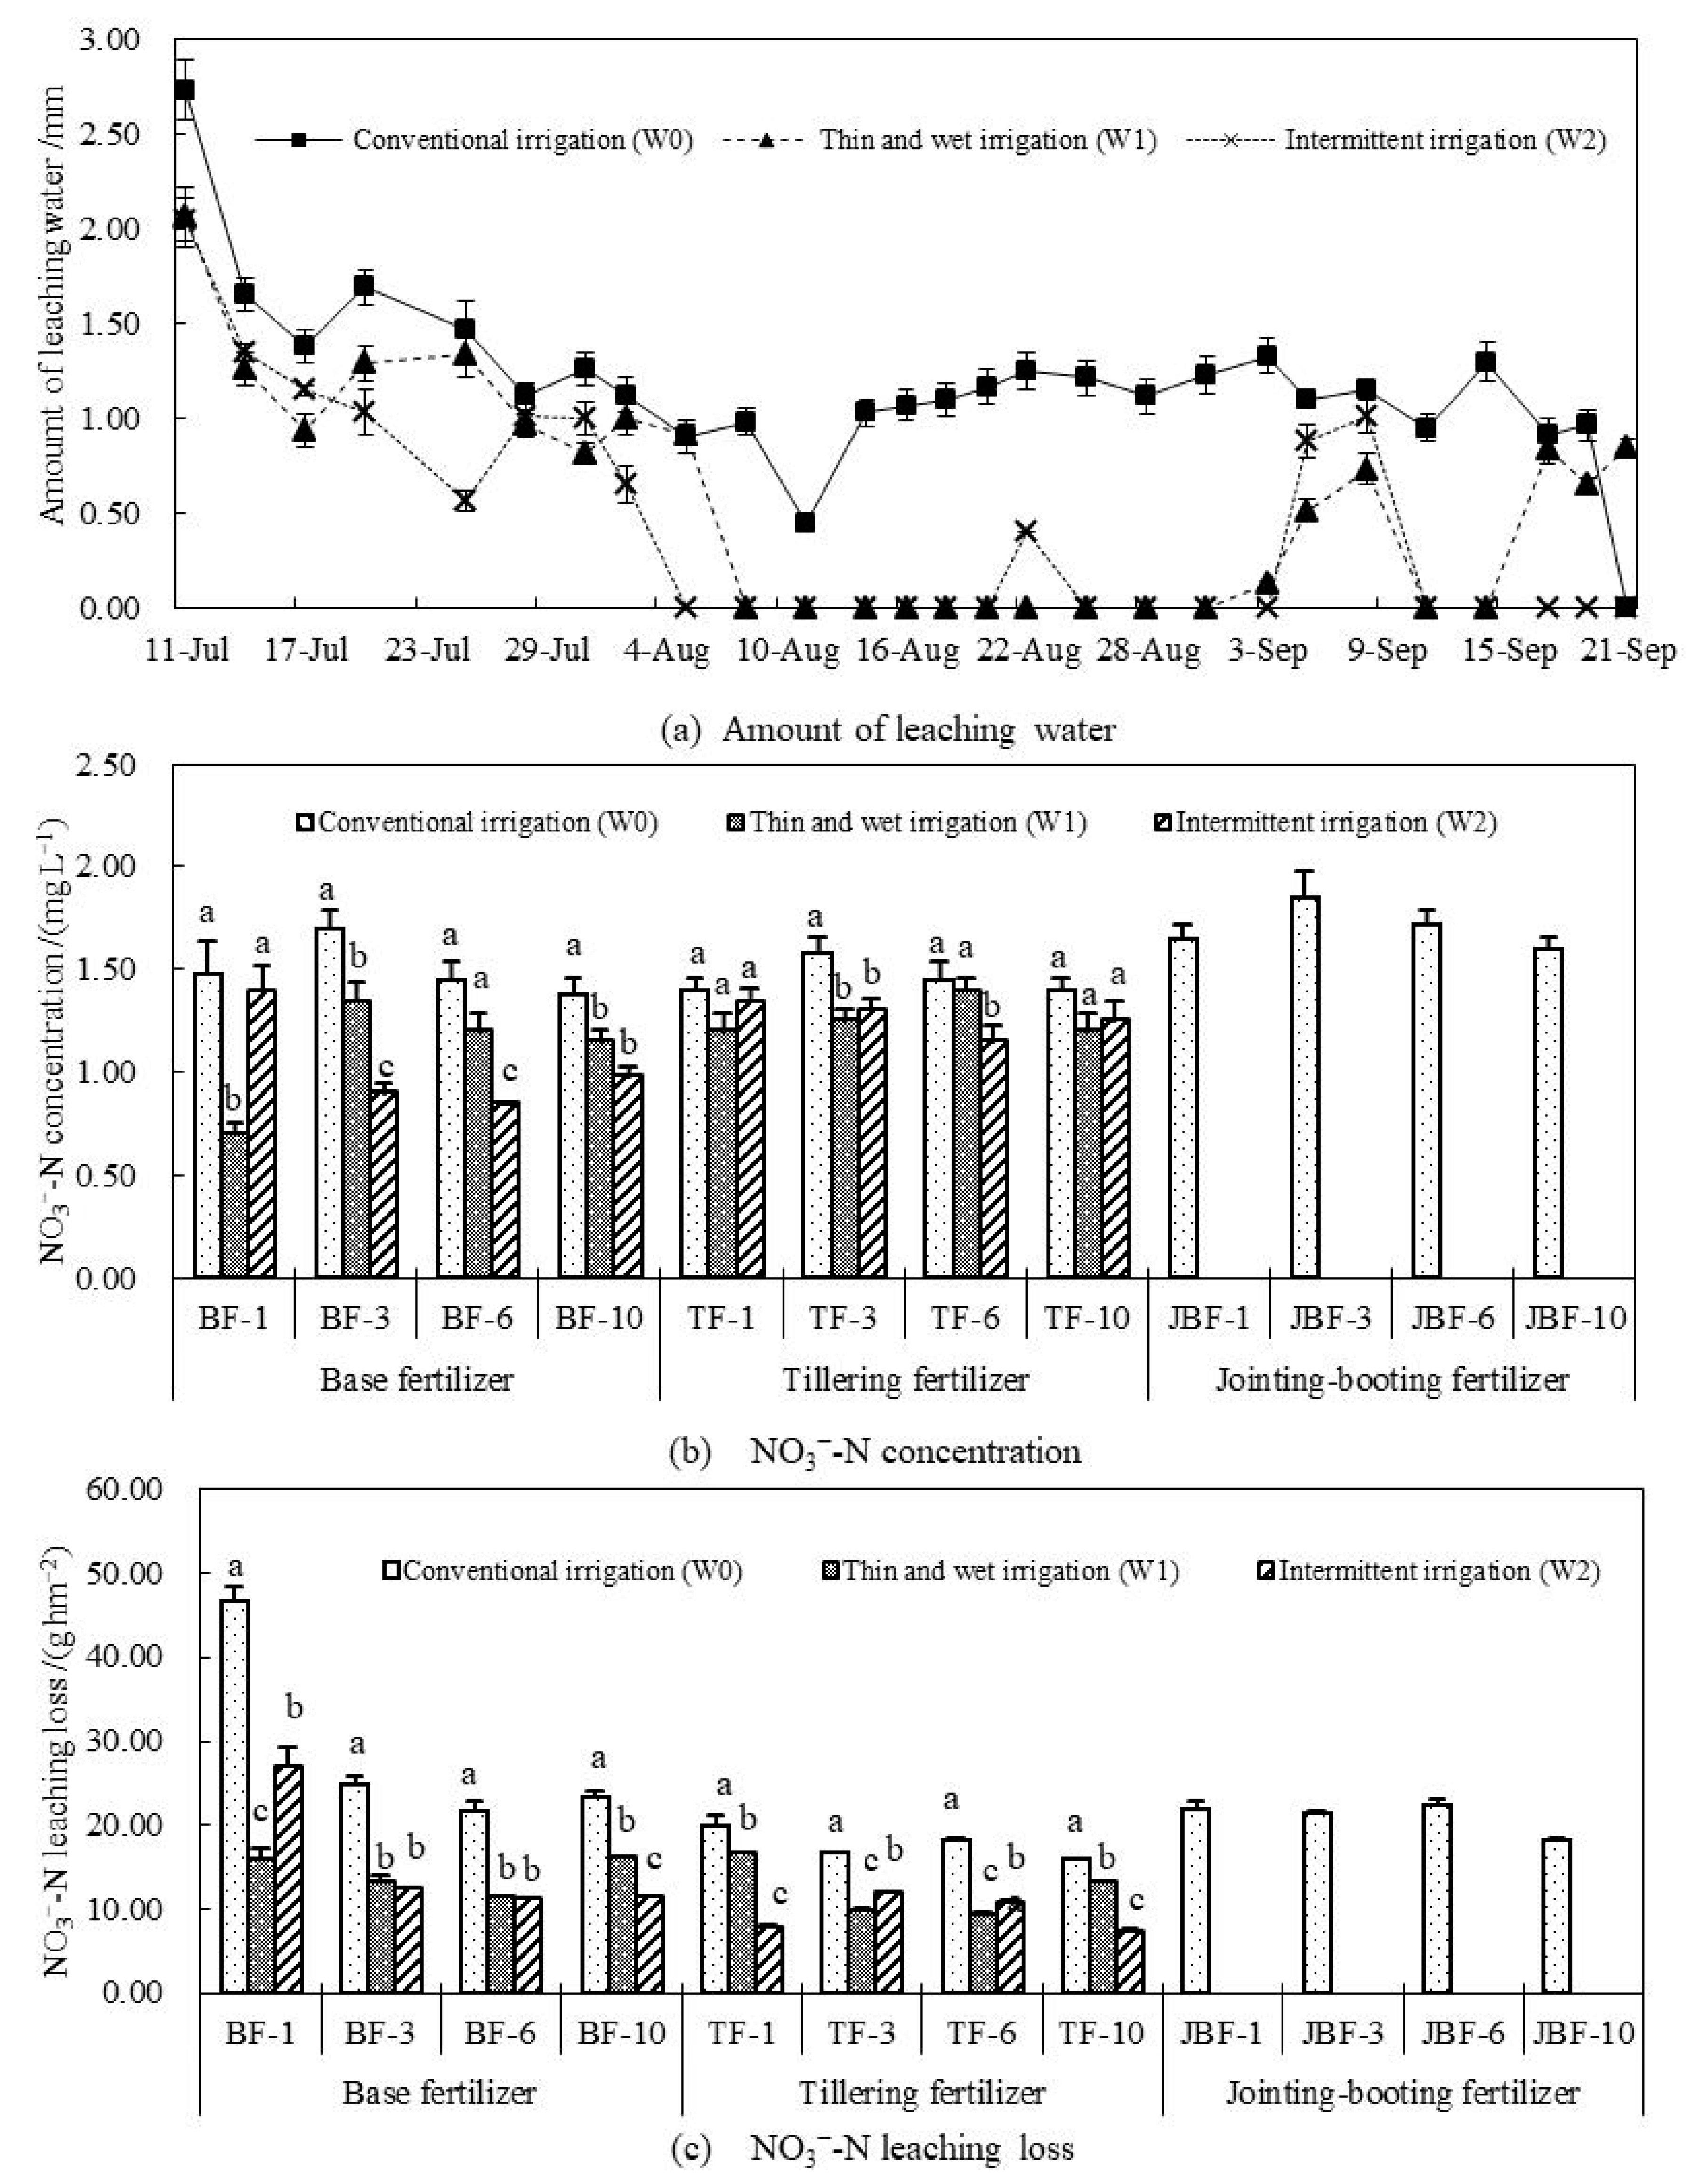
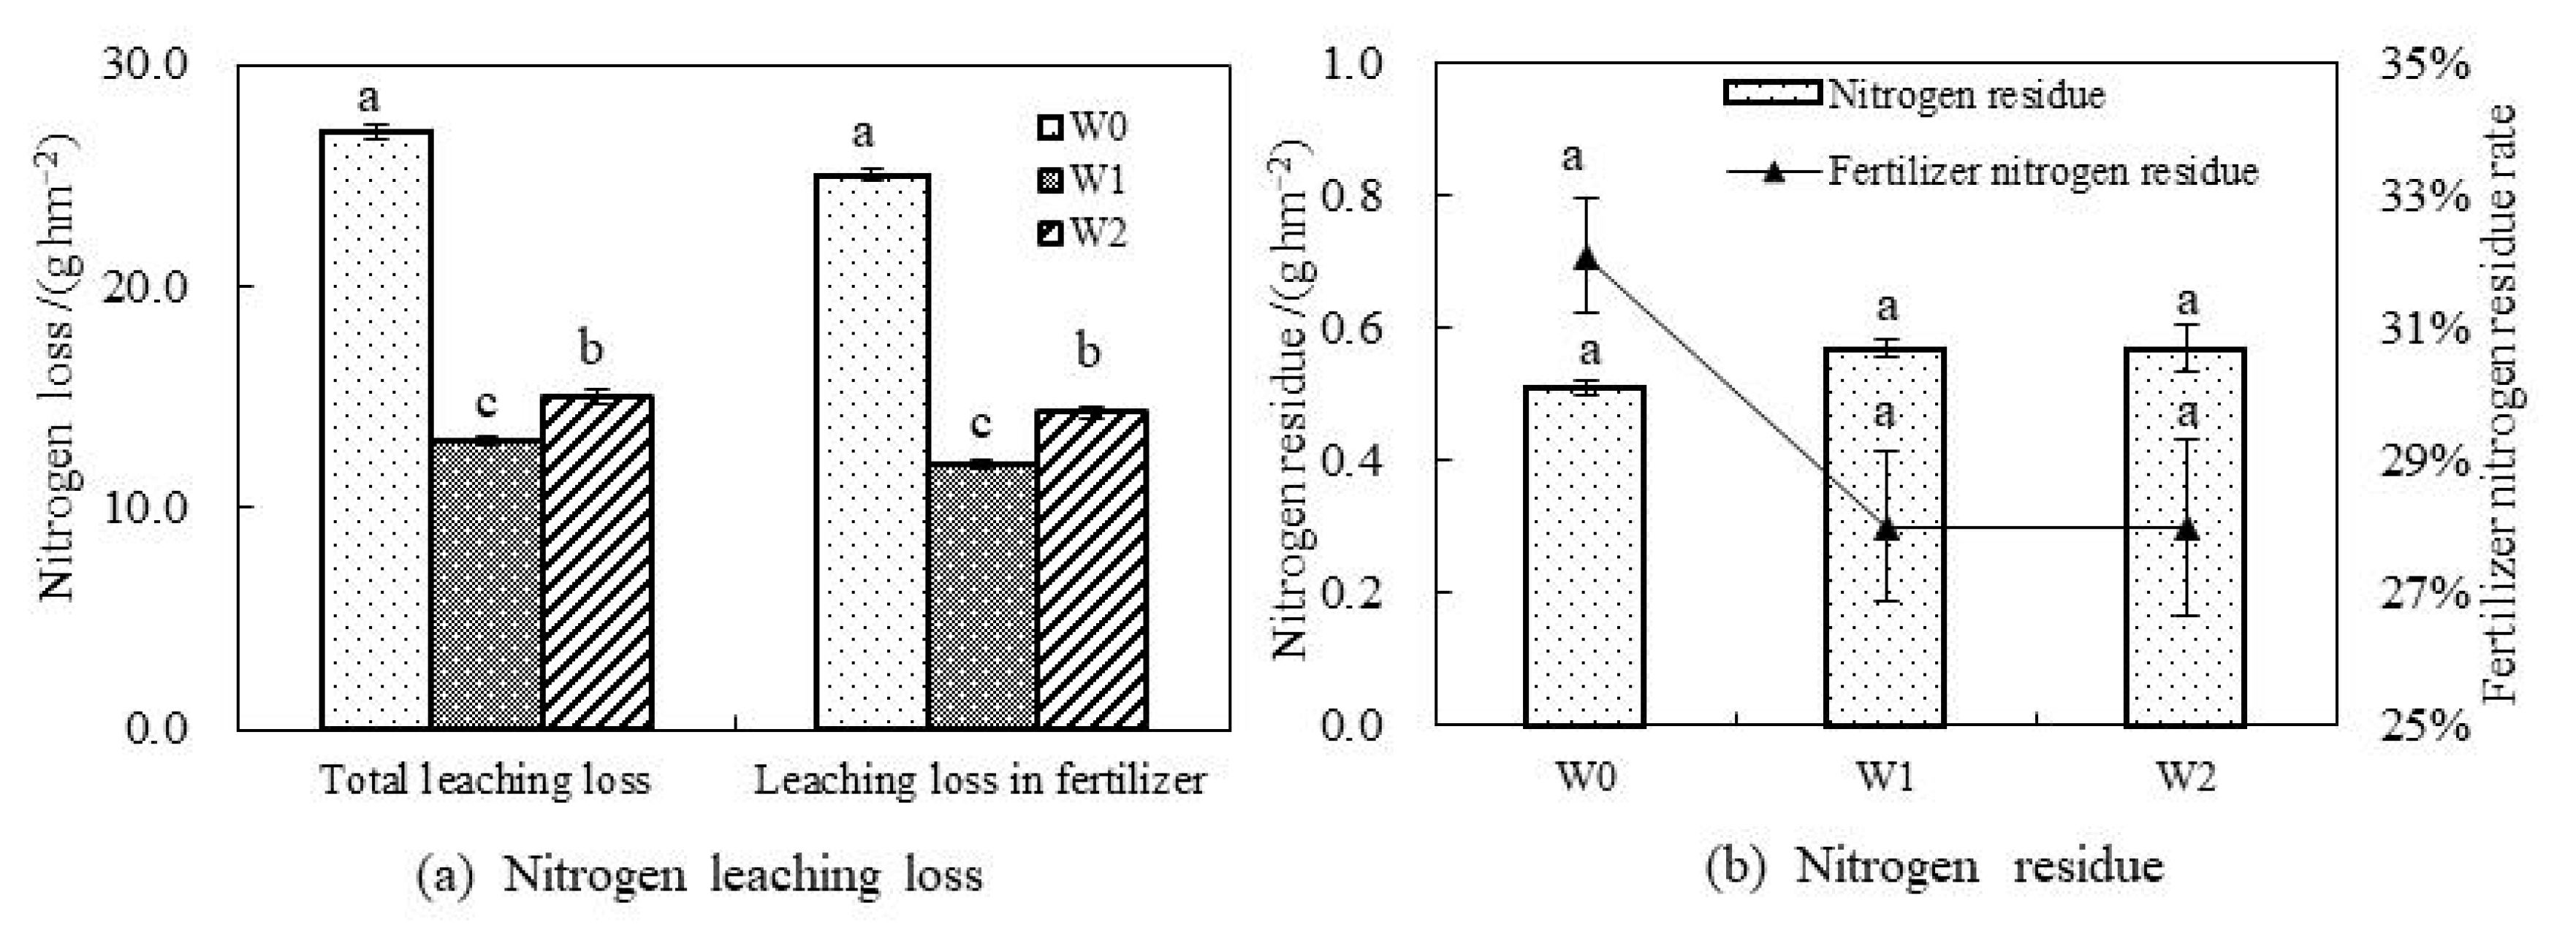
3.1. Effects of Nitrogen Leaching Loss in Paddy Field under Different Irrigation Modes

The variation of leakage water, leaching loss, and concentration of NO3-N during rice growth period under different water-saving irrigation modes were shown in Figure 1. It can be seen that the leakage change trend of W0 was similar in the whole growing season of rice, and it kept a high leakage volume, with the cumulative leakage volume reaching 140.4 mm. The leakage of W1 and W2 had similar trend, i.e., both had a certain amount of leakage in the early growth stage. After the tilling stage, the leakage decreased gradually. The leakage amount of W1 and W2 were 63.6 mm and 49.2 mm, and they decreased by 54.7% and 65.0% respectively compared with W0 in the whole growth season. The order of leakage amount in paddy field was W0 > W1 > W2. It showed that water-saving irrigation mode (W1, W2) can significantly reduce the amount of water leakage in paddy fields. The average NO3-N concentrations of W0, W1, and W2 were 1.25 mg L−1, 1.11 mg L−1 and 1.03 mg L−1 at base fertilizer stage, 1.50 mg L−1, 1.33 mg L−1, and 1.21 mg L−1 at tilling fertilizer stage, respectively, the average NO3-N concentration of W0 was 1.69 mg L−1, and there was no leakage in W1 and W2 at jointing-booting fertilizer. It can be seen that the NO3-N concentration of W0 was significantly higher than that of water-saving irrigation in all growth stages. There was no significant difference between the two kinds of water-saving irrigation modes, and the NO3-N concentration of W2 was slightly lower. Reasonable fertilization and irrigation methods had a certain effect on reducing the NO3-N concentration in leachate, but the effect was not as obvious as reducing the leakage. After fertilizer application, the leaching amount of NO3-N in all treatments reached the maximum, and then decreased gradually. The NO3-N leaching amount of W0 was the highest and tended to be stable. The NO3-N leaching amount of W1 and W2 was significantly lower than that of W0. Due to the decrease of water leakage in the later period, the NO3-N leaching amount was close to zero.
Research by scholars at home and abroad showed that, in farmland ecosystem, NO3-N leaching depends on precipitation (or irrigation) and NO3-N concentration. When the NO3-N concentration is high and the amount of water infiltrated below the root zone is large, the NO3-N leaching is serious, and a factor is limited, and the NO3-N leaching will be significantly reduced. In humid and semi-humid areas, NO3-N usually accumulates in the core soil layer, and then gradually leaches into groundwater. In arid and semi-arid areas, NO3-N in soil migrates downward with water due to the infiltration of natural precipitation or irrigation water. This study showed that water-saving irrigation mode can reduce NO3-N leaching loss by reduced leakage and NO3-N concentration. The results of this study were consistent with studies of Hay [25] and Parfitt [26].

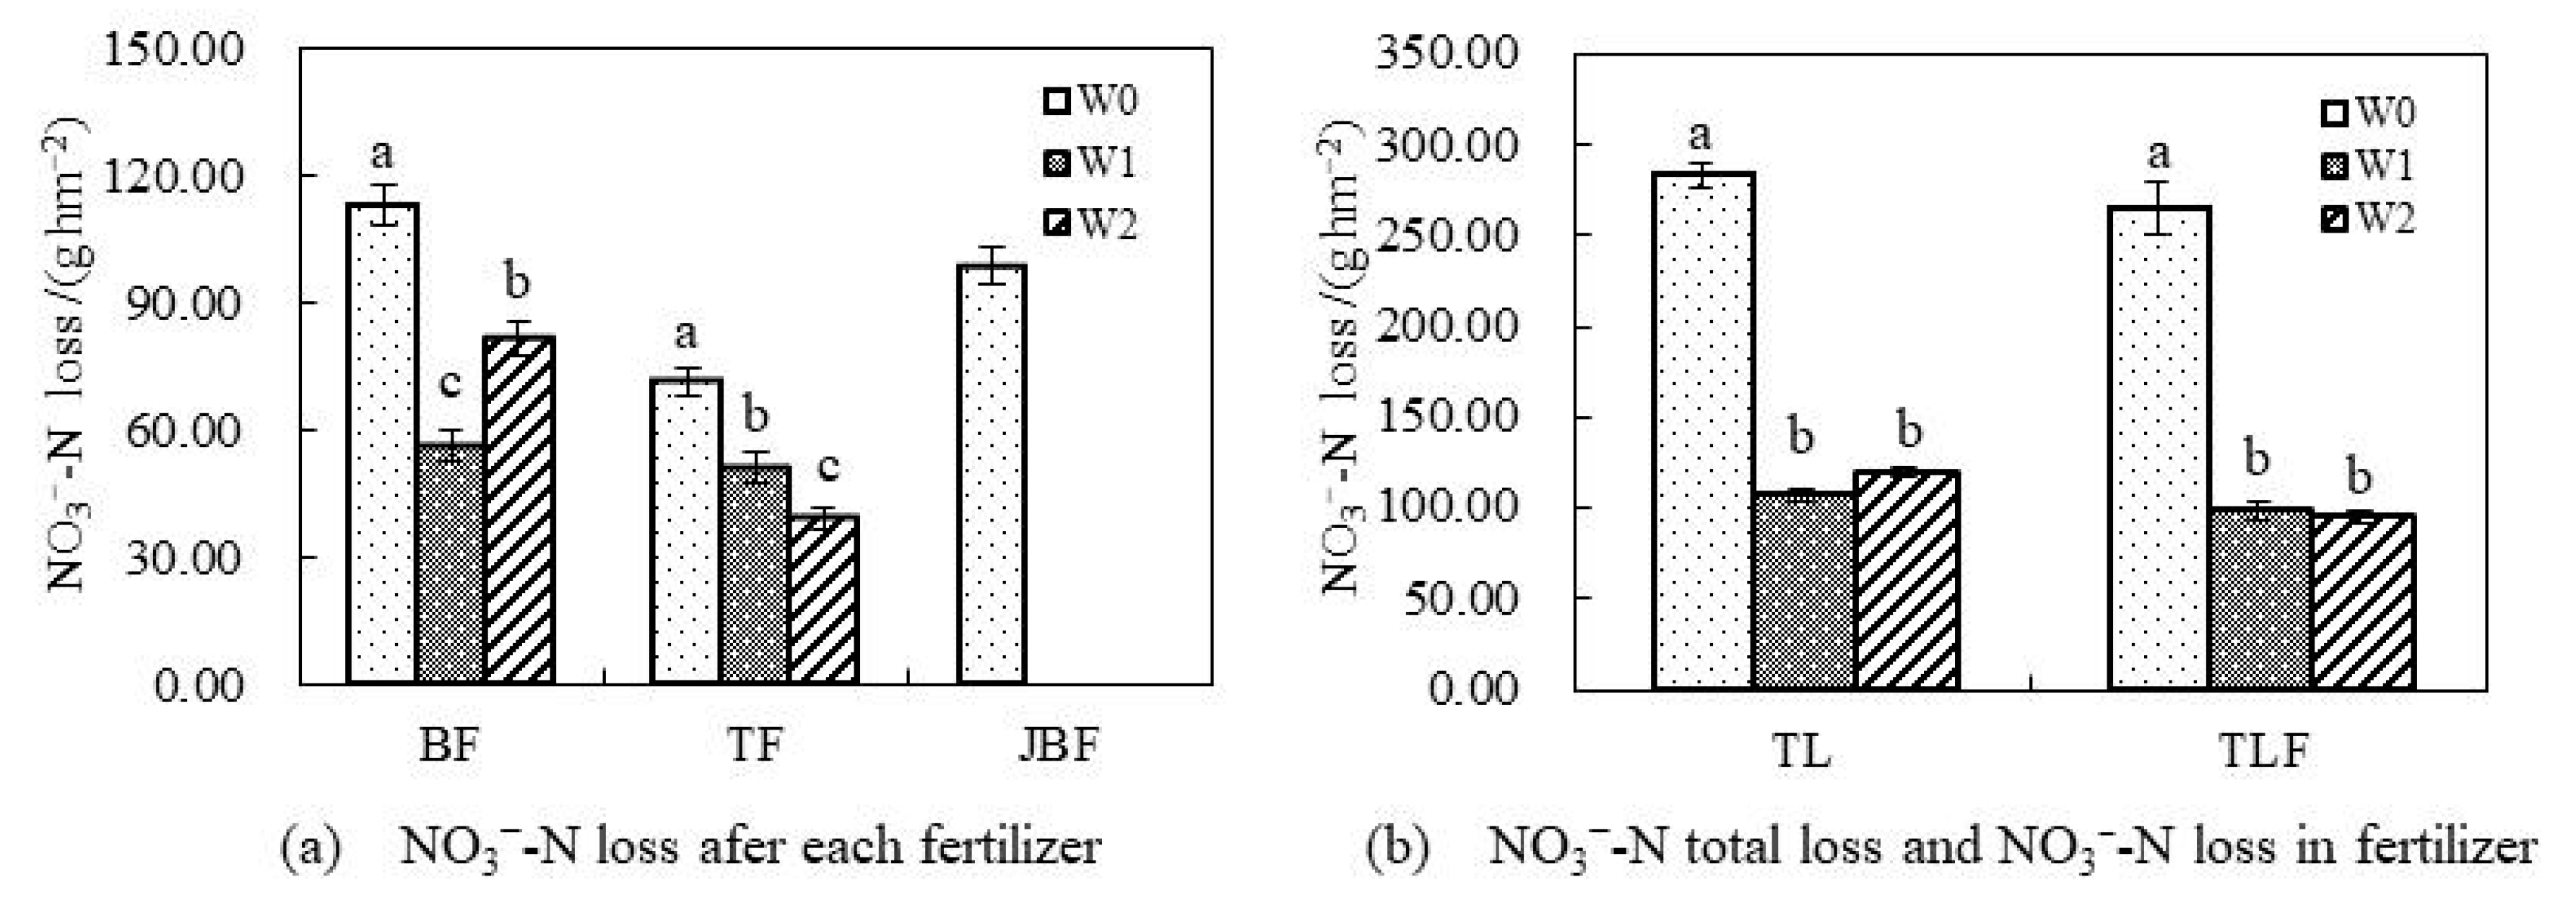
3.2. Effects of Total Nitrogen Leaching Loss in Paddy Field under Different Irrigation Modes

The variation of total NO3-N leaching loss under different irrigation modes is shown in Figure 2. It is shown in Figure 2a that the NO3-N leaching amount in all treatments reached the maximum at the base fertilizer stage, among which the NO3-N leaching amount in W0 was the largest, followed by W2, the lowest was in W1, and the NO3-N leaching amount in W0 was more than twice as much as that in W1 treatment. In tilling fertilizer stage, the NO3-N leaching amount in W0 was the highest, followed by W1, and W2 was the lowest. In jointing-booting fertilizer stage, the leakage amount in W1 and W2 was 0 mm, so the NO3-N leaching amount of W1 and W2 was also 0 g hm−2, but the NO3-N leaching amount of W1 treatment was 98.7 g hm−2. Figure 2b shows that the total NO3-N leaching amount in W0 mode was the largest, 2.64 times and 2.36 times than that of W1 and W2, respectively. After deducting the amount of nitrogen leaching without applying nitrogen fertilizer, the NO3-N leaching amount in fertilizer nitrogen was still the largest in W0 mode, which was 2.66 times and 2.79 times higher than that in W1 and W2 respectively, but the difference between W1 and W2 was not significant. Meanwhile, the NO3-N leaching loss of fertilizer nitrogen accounted for 94% of total leaching nitrogen loss, 1.1% of total nitrogen application in W0 mode, 93% of total leaching nitrogen loss, 0.41% of total nitrogen application in W1 mode, 79% of total leaching nitrogen loss, 0.40% of total nitrogen application in W2 mode. The NO3-N leaching loss of fertilizer nitrogen was 62% and 64% in W1 and W2 less than that of W0, respectively. It can be seen that different irrigation modes had certain inhibitory effects on nitrogen leaching loss. The inhibitory effect was W1 > W2 > W0. The change trend of fertilizer nitrogen leaching was very similar to that of total nitrogen leaching. The inhibition effect of different irrigation modes on fertilizer nitrogen leaching was W1 ≈ W2 > W0.
The research studied by Zhang [27] showed that the leaching loss of nitrogen in soil was mainly NO3-N leaching, and the proportion of ammonium nitrogen leaching was small, which could be neglected. Therefore, the leaching loss of nitrogen in this paper mainly considered NO3-N leaching.

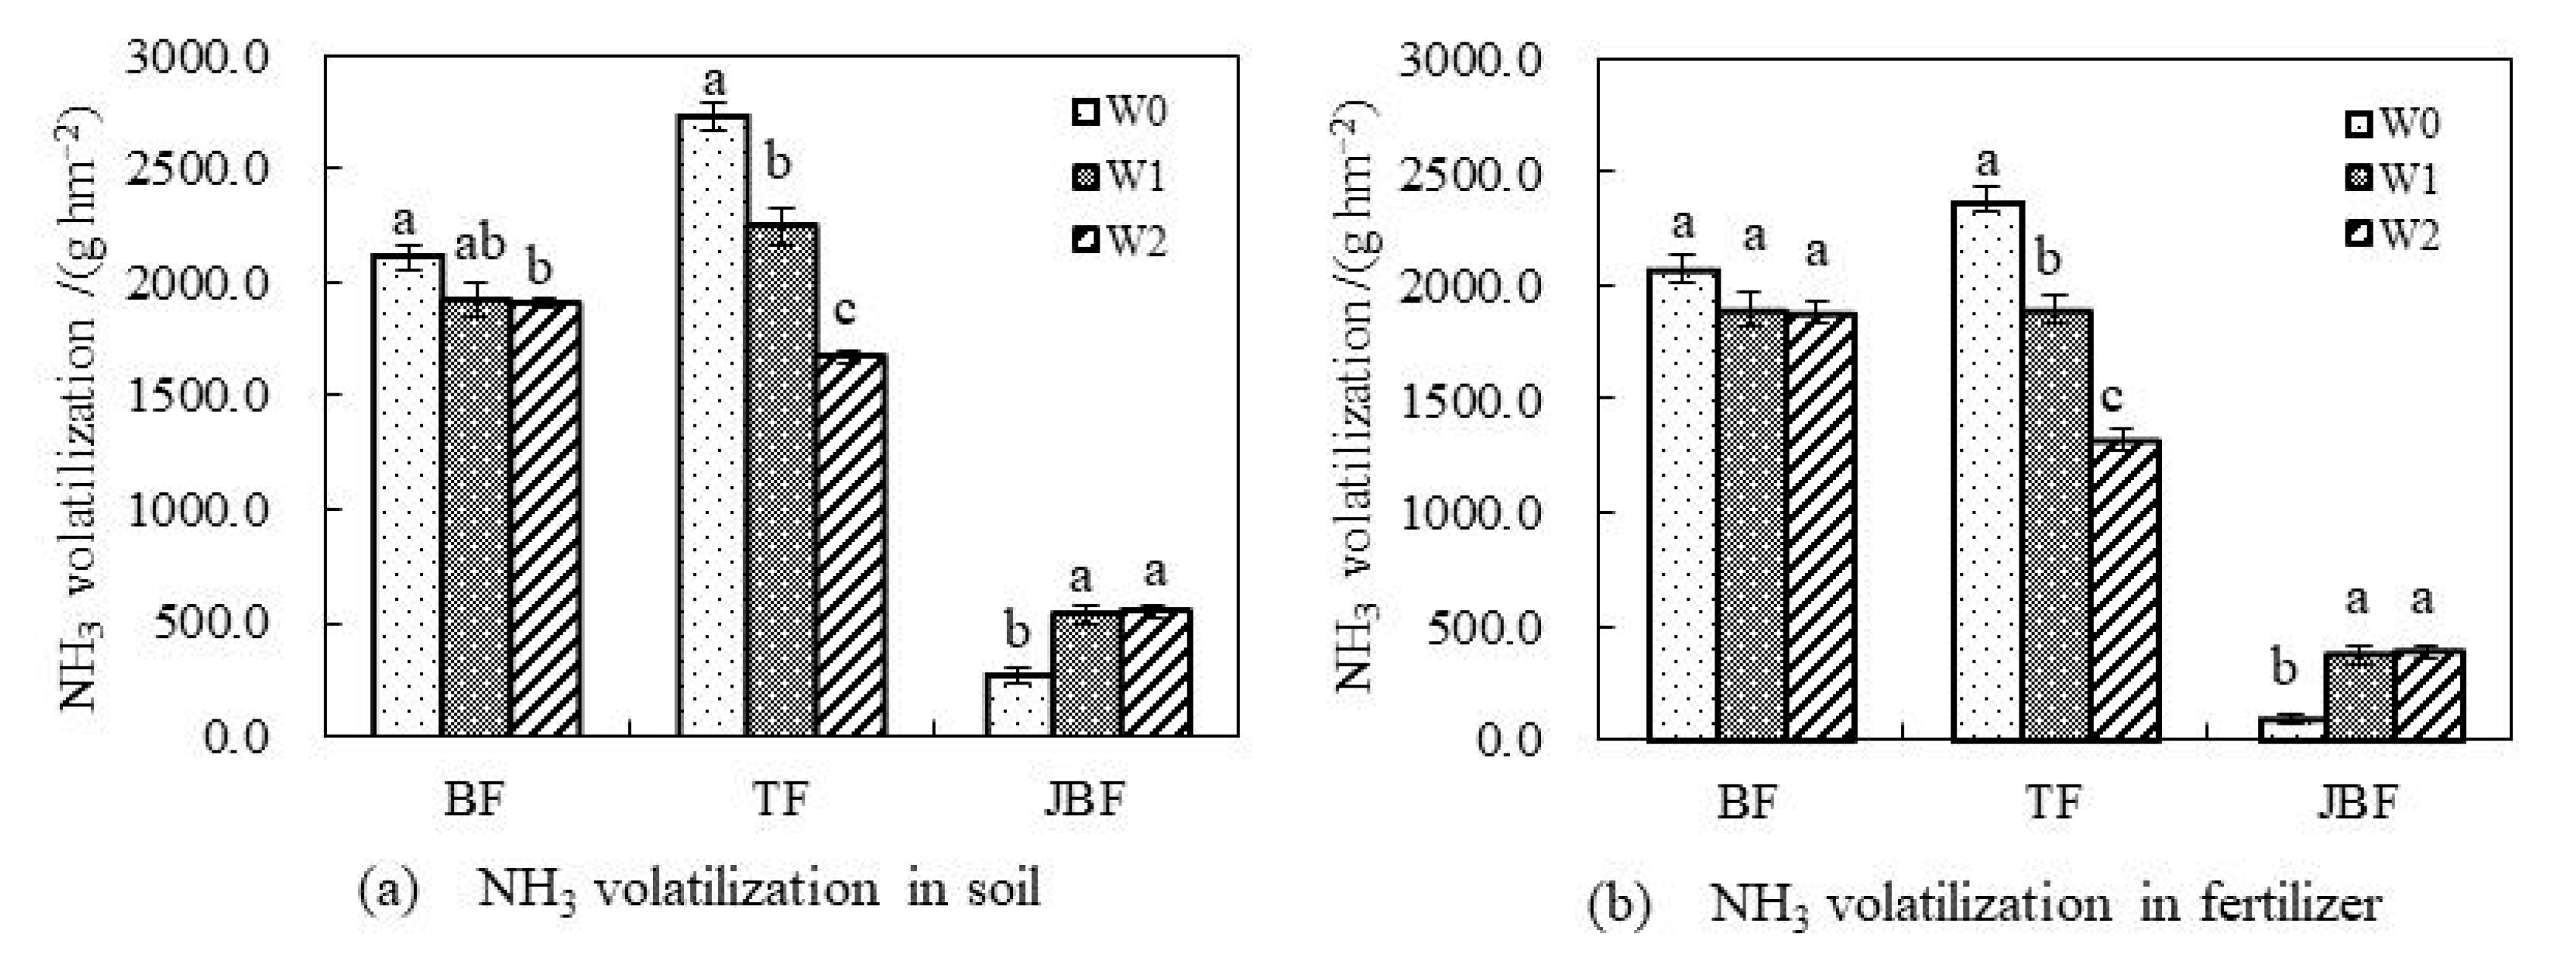
3.3. Effects of NH3 Volatilization Loss in Paddy Field under Different Irrigation Modes

NH3 volatilization accounts for a large proportion of nitrogen loss in paddy field, which is one of the main mechanisms of nitrogen loss in paddy field. The variation of NH3 volatilization loss in paddy fields under different irrigation modes is shown in Figure 3. Figure 3a shows that NH3 volatilization of rice reached the maximum in different irrigation modes at tilling stage, mainly because tilling fertilizer was applied in late July, when the temperature was significantly higher than that at transplanting and booting stages, and NH3 volatilization was positively correlated with temperature. The difference of NH3 volatilization between tilling fertilizer and jointing-booting fertilizer may be attributed to the large nutrient demand at booting stage resulting in the rapid absorption of nitrogen, reduction of ammonia nitrogen concentration in soil and NH3 volatilization loss. On the other hand, the higher plants at booting stage blocked the sunshine, inhibited algae growth, and the increase of pH in surface paddy water and temperature, resulting in the reduction of NH3 volatilization. After applying base fertilizer and tilling fertilizer, NH3 volatilization in water-saving irrigation mode was significantly less than that in conventional irrigation mode, but NH3 volatilization in conventional irrigation mode was less than that in water-saving irrigation mode after applying jointing-booting fertilizer. However, because of the small proportion of NH3 volatilization after jointing-booting fertilization, the total NH3 volatilization of “water-saving irrigation + three times fertilization” mode was significantly less than that of conventional irrigation under the same fertilization amount.
The D-value method was used to estimate the loss of NH3 volatilization from fertilizer nitrogen. As shown in Figure 3b, the basic law of NH3 volatilization from fertilizer nitrogen was consistent with that of NH3 volatilization from soil after three times of fertilization. Computing the contribution rate of fertilizer to NH3 volatilization, it was found that the contribution rate of NH3 volatilization of fertilizer in different periods was significantly different. The contribution rate of NH3 volatilization of fertilizer of base fertilizer stage was higher than 98% (98.51% in W0, 98.34% in W1 and 98.46% in W2). The contribution rate of NH3 volatilization of fertilizer was 87.01% in W0, 84.24% in W1 and 78.80% in W2 respectively in tilling fertilizer stage, 34.12% in W0, W1 in 69.41% and 70.12% respectively in jointing-booting fertilizer stage. In conclusion, water-saving irrigation mode can effectively reduce the loss of NH3 volatilization in paddy fields, while reducing the proportion of NH3 volatilization from fertilizer nitrogen in total NH3 volatilization. The inhibiting effect of different irrigation modes on NH3 volatilization in paddy fields was W2 > W1 > W0.
Zhao [28] found that NH3 volatilization mainly came from crop amino nitrogen fertilizer acid and nitrogen-containing organic fertilizer. In wheat-rice rotation system, NH3 volatilization accounted for 74.8%–98.6% of fertilizer nitrogen and 1.16%–11.26% of total nitrogen application. In this paper, according to the variation of ammonia volatilization under different irrigation modes of rice crops, the research conclusions were basically the same.

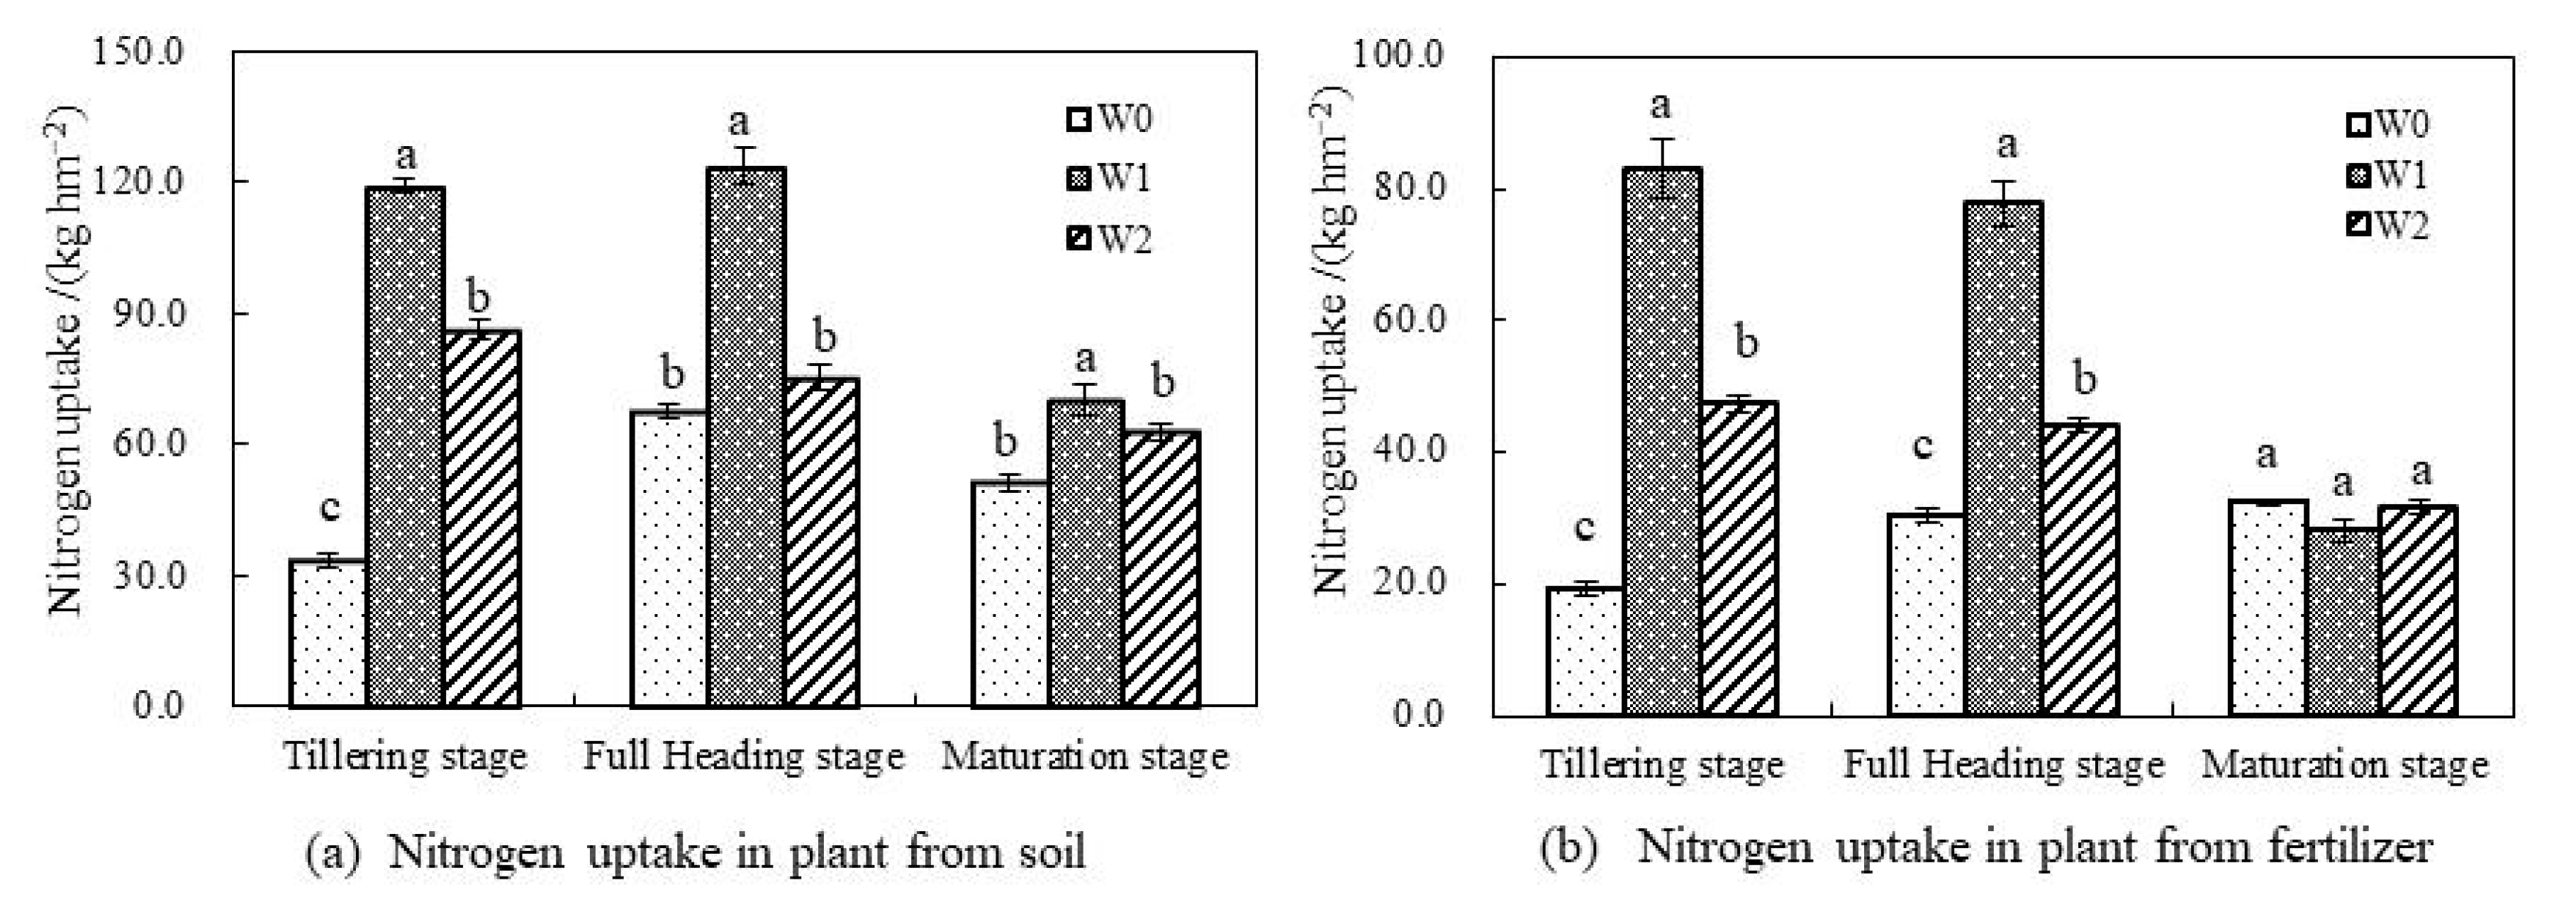
3.4. Differences between Soil Nitrogen Absorption and Fertilizer Nitrogen Absorption by Rice Plant under Different Irrigation Modes

The nitrogen uptake of plant under different irrigation modes is shown in Figure 4. As shown in Figure 4a, the nitrogen uptake of rice plant in W1 and W2 was significantly higher than that of W0 at the peak tilling stage, and there was no significant difference between W1 and W2. At the full heading stage, the nitrogen uptake of W0 and W2 increased significantly, while that of W2 did not change significantly compared with tilling stage, and the nitrogen uptake of W1 and W2 was 1.83 times and 1.11 times higher than that of W0. At the maturation stage, the nitrogen uptake decreased by 24.3%, 43.4%, and 16.14% respectively in W0, W1, and W2 compared with full heading stage, that mainly due to the large amount of nitrogen transported from rice plants to grains. Nitrogen uptake of rice plant under different irrigation modes showed a trend of W1 > W2 > W0. As shown in Figure 4b, the variation of nitrogen uptake from fertilizer nitrogen was similar to that of total nitrogen uptake by rice plant. At the peak tilling stage, the uptake of fertilizer nitrogen in W1 and W2 by rice plant was significantly higher than that of W0, which was 4.29 times and 2.45 times higher than that of W0, respectively. At the full heading stage, the uptake of fertilizer nitrogen of W0 increased significantly than that at the peak tilling stage, which was 1.57 times higher than that at the peak tilling stage. The nitrogen uptake of W1 and W2 did not change significantly, but was still significantly higher, which was 2.56 times and 1.43 times higher than that of W0. At maturation stage, fertilizer nitrogen uptake by rice plant decreased significantly. From full heading to maturation stage, W1 decreased the most, with a decrease of 63.9%, followed by W2 and W0, with a decrease of 28.0% and 14.3%, respectively. After maturation stage, there was no significant difference in fertilizer nitrogen uptake by rice plant among different irrigation modes.
In addition, the ratio of fertilizer nitrogen uptake to total nitrogen uptake of rice plants also showed a downward trend with the development of growth stages. The uptake of fertilizer nitrogen of W0 accounted for 58.0% of the total nitrogen uptake in tilling stage, and decreased to 51.0% in maturation stage. The uptake of fertilizer nitrogen of W1 and W2 accounted for 69.7% and 55.0% of the total nitrogen uptake in tilling stage, decreased by 62.8% and 58.7% in full heading stage, and by 40.0% and 55.0% in maturation stage. The total nitrogen absorbed and the amount of fertilizer nitrogen by rice plant decreased at maturation stage, which was due to the large amount of fertilizer nitrogen in rice plant transferred to the grain at this time that was basically consistent with the research conclusions of Qiao [29] and Hashim [30]. Nitrogen uptake by rice grains and plants at maturation stage is shown in Table 2. It can be seen that the total nitrogen and fertilizer nitrogen uptake of rice grain was significantly higher than that of plant. The total nitrogen content in grain and plant of W1 was the highest, followed by W2 and W0. Fertilizer nitrogen content in rice grain and plant of W2 was the highest, followed by W1 andW0.

3.5. Differences between Leaching Amounts of Soil Nitrogen and Fertilizer Nitrogen under Different Irrigation Modes

The differences between leaching amounts of soil nitrogen and fertilizer nitrogen under different irrigation modes were shown in Figure 5a. It can be seen that the NO3-N leaching amount in W0 mode was significantly higher than that in W1 and W2, and the total NO3-N leaching amount in W1 and W2 decreased by 52% and 43% compared with W0, respectively. The total amount of NO3-N leaching in W0, W1, and W2 was 25.0 g/hm2, 12.0 g/hm2, and 14.3 g/hm2, accounting for 92.6%, 92.3% and 95.6% of the total amount of NO3-N leaching, 1.04%, 0.50% and 0.60% of the total amount of nitrogen fertilizer applied, respectively. The variation of soil residual nitrogen content under different irrigation modes is shown in Figure 5b. It shows that the total nitrogen content of paddy field in W1 and W2 increased by 14.0% compared with that of original soil, while the total nitrogen content of paddy field in W0 did not change. The reason was that the water-saving irrigation modes reduced the leaching and volatilization losses of soil nitrogen and improved the use rate of fertilizer nitrogen. At the same time, the residue rates of fertilizer nitrogen in W1 and W2 was less than that in the W0, with a decrease of 14.6%. The main reason was that the uptake of fertilizer nitrogen by rice in W1 and W2 was higher than that in W0. The uptake of fertilizer nitrogen in W0 was 33.1%, while that in W1 and W2 was 42.3% and 47.3%, respectively. Jie [31] found that additional water in irrigation may reduce soil oxygen content and increase the possibility of soil nutrient leaching, but in this paper, it found that water-saving irrigation mode can effectively improve soil aeration and increase soil fertility.

3.6. Nitrogen Transfer and Conversion of Fertilizers under Different Irrigation Modes

After nitrogen fertilizer was applied to paddy field, the direction of nitrogen includes crop absorption, soil residue, leaching loss, gas loss, and so on. In this paper, N15 tracer technology was used to analyze the fate of fertilizer nitrogen under different irrigation modes, and the results of previous analysis were synthesized in Table 3. It shows that different irrigation modes had important effects on the transport and transformation of fertilizer nitrogen in SPAC. Under the same amount of nitrogen application, leaching loss, soil residue and NH3 volatilization loss of fertilizer nitrogen in water-saving irrigation mode (W1, W2) were less than that in conventional irrigation mode (W0), while the corresponding crop nitrogen uptake was significantly higher than that in W0. The apparent use rate of urea nitrogen fertilizer under general conditions was about 30.0%, while under this experimental condition, the use rate of nitrogen fertilizer in W1 and W2 modes increased by 5.0% and 9.7% compared with W0, and increased by 10.9% and 15.6% higher than the general level of 30.0%. NH3 volatilization and other losses of nitrogen were not significant between W0 and W1. It shows that the water-saving mode had obvious effect on improving the nitrogen absorption of paddy rice and reducing the pollution of fertilizer to the environment. Compared with Rahman’s research, we not only considered the amount of fertilizer absorbed by crops, but also studied the direction of fertilizer nitrogen from three aspects: crop-soil-atmosphere, which was more comprehensive [32].

4. Conclusions

This paper systematically studied the spatial and temporal distribution and transport, volatilization, and leaching of nitrogen in paddy fields under different irrigation modes, and the distribution characteristics of nitrogen in rice plant. The main conclusions were as follows:
  • Water-saving irrigation mode reduced the amount of NO3-N leaching loss by reducing leakage and NO3-N concentration. There is no significant difference between the leakage amount and NO3-N concentration in W1 and W2. In addition, the inhibition effect on fertilizer nitrogen leaching was W1 ≈ W2 > W0. The fertilizer nitrogen leaching loss in W1 and W2 decreased by 62% and 64% compared with W0, respectively.
  • Under the same amount of fertilizer, the total amount of NH3 volatilization in “water-saving irrigation + three times of fertilization” mode was significantly less than that in conventional irrigation, and the proportion of NH3 volatilization of fertilizer in total NH3 volatilization was reduced. The contribution rate of NH3 volatilization in W0 was 34.12% at jointing-booting stage, and the same in W1 and W2 was 69.41% and 70.12%, respectively.
  • Nitrogen uptake of rice plant in different irrigation modes showed a trend of W1 > W2 > W0. With the development of growth stage, the ratio of fertilizer nitrogen uptake to total nitrogen uptake of rice plant showed a downward trend. The amount of fertilizer nitrogen uptake of rice plant in W0, W1, and W2 ranged from 51.0% to 58.0%, 40.0% to 69.7%, and 50.5% to 58.7%, respectively.
  • Compared with the original soil, the total nitrogen content of paddy field under water-saving irrigation increased by 14.0%. The total nitrogen content of paddy field under conventional irrigation basically remained unchanged. At the same time, the residue rates of fertilizer nitrogen in W1 and W2 were less than those in the W0, with a decrease of 14.6%. The uptake rate of fertilizer nitrogen in W0, W1, and W2 was 33.1%, 42.3%, and 47.3%, respectively.
  • Leaching loss, soil residue, and NH3 volatilization of fertilizer nitrogen in water-saving irrigation mode (W1, W2) were all less than that in conventional irrigation mode (W0), while the corresponding nitrogen uptake by crops was significantly higher than that in W0. Nitrogen use efficiency of W1 and W2 increased by 5.0% and 9.7%, respectively, compared with W0, indicating that the two water-saving irrigation modes improved nitrogen uptake by paddy rice, and reduced environmental pollution caused by fertilizer.

Author Contributions

M.X., Y.L., and Z.M. conceived and designed the research, performed the analysis, analyzed the data, produced the tables, and wrote the paper. M.X., J.W., L.W. and X.H. collected the data. M.X., Y.L. and J.W. all read and made improvements to the manuscript.

Funding

Our research was financially supported by the National Natural Science Foundation of China (No. 51679108), Key Laboratory of Efficient Irrigation-Drainage and Agricultural Soil-Water Environment in Southern China (Hohai University), Ministry of Education (No. 2017B20414-2), the High-level Talent Research Project of North China University of Water Resources and Electric Power (No. 201705017), and Zhejiang basic public welfare research plan (No. LGN18E090002).

Acknowledgments

Moreover, we would like to thank the assistant editor and the anonymous reviewers for their appreciated work, helpful suggestions and corrections.

Conflicts of Interest

The authors declare no conflict of interest.

References

  1. Jobin, C.; Duquette, P. The impact of agricultural extension on farmer nutrient management behavior in chinese rice production: A household-level analysis. Sustainability 2014, 6, 6644–6665. [Google Scholar]
  2. Zhang, W.; Li, T.; Huang, Y.; Zhang, Q.; Bian, J.; Han, P. Estimation of uncertainties due to data scarcity in model upscaling: A case study of methane emissions from rice paddies in china. Geosci. Model Dev. Discuss. 2014, 7, 181–216. [Google Scholar] [CrossRef]
  3. Dasgupta, P.; Das, B.S.; Sen, S.K. Soil water potential and recoverable water stress in drought tolerant and susceptible rice varieties. Agric. Water Manag. 2015, 152, 110–118. [Google Scholar] [CrossRef]
  4. Xu, J.Z.; Peng, S.Z.; Yang, S.H.; Wang, W.G. Ammonia volatilization losses from a rice paddy with different irrigation and nitrogen managements. Agric. Water Manag. 2012, 104, 184–192. [Google Scholar] [CrossRef]
  5. Tan, X.; Shao, D.; Liu, H.; Yang, F.; Xiao, C.; Yang, H. Effects of alternate wetting and drying irrigation on percolation and nitrogen leaching in paddy fields. Paddy Water Environ. 2013, 11, 381–395. [Google Scholar] [CrossRef]
  6. Zhang, D.; Jiao, X.; Du, Q.; Song, X.; Li, J. Reducing the excessive evaporative demand improved photosynthesis capacity at low costs of irrigation via regulating water driving force and moderating plant water stress of two tomato cultivars. Agric. Water Manag. 2018, 199, 22–33. [Google Scholar] [CrossRef]
  7. Subramanian, K.S.; Selvakumari, G.; Selvaraj, K.V.; Chinnaswami, K.N. Irrigation regimes on utilization of nutrients, yield and quality of sugarcane (Saccharum officinarum L.). J. Agron. Crop Sci. 2010, 167, 155–158. [Google Scholar] [CrossRef]
  8. Liang, Y.; Li, F.; Nong, M.; Hui, L.; Zhang, J. Microbial activity in paddy soil and water-use efficiency of rice as affected by irrigation method and nitrogen level. Commun. Soil Sci. Plant Anal. 2016, 47, 19–31. [Google Scholar] [CrossRef]
  9. Lin, L.; Zhang, Z.; Janssen, M.; Lennartz, B. Infiltration properties of paddy fields under intermittent irrigation. Paddy Water Environ. 2014, 12, 17–24. [Google Scholar] [CrossRef]
  10. Bhantana, P.; Lazarovitch, N. Evapotranspiration, crop coefficient and growth of two young pomegranate (Punica granatum L.) varieties under salt stress. Agric. Water Manag. 2010, 97, 715–722. [Google Scholar] [CrossRef]
  11. Mao, Z. Water Saving Irrigation for Rice and Its Effect on Environment. Eng. Sci. 2002, 4, 8–16. [Google Scholar]
  12. Yang, Y.; Cui, Y.; Luo, Y.; Lyu, X.; Traore, S.; Khan, S. Short-term forecasting of daily reference evapotranspiration using the penman-monteith model and public weather forecasts. Agric. Water Manag. 2016, 177, 329–339. [Google Scholar] [CrossRef]
  13. Li, Q.; Hu, Y.; Sun, J.; Li, H. Loss characteristics of agricultural non-point source pollutants under controlled drainage. Trans. Chin. Soc. Agric. Eng. 2010, 26, 182–187. [Google Scholar]
  14. Wang, J.Y.; Jia, J.X.; Xiong, Z.Q.; Khalil, M.A.K.; Xing, G.X. Water regime–nitrogen fertilizer–straw incorporation interaction: Field study on nitrous oxide emissions from a rice agroecosystem in Nanjing, China. Agric. Ecosyst. Environ. 2011, 141, 437–446. [Google Scholar] [CrossRef]
  15. Kreye, C.; Dittert, K.; Zheng, X.; Zhang, X.; Lin, S.; Tao, H. Fluxes of methane and nitrous oxide in water-saving rice production in north china. Nutr. Cycl. Agroecosyst. 2007, 77, 293–304. [Google Scholar] [CrossRef]
  16. Okubo, T.; Sato, Y.; Azuma, Y. Movements of nitrogen and phosphorus in paddy fields utilizing irrigation water with high nutrient concentrations. J. Jpn. Soc. Water Environ. 2014, 37, 177–187. [Google Scholar] [CrossRef]
  17. Zhu, H.; Chen, X.; Zhang, Y. Temporal and spatial variability of nitrogen in rice–wheat rotation in field scale. Environ. Earth Sci. 2013, 68, 585–590. [Google Scholar] [CrossRef]
  18. Xiao, M.H.; Yu, S.E.; Wang, Y.Y.; Huang, R. Nitrogen and phosphorus changes and optimal drainage time of flooded paddy field based on environmental factors. Water Sci. Eng. 2013, 6, 164–177. [Google Scholar]
  19. Xiao, M.H.; Yu, S.E.; She, D.; Hu, X.J.; Chu, L.L. Nitrogen and phosphorus loss and optimal drainage time of paddy field under controlled drainage condition. Arab. J. Geosci. 2015, 8, 4411–4420. [Google Scholar] [CrossRef]
  20. Xiao, M.H.; Miao, Z.M.; Li, Y.Y. Changes of root-zone soil environment in flooded paddy field under controlled drainage conditions. Pol. J. Environ. Stud. 2017, 2, 881–892. [Google Scholar] [CrossRef]
  21. Ouyang, W.; Xu, Y.; Hao, F.; Wang, X.; Siyang, C.; Lin, C. Effect of long-term agricultural cultivation and land use conversion on soil nutrient contents in the sanjiang plain. CATENA 2013, 104, 243–250. [Google Scholar] [CrossRef]
  22. Xu, S.; Zhang, B.; Ma, L.; Hou, A.; Tian, L.; Li, X. Effects of marsh cultivation and restoration on soil microbial communities in the sanjiang plain, northeastern china. Eur. J. Soil Biol. 2017, 82, 81–87. [Google Scholar] [CrossRef]
  23. Kallenbach, C.M.; Rolston, D.E.; Horwath, W.R. Cover cropping affects soil N2O and CO2 emissions differently depending on type of irrigation. Agric. Ecosyst. Environ. 2010, 137, 251–260. [Google Scholar] [CrossRef]
  24. Riya, S.; Zhou, S.; Kobara, Y.; Sagehashi, M.; Terada, A.; Hosomi, M. Influence of nitrogen loading and plant nitrogen assimilation on nitrogen leaching and N2O emission in forage rice paddy fields fertilized with liquid cattle waste. Environ. Sci. Pollut. Res. 2015, 22, 5762–5771. [Google Scholar] [CrossRef] [PubMed]
  25. Hay, F.J.; Vietor, D.M.; Munster, C.L.; White, R.H.; Provin, T.L. Leaching loss of no3-n and dissolved p from manure and fertilizer during turfgrass establishment. Plant Soil 2017, 296, 1–17. [Google Scholar] [CrossRef]
  26. Parfitt, R.L.; Mackay, A.D.; Ross, D.J.; Budding, P.J. Effects of soil fertility on leaching losses of n, p and c in hill country. New Zealand J. Agric. Res. 2009, 52, 495–497. [Google Scholar] [CrossRef]
  27. Zhang, M.; Tian, Y.; Zhao, M.; Yin, B.; Zhu, Z. The assessment of nitrate leaching in a rice–wheat rotation system using an improved agronomic practice aimed to increase rice crop yields. Agric. Ecosyst. Environ. 2017, 241, 100–109. [Google Scholar] [CrossRef]
  28. Zhao, X.; Yan, X.; Xie, Y.; Wang, S.; Xing, G.; Zhu, Z. Use of nitrogen isotope to determine fertilizer- and soil-derived ammonia volatilization in a rice/wheat rotation system. J. Agric. Food Chem. 2016, 64, 3017. [Google Scholar] [CrossRef]
  29. Qiao, J.; Yang, L.; Yan, T.; Xue, F.; Zhao, D. Nitrogen fertilizer reduction in rice production for two consecutive years in the taihu lake area. Agric. Ecosyst. Environ. 2012, 146, 103–112. [Google Scholar] [CrossRef]
  30. Hashim, M.; Yusop, M.K.; Othman, R.; Wahid, S.A. Characterization of nitrogen uptake pattern in malaysian rice mr219 at different growth stages using 15N isotope. Rice Sci. 2015, 22, 250–254. [Google Scholar] [CrossRef]
  31. Jie, Z.; Wei, Z.; Wang, K.; Song, T.; Hu, D. Responses of the soil nematode community to management of hybrid napiergrass: The trade-off between positive and negative effects. Appl. Soil Ecol. 2014, 75, 134–144. [Google Scholar]
  32. Rahman, M.M.; Amano, T.; Shiraiwa, T. Nitrogen use efficiency and recovery from n fertilizer under rice-based cropping systems. Aust. J. Crop Sci. 2009, 3, 336–351. [Google Scholar]
Figure 1. Changes of leakage amount, concentration, and leaching loss of NO3-N during rice growth under different irrigation patterns, Figure a described the changes of leakage amount, Figure b described the changes of NO3-N concentration and Figure c described changes of NO3-N leaching loss. (BF-1, BF-3, BF-6, BF-10 represented the 1th, 3rd, 6th, and 10th days after the application of base fertilizer, a, b and c in the figure represented differences between groups for significance analysis).
Water 11 00218 g001
Figure 2. Changes of total NO3-N leaching loss after fertilization under different irrigation modes, Figure a described the NO3-N leaching loss after each fertilizer, and Figure b described NO3-N total leaching loss and NO3-N leaching loss in fertilizer. (BF, TF, JBF represented the base fertilizer, tilling fertilizer, and jointing-booting fertilizer, TL and TLF represented the NO3-N total leaching loss and NO3-N leaching loss in fertilizer, a, b and c in the figure represented differences between groups for significance analysis).
Water 11 00218 g002
Figure 3. Changes of NH3 volatilization loss in paddy fields under different irrigation modes, Figure a described NH3 volatilization loss in soil, and Figure b described NH3 volatilization loss in fertilizer. (BF, TF, JBF represented the base fertilizer, tilling fertilizer, and jointing-booting fertilizer, a, b and c in the figure represented differences between groups for significance analysis).
Water 11 00218 g003
Figure 4. Nitrogen uptake by rice plant under different irrigation modes, Figure a described nitrogen uptake loss from soil, and Figure b described nitrogen uptake loss from fertilizer (a, b and c in the figure represented differences between groups for significance analysis).
Water 11 00218 g004
Figure 5. Differences between leaching amounts of soil nitrogen and fertilizer nitrogen under different irrigation modes, Figure a described nitrogen leaching loss and Figure b described nitrogen residue (a, b and c in the figure represented differences between groups for significance analysis).
Water 11 00218 g005
Table 1. Field water control standards for different irrigation modes (mm).
Irrigation
Mode
Upper and Lower LimitReturn
Green
Early
Tilling
Late
Pillaring
Jointing-
Booting
Heading-FloweringMilkingYellow Maturity
W0Irrigation
lower limit
2020303010100
Irrigation
upper limit
3050606050500
Rainfall storage upper limit5070901001006020
W1Irrigation
lower limit
50.8 θs0.7 θs0.9 θs00.8 θsNatural drying
Irrigation
upper limit
302020303020
Rainfall storage upper limit40500606030
W2Irrigation
lower limit
0Exposing
field3–5 days
Exposing field
7–12 days
Exposing
field
2–4 days
Exposing
field2–4 days
Exposing field
3–5 days
Natural drying
Irrigation
upper limit
3030Exposing field404030
Rainfall storage upper limit4050Exposing field606060
Notes: θs was the field water holding capacity.
Table 2. Nitrogen uptake by rice grain and plant under at maturation stage kg/hm2 (a, b and c in the figure represented differences between groups for significance analysis).
Irrigation ModeGrainPlantTotal Amount
Total-NFertilizer-NTotal-NFertilizer-NTotal-NFertilizer-N
W0116 ± 3.46c **60 ± 4.04bns51 ± 1.73c **26 ± 0.58ans167 ± 4.04c **86 ± 3.40bns
W1171 ± 6.35a *70 ± 2.89bns70 ± 2.31a *28 ± 1.15ans241 ± 5.77a **98 ± 4.62bns
W2152 ± 1.15b *78 ± 1.73a *63 ± 1.71b *32 ± 2.83ans215 ± 2.81b **110 ± 3.90a **
Notes: ns—represented not significant; *—significant at p ≤ 0.05; **—significant at p ≤ 0.01.
Table 3. Directions of fertilizer nitrogen under different irrigation modes % (a, b and c in the figure represented differences between groups for significance analysis).
Irrigation ModeNO3-N
Leaching
Nitrogen Residual Crop Uptake of NitrogenNH3
Volatilization
Other Losses
GrainPlant
W01.04 ± 0.029a **32.1 ± 0.34a **25.1 ± 0.24c **10.8 ± 0.17c **18.7 ± 0.40ans12.3 ± 0.40ans
W10.50 ± 0.017c *28.0 ± 0.17bns29.2 ± 0.17b **11.7 ± 0.11b **17.5 ± 0.29ans13.1 ± 0.33ans
W20.60 ± 0.032b *28.0 ± 0.15bns32.4 ± 0.15a **13.2 ± 0.14a **15.1 ± 0.35b **10.7 ± 0.35b *
Notes: ns—represented not significant; *—significant at p ≤ 0.05; **—significant at p ≤ 0.01.

