Study of the Degradation of Trimethoprim Using Photo-Fenton Oxidation Technology
by
 , ,
, ,
Qi Wang
1,2,* ,
,
Wenjing Pang
1,
Yingdan Mao
3,
Quan Sun
1,
Pengfei Zhang
1,
Qiang Ke
1,2,
Hengguo Yu
2,
Chuanjun Dai
1,2 and
Min Zhao
1,2,* 1
College of Life and Environmental Science, Wenzhou University, Wenzhou 325035, China
2
Key Laboratory for Subtropical Oceans & Lakes Environment and Biological Resources Utilization Technology of Zhejiang, Department of Environmental Science, Wenzhou University, Wenzhou 325035, China
3
Department of Environmental Impact Assessment, Zhejiang Blue in Environmental Technology Co., Ltd., Wenzhou 325035, China
*
Authors to whom correspondence should be addressed.
Water 2019, 11(2), 207; https://doi.org/10.3390/w11020207
Submission received: 26 December 2018
/
Revised: 17 January 2019
/
Accepted: 23 January 2019
/
Published: 25 January 2019
(This article belongs to the Special Issue Advanced Oxidation Technologies in Industrial Wastewater Treatment)
Abstract
:Trimethoprim is one of the representative drugs within the pharmaceutical and personal care products (PPCPs) group. The photo-Fenton oxidation technology was used to degrade trimethoprim in wastewater and the extent of degradation was analyzed by using high-performance liquid chromatography, then experimentally obtained the optimal conditions. Analysis of the experimental data showed that, under the single-factor experimental conditions, the optimal conditions for degradation were a pH of 4, an H2O2 concentration of 3.0 mmol/L, an FeSO4 concentration of 0.06 mmol/L, an initial trimethoprim concentration of 0.0689 mmol/L, and an ultraviolet (UV) intensity (UVA) of 12 mW/cm2. The interaction of pH and the concentration of H2O2 and Fe2+ have been further explored, it was obtained the following response surface results through the central composite design experiment: pH = 4.56, H2O2 concentration = 0.09 mmol/L, and Fe2+ concentration = 0.09 mmol/L. Under these conditions, it can be obtained a degradation rate of 99.95% after 6 min. There were similar results for three sets of parallel experiments, indicating that these simulation conditions were feasible.
1. Introduction
With the rapid development of the economy, the problem of environmental pollution became a major research focus. Pharmaceutical and personal care products (PPCPs) represent a type of environmental pollutant that has “subtle, potential, and cumulative impact” [1]. The content of PPCPs is very low in the natural environment as a whole, but it can be detected in water, soil, and the atmospheric environment [2]. PPCPs include a range of chemical substances; for example, there are currently about 4500 different types of medicines that are widely used in the prevention and treatment of various diseases. The main sources of PPCPs in the environment include the mass use of chemicals, human and animal excreta, and the residual material in PPCP production processes [3]. Although the concentration of PPCPs in the environment is very low in most cases, with the accumulation of organisms, the concentration of PPCPs will become increasingly larger over time, and ultimately will have a profound impact and irreversible effect on ecosystems [4]. PPCPs continuously flow into the natural environment, leading to an upward trend in their residual environmental concentrations. Studies indicated that PPCPs have a certain potential physiological hazard to animals, plants, and microorganisms [5,6].
Advanced oxidation processes (AOPs) are a commonly used method for the treatment of PPCPs in water. The final product of the AOPs reaction is water, carbon dioxide, and inorganic ions, and there is no residual concentration of matter [7]. Fenton oxidation and photocatalytic oxidation were successfully applied for the removal of pharmaceutical compounds [8]. Various photocatalytic models were also applied to treat multifarious effluents which are commonly from various industries, including forest industry, agriculture, and municipal wastewater, such as the photocatalytic reactor with ultraviolet (UV) lamp module [9]. The photo-Fenton oxidation process, which combines ultraviolet radiation with a Fenton reagent, is widely used because of its excellent oxidation performance. The synergistic effect of UV on the Fenton system increases the rate of the whole reaction, reduces the dosage of the Fenton reagent, shortens the reaction time, and reduces the amount of sludge produced, which allows the organic matter to be better degraded and mineralized [10]. The main disadvantage of photo-Fenton technology is the need for removing the dissolved iron from the treated sewage. At present, after oxidation treatment, the wastewater is treated by alkalization to form insoluble Fe(OH)3, which is precipitated in the form of iron sludge [11,12].
Trimethoprim is a representative antibiotic within the PPCP group and one of the main pollutants in pharmaceutical wastewater, mainly used in synergistic antibacterial activities [13,14]. It is used individually in the treatment of respiratory tract infections, urinary tract infections, intestinal infections, and other diseases. The presence of trimethoprim in the environment, especially in water bodies, caused the emergence of bacteria that are resistant to antibiotics as a result of developing a resistance gene [15]. As a large amount of pharmaceutical wastewater containing trimethoprim is discharged into the aquatic environment, pollution with this chemical is becoming more and more serious. Trimethoprim was found in municipal wastewater treatment plants at concentrations of 2 mg/L and in surface waters at concentrations up to 0.48 mg/L [16,17]. The concentration is higher in pharmaceutical wastewater. Trimethoprim is one of the fourteen pharmaceuticals which were classified as “high risk” with hazard quotient (HQ) >10 in hospital wastewater; thus, it is necessary to remove trimethoprim from water bodies [18].
Trimethoprim is detected with high frequency in wastewater, indicating that conventional wastewater treatment processes do not effectively remove trimethoprim [19]. The photo-Fenton oxidation method was considered as a treatment with high efficiency [10]. According to References [20,21], during degradation, noxious nitrogen oxide (NOx) species are released during the AOP treatment of trimethoprim with several N heteroatoms in its structure. However, it is lower than the concentration of nitrogen in the pollutant, and cannot be considered hazardous. Several oxidation by-products during the photo-Fenton treatment of trimethoprim are in low concentration, and cannot be considered hazardous either [15]. Furthermore, up to now, there is no reported study on the use of response surface methodology (RSM) to optimize the optimal conditions of photo-Fenton oxidation degradation of trimethoprim. In this paper, the design of experiments and RSM were used to study and optimize the conditions of the photo-Fenton oxidation degradation of trimethoprim (including pH; the concentration of Fe2+, H2O2, and trimethoprim; and UV intensity). Then, the degradation rate of trimethoprim using the photo-Fenton oxidation technology and the optimal conditions were also acquired.
2. Materials and Methods
2.1. Experimental Drugs
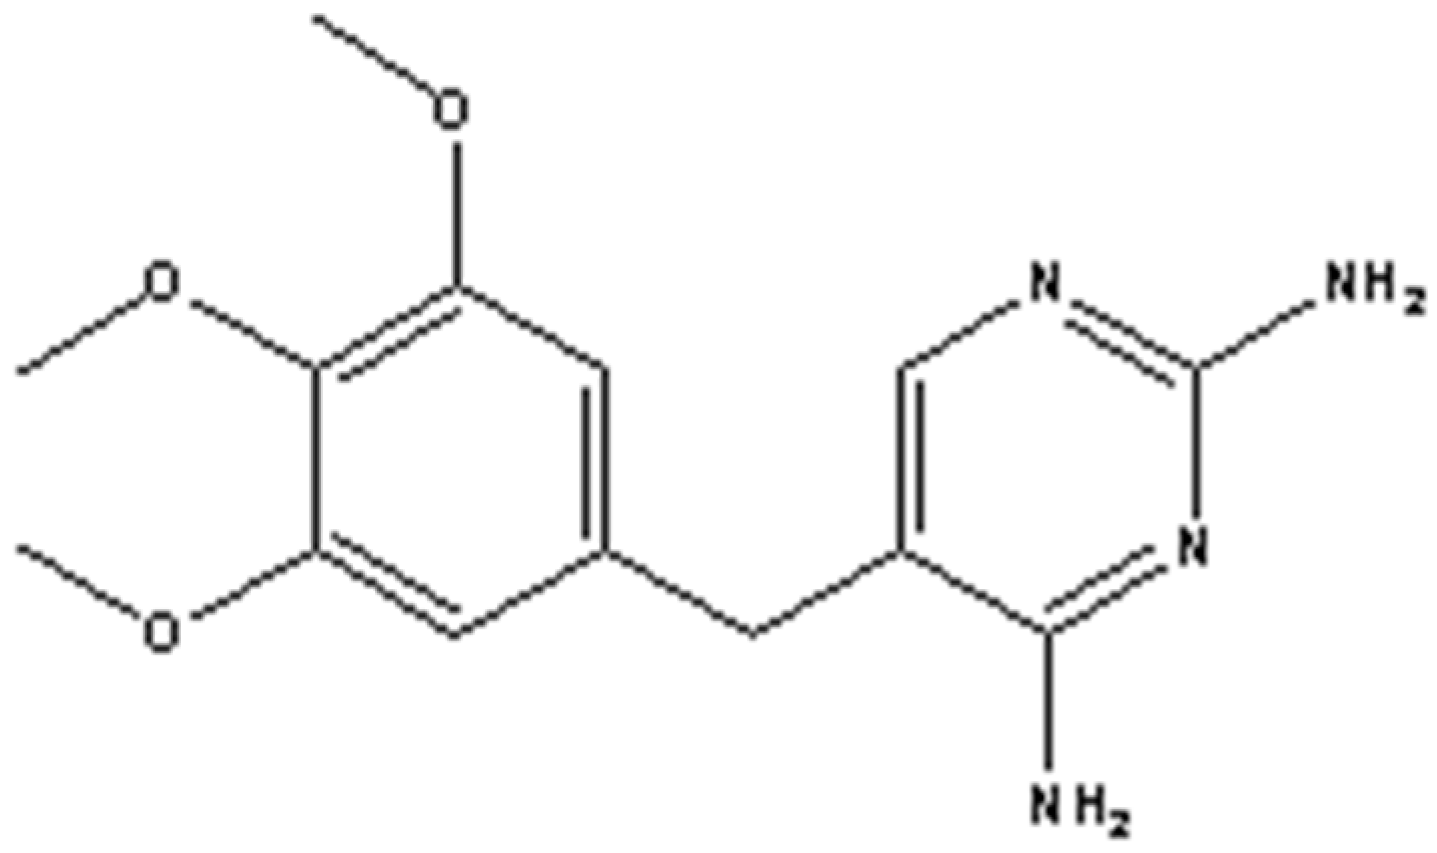
Trimethoprim is an antibacterial agent, with the typical form of a white or white crystalline powder, which is odorless, with a bitter taste. The molecular formula of trimethoprim is C14H18N4O3; it has a molecular weight of 290.32, and its chemical structure is shown in Figure 1.
2.2. Reagents and Instruments
The main reagents of the experiment are listed below. Trimethoprim (JS14829) was purchased from Shanghai Jinsui Biotechnology Co., Ltd. (Shanghai, China). HPLC-grade CH3OH was purchased from Tianjin Siyou Fine Chemicals Co., Ltd. (Tianjin, China). H2O2 was obtained from Jiangsu Tong Sheng Chemical Regent Co., Ltd. (Yixing, China). FeSO4·7H2O was purchased from Shantou Xilong chemical Co., Ltd. (Shantou, China). H2SO4 was obtained from Quzhou Juhua Reagent Co., Ltd. (Quzhou, China). HCOOH was purchased from Shanghai Chemical Regent General Co., Ltd. (Shanghai, China). H2O2, FeSO4·7H2O, H2SO4, and HCOOH used in the experiment were analytical pure grade.
All the glassware was rinsed and dried in a constant-temperature oven (DGG-9420, Ningbo’s Science and Technology Co., Ltd., Ningbo, China). During the process of the experiment, Barnstead purification (MILLIQ, Millipore Company, Molsheim, France) was necessary. An electronic balance (AL-204, Shanghai Mettler-Toledo Instruments Co., Ltd., Shanghai, China), ultraviolet analyzer (ST510, Taiwan Xianchi Company, Taiwan, China), and ultraviolet lamp (Philips TL 8 W-08 FAM, Philips Corporation, Amsterdam, Holland) were also used throughout the process, as well as a pH Meter (MODEL6250C, Shanghai Ren’s Electronics Co., Ltd., Shanghai, China), magnetic agitator (ET606, Lovibond Company, Düsseldorf, Germany), and high-performance liquid chromatograph (Type 2695 pump, PDA2996 type, Waters Corporation, Milford, MA, USA).
2.3. Experimental Method
2.3.1. Solution Preparation
To prepare the trimethoprim stock solution, 200 mg of trimethoprim powder was dissolved in ultrapure water. The medicine completely dissolved with the help of an ultrasonic cleaning machine. Then, the ultrapure water was used to maintain a constant volume in a 1-L volumetric flask. Then, 200 mg of solid FeSO4·7H2O was dissolved in the ultrapure water to prepare the FeSO4 intermediate fluid. The ultrapure water was used to maintain a constant volume in a 1-L volumetric flask under acidic conditions. Next, 1 mL of 30% H2O2 was dissolved in a 100-mL volumetric flask to obtain the H2O2 intermediate fluid, and the resultant concentration of H2O2 was 0.1 mol/L. Finally, 0.5 mL of HCOOH was dissolved in a 100-mL volumetric flask to generate the HCOOH solution.
2.3.2. Experimental Apparatus
The 100-mL reaction solution was placed on a magnetic mixer. The magnetic mixer was helpful for mixing the reaction solution. The UV lamp with an iron bench was conveniently mobile, and emitted UVA light in the wavelength region 320–400 nm with λmax = 360 nm. The experimental device was arranged in a darkroom and outside interference was avoided to protect the subjects from UV irradiation experiments. Because different beaker positions may affect the degradation of trimethoprim, all degradation experiments were fixed in a position to prevent effects caused by the different location of the degradation.
2.3.3. Analytical Test Methods
In this experiment, the concentration after degradation was determined with the W2695 high-performance liquid chromatograph (Waters Corporation, Milford, MA, USA), with a photodiode array detector (PDA2996, Waters Corporation, Milford, MA, USA) and pillars (C18, Waters Corporation, Milford, MA, USA) [22]. Scanning the full wave band of 210–450nm, the mobile phase was 1% HCOOH:CH3OH = 7:3. The flow rate was 1.0 mL/min, and the quantity of sampling was 10 uL. The Empower software was used to integrate the peak area, and the peak area ratio was used to calculate out the removal rate. The three-dimensional (3D) scan of trimethoprim showed that chromatography was a suitable method for trimethoprim purification and separation. According to the result, the maximum absorption wavelength of trimethoprim was 270.2 nm, which was used as the characteristic absorption peak of trimethoprim in this study. The trimethoprim retention time was 4.60 min.
The removal percentage of each sampling point could be calculated according to the following calculation formula:
where Ci is the concentration of trimethoprim at different time points (mmol/L), and C0 is the concentration of trimethoprim at time zero (mmol/L).
Then, the removal percentage was compared over the same period of time to reflect the quality and degradation effect of trimethoprim. In this case, a higher removal rate resulted in a better degradation effect.
2.4. Experimental Program
2.4.1. Photo-Fenton Blank Experiment
As this study was aimed at high-concentration pharmaceutical wastewater, a higher concentration of trimethoprim was used in the experiment. The reaction solution was 100 mL, the trimethoprim concentration was 0.0689 mmol/L, and photo-H2O2, photo-Fe2+, photo-Fenton, Fenton, and UV were used in the reaction. The type of UV used in the experiment was UVA, because UVA can remove more waste than UVC under the same conditions [23]. The degradation times were 0, 2, 4, 6, 10, 20, and 30 min, and the degradation percentage was measured in each case.
2.4.2. Photo-Fenton Single-Factor Optimization Experiment
For this experiment, the trimethoprim concentration was initially 0.0689 mmol/L, while the concentration of H2O2 was 2.0 mmol/L, and the concentration of Fe2+ was 0.04 mmol/L; the pH was adjusted to 2.5, 3.0, 3.5, 4.0, and 4.5. Then, the degradation experiments were carried out under the UV lamp. When the degradation times were 0, 2, 4, 6, 10, 20, and 30 min, 1-mL samples were taken into the sample bottle, which contained 100 µL of methanol for quenching [24]. Then, the degradation percentage of trimethoprim was determined with HPLC. Then, under the previous optimized conditions, we sequentially changed one of the conditions in turn, and kept the other conditions the same. The specific experimental conditions were as follows: the concentrations of H2O2 were 0, 0.5, 2.0, 3.0, and 5.0 mmol/L; the concentrations of Fe2+ were 0, 0.02, 0.04, 0.06, and 0.08 mmol/L; the concentrations of trimethoprim were 0.0344, 0.0517, 0.0689, 0.0861, and 0.1033 mmol/L; and the irradiation distance of the UV lamp was also adjusted to change the UV intensity to carry out the degradation experiment.
2.4.3. Central Composite Experimental Design
To take into account the interaction of pH and the concentrations of H2O2 and Fe2+, a central composite experimental design approach was used to explore the optimal degradation conditions. In this study, the optimal conditions in different pH, H2O2 concentrations, and Fe2+ concentrations were analyzed with response surface methodology (RSM). The central composite experimental design parameters were determined according to the single-factor optimization experiment results.
3. Results and Discussion
3.1. Photo-Fenton Blank Experiment
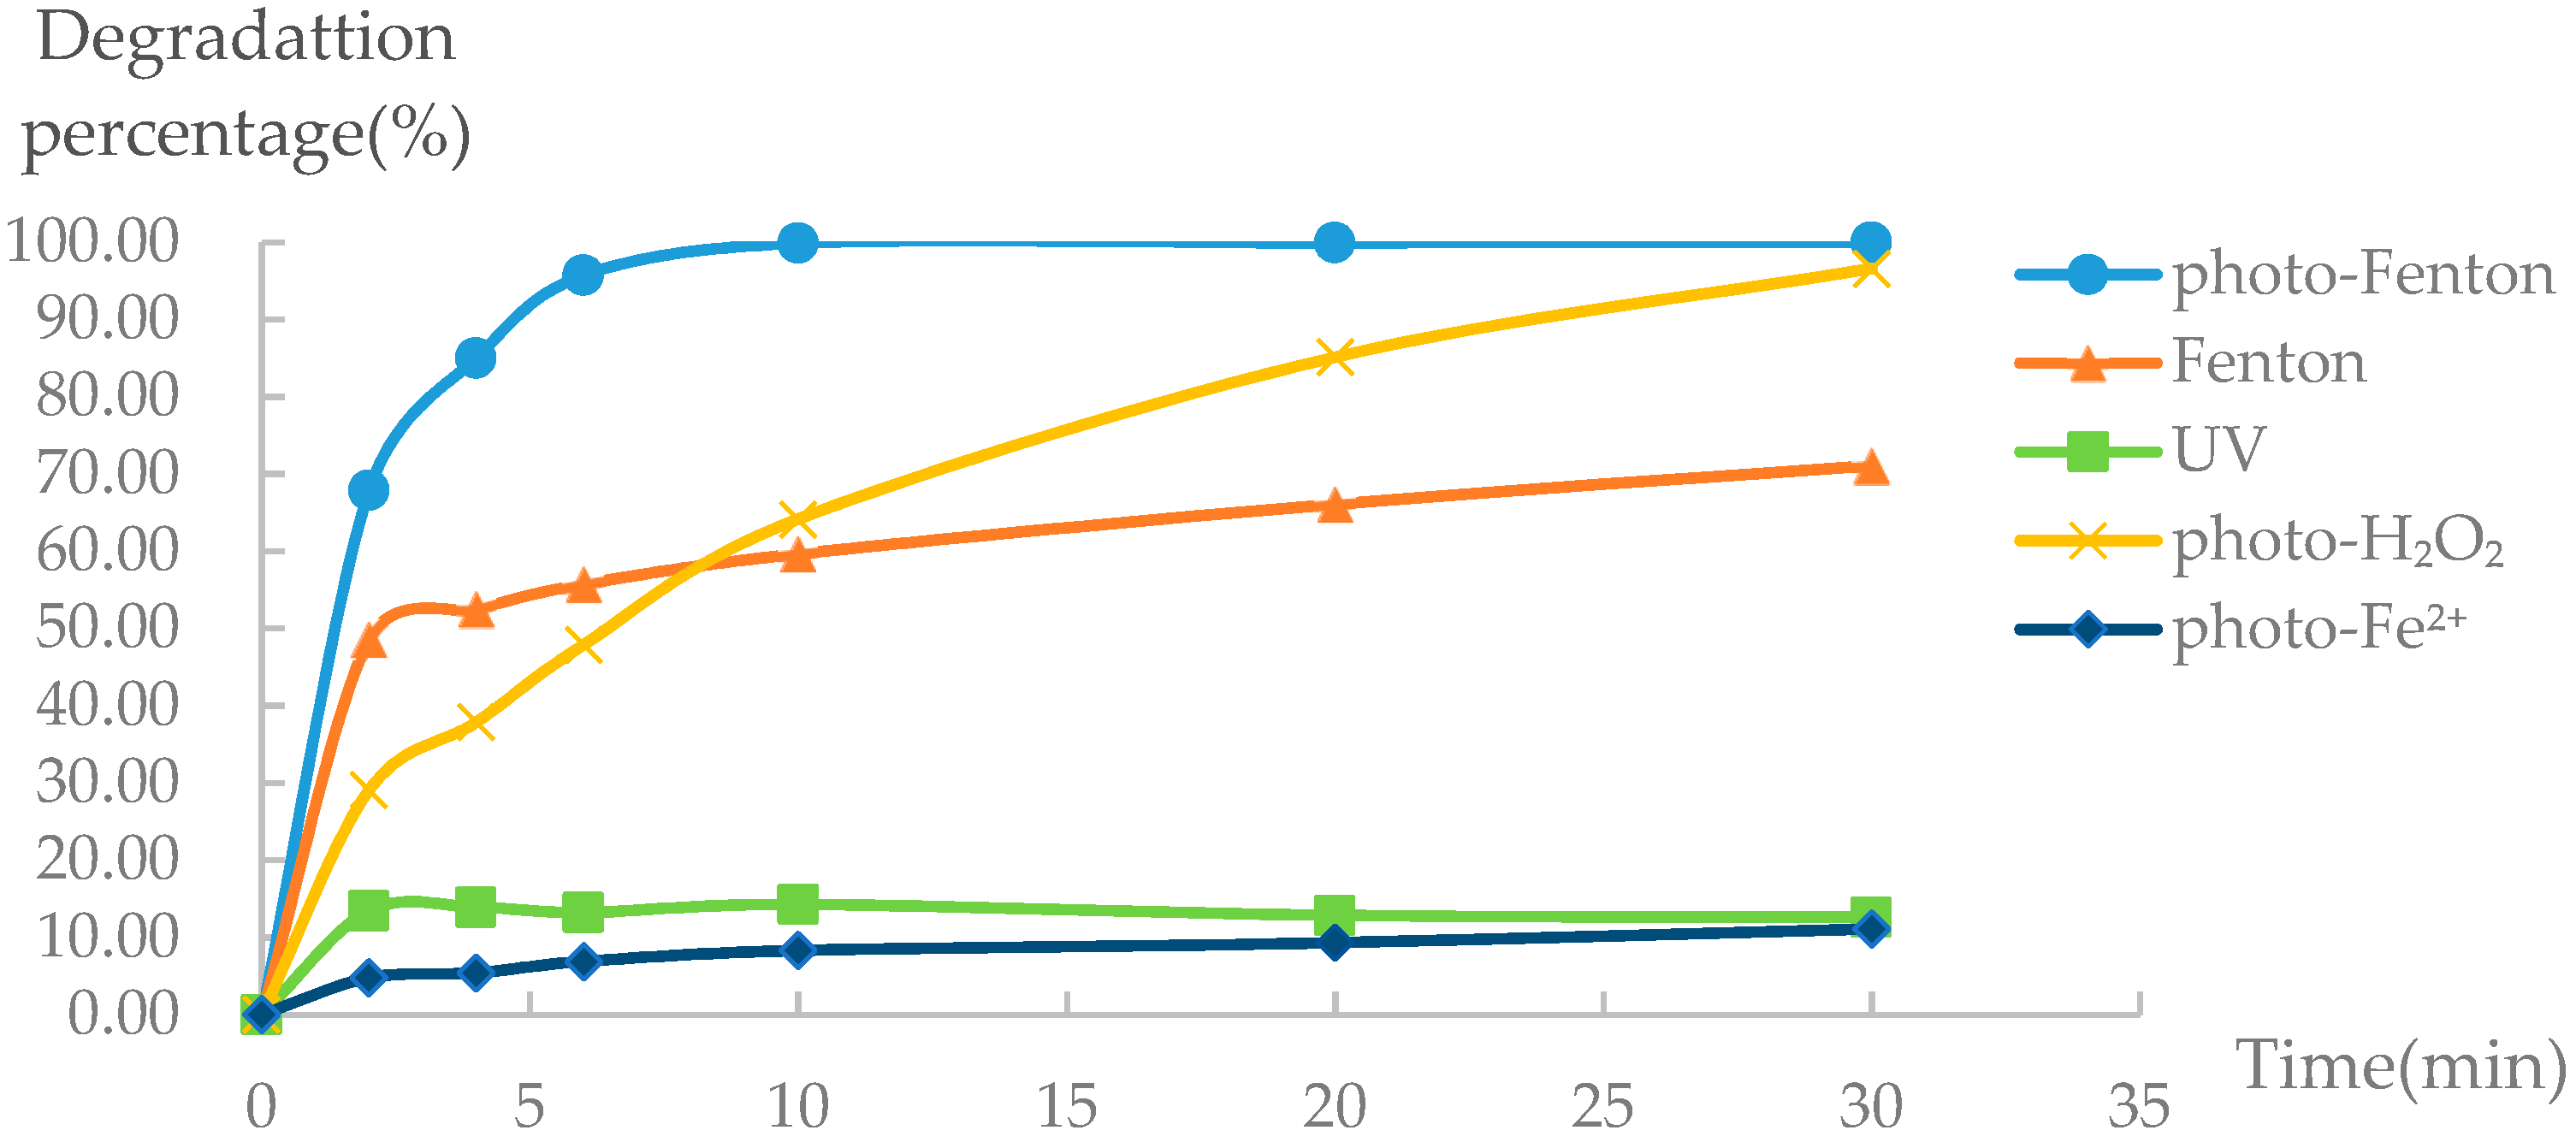
The experiments were conducted in the presence of UV, Fenton, photo-H2O2, photo-Fe2+ and photo-Fenton (Figure 2). The experimental results indicate that, when using photo-Fe2+ or UV alone, the reaction was barely carried out. When using Fenton, the degradation effect was improved, but it was not completely degraded. When using photo-H2O2, it was completely degraded in 30 min. In comparison, the trimethoprim was degraded substantially using photo-Fenton, and it was completely degraded in 10 min, indicating that the degradation effect was considerable. This result shows that the addition of UV irradiation has a synergistic effect on the Fenton system. During the Fenton reaction, Fe2+ ions are converted to Fe3+ ions; however, when UV was added to the reaction system, Fe2+ was regenerated via the photo-reduction of Fe3+ [25]. The newly generated ferrous ions reacted with H2O2 in the next cycle.
Under the conditions of the photo-Fenton system, UV radiation can directly decompose H2O2 into hydroxyl radicals as follows:
Fe2+ can be partially converted to Fe3+; the transformation of Fe3+ in acidic medium can be hydrolyzed to produce hydroxyl Fe(OH)2+. Moreover, the high concentration of Fe3+ also contributes to consuming a higher amount of H2O2, which releases the weaker oxidant HO2· [26]. Under UV light (<300 nm), Fe(OH)2+ can be converted to Fe2+, and produce ·OH at the same time.
The above formula indicates that the decomposition rate of H2O2 is much greater than a simple addition of the decomposition rates due to Fe2+ or UV. Because of the above factors, the treatment efficiency of the photo-Fenton system is affected by much more than Fenton alone.
3.2. Photo-Fenton Single-Factor Optimization Experiment
3.2.1. The Influence of pH on Removal Efficiency
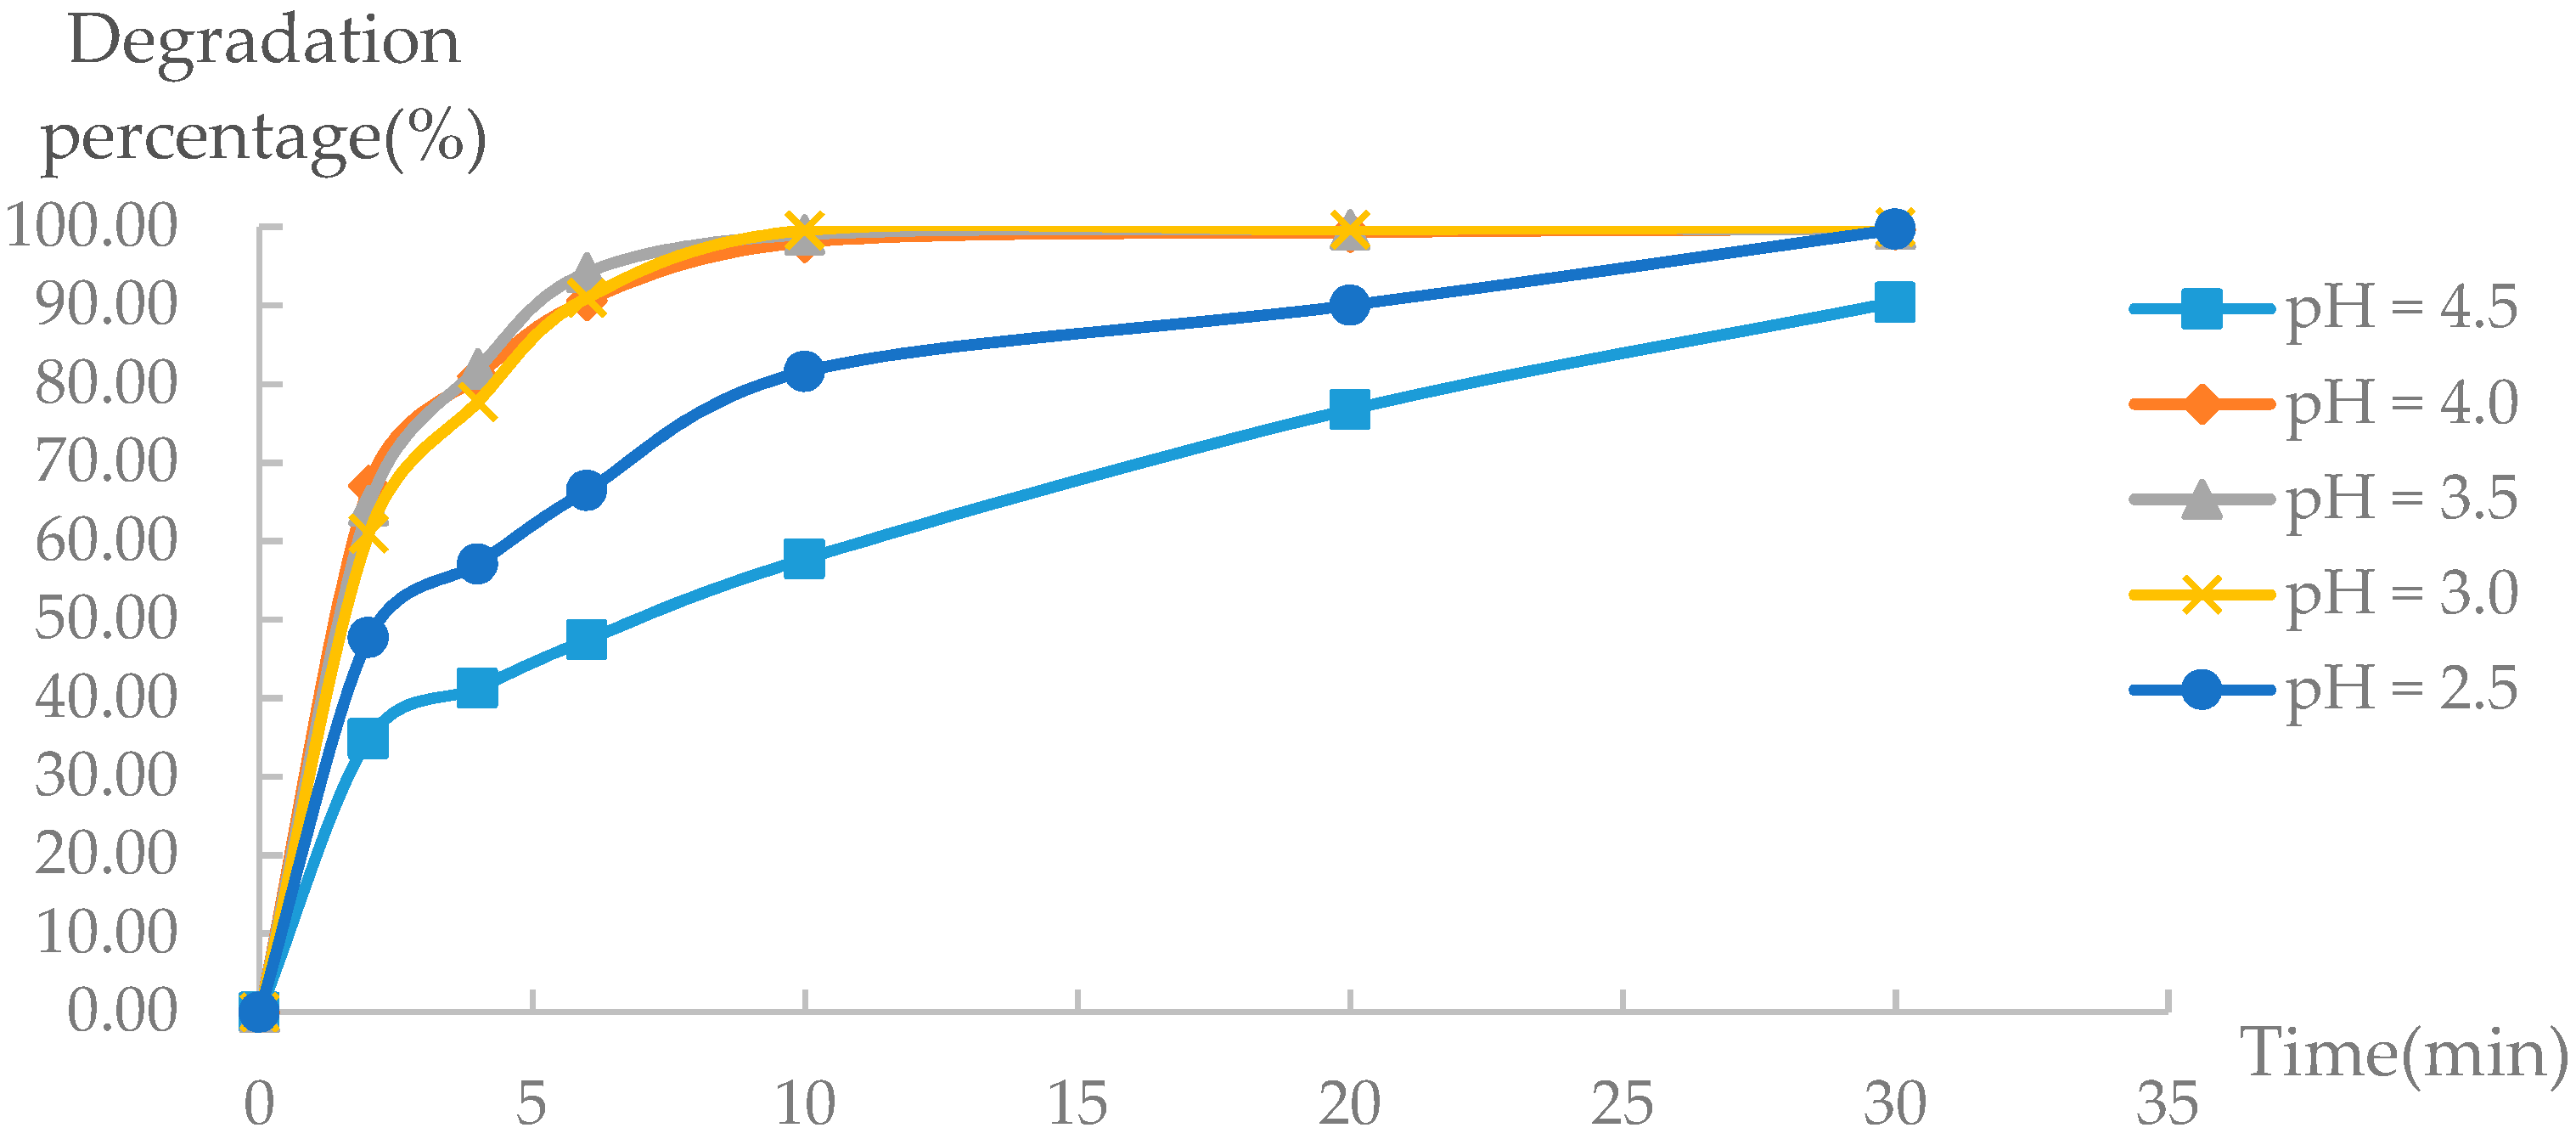
The Fenton reagent method needs to be carried out under acidic conditions, largely because the acidic environment is favorable for the existence of Fe2+. The precipitation of iron catalysts as iron hydroxide stops the extent of the Fenton reaction when it is carried out under alkaline conditions. Most of the literature shows that the Fenton reaction is optimal when the pH is about 3; at this pH, the solution can produce a large number of Fe(OH)+ ions, which has an activity higher than Fe2+ [27]. Therefore, the pH range examined in this paper was from 2.5 to 4.5.
The experimental results (Figure 3) under different pH conditions show that the best degradation of the trimethoprim occurred at pH values from 3.0 to 4.0. When pH > 4.0, the removal was limited by the lower catalyst activity, resulting from the presence of relatively inactive iron oxohydroxides and the formation of ferric hydroxide precipitate [28]. The Fe2+ rapidly forms ferric hydroxide precipitation or other forms of iron that cause Fe2+ decline, and the reaction between Fe2+ and hydrogen peroxide forms hydroxyl radicals that slow down and otherwise influence the Fenton reaction [29]. However, with the pH as low as 2.5, the degradation effect decreased. This is because a low pH reduces the stability of H2O2 and may release a proton to form hydronium (H3O+), enhancing its stability; however, this can reduce the reactive activity of Fe2+ when it participates in the degradation process [30]. Finally, in order to reduce the cost of acid, a pH of 4.0 was chosen as the best condition.
3.2.2. The Influence of H2O2 Dosage on Removal Rate
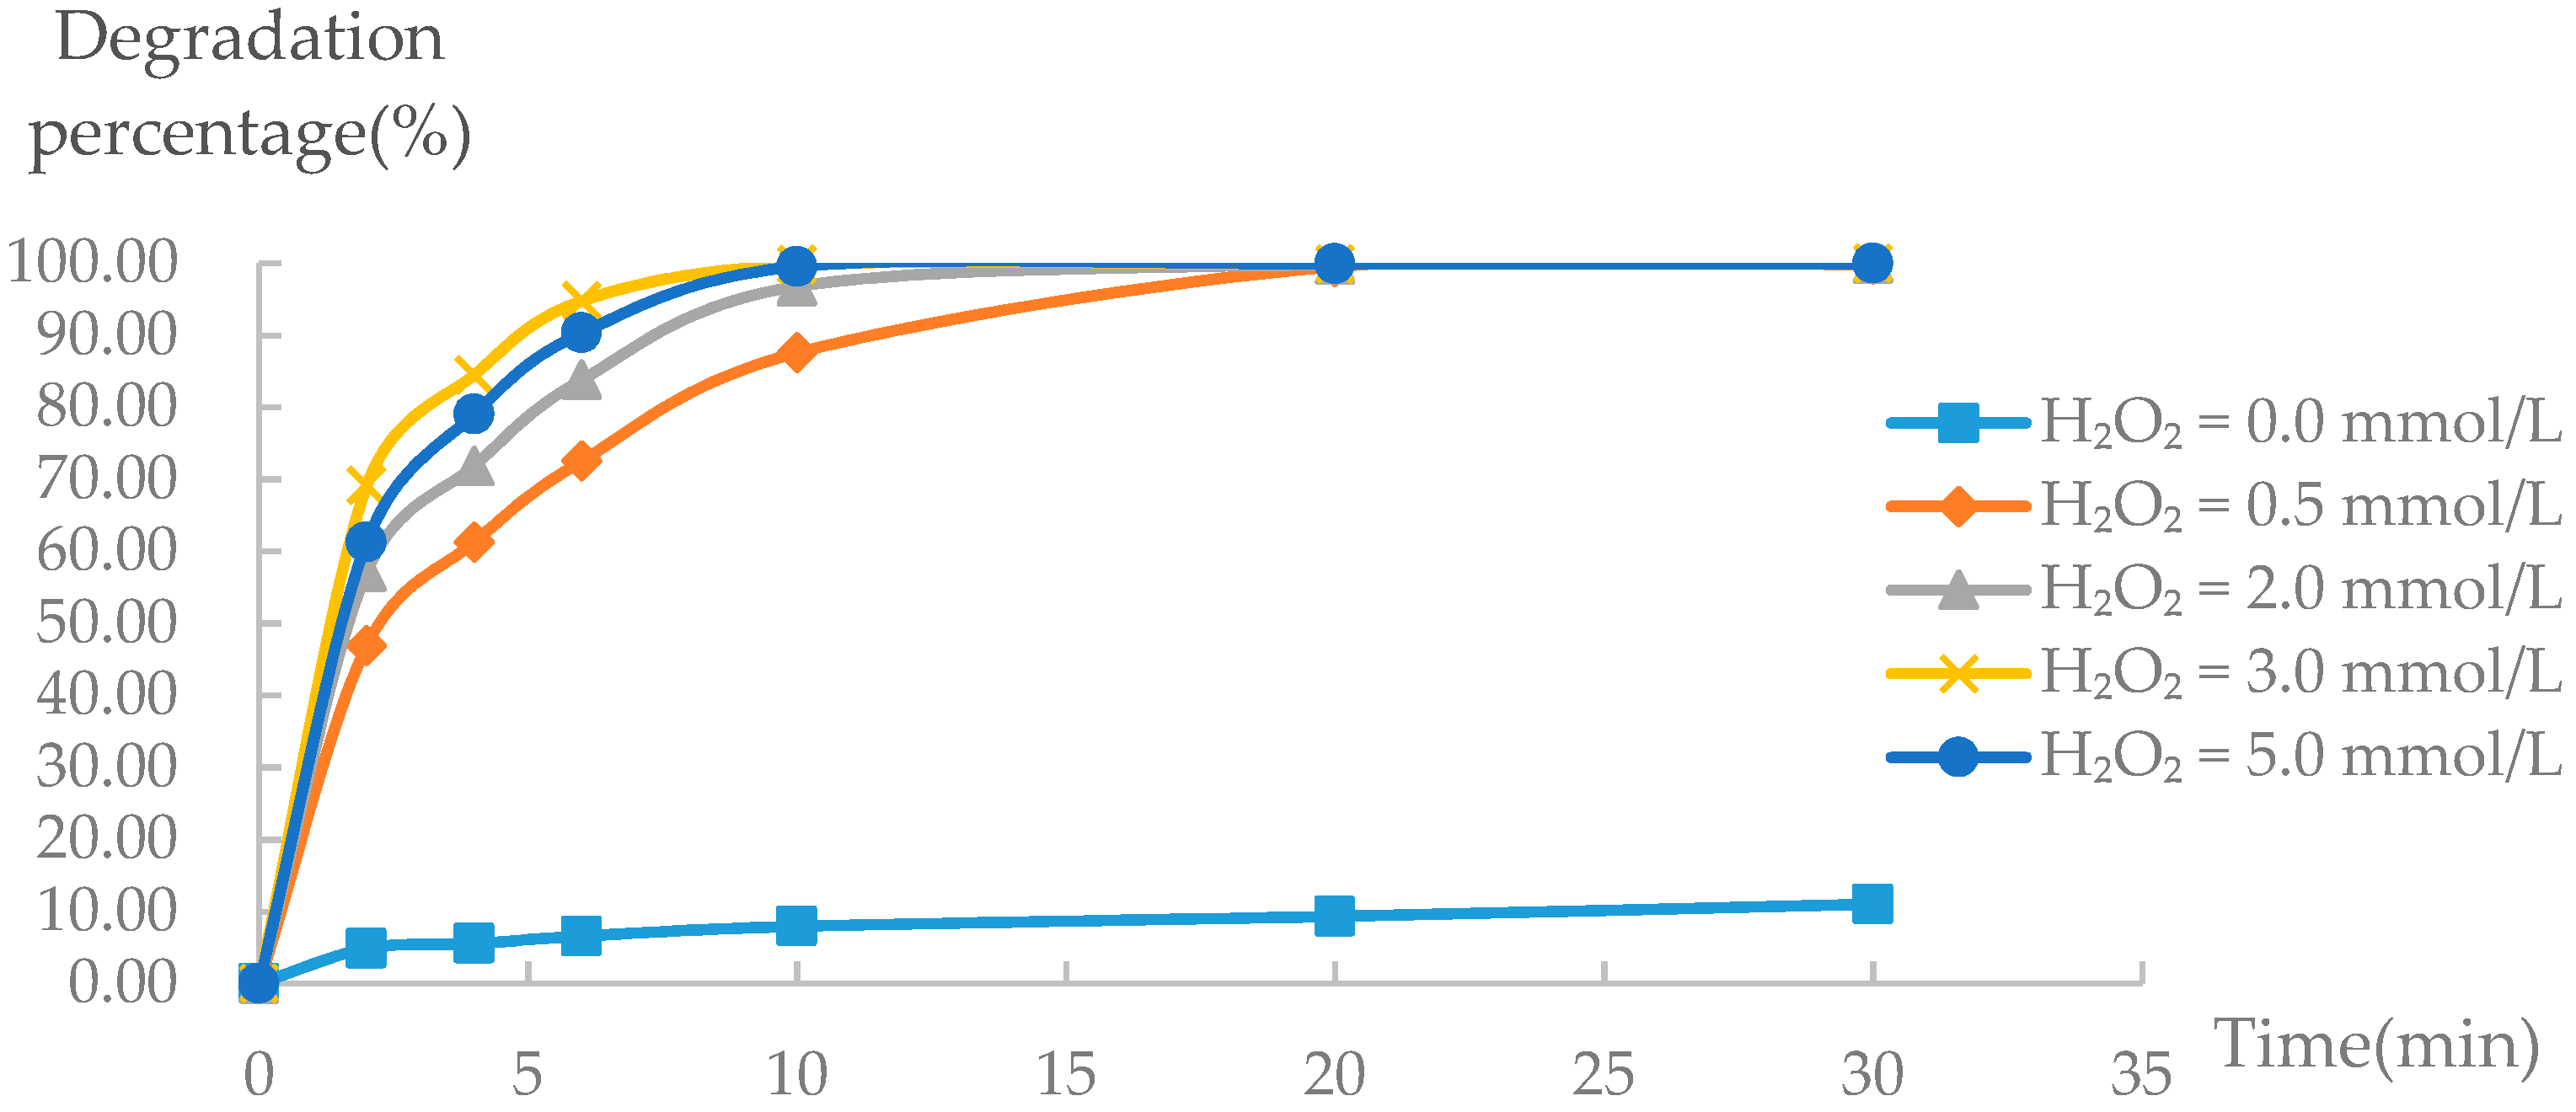
The hydroxyl radical produced by the reaction of hydrogen peroxide in the Fenton reaction is one of the important factors that influence the reaction. The key principle of the Fenton reagent method is that the hydroxyl radical oxidizes organic compounds to readily biodegradable intermediate products. Therefore, the concentration of hydroxide free radicals directly affects the whole reaction system. In this study, concentrations of H2O2 ranging from 0 to 5 mmol/L were examined for the removal rate of trimethoprim (Figure 4).
The experimental results show that, with the increase of the dosage of H2O2, the degradation effect gradually improved. When the concentration of H2O2 was 3 mmol/L, trimethoprim was completely removed within 10 min. However, the treatment effect did not increase with the increase of H2O2; it shows that when the H2O2 concentration was 5 mmol/L, the degradation rate began to decline slightly. This may be because an excess of H2O2 and ·OH will react to generate H2O·, and H2O· is easy to produce with the HO· reaction, which not only consumes the HO·, but also prevents H2O2 decomposition. Finally, the optimal concentration of H2O2 was chosen as 3 mmol/L.
3.2.3. The Influence of FeSO4 Dosage on Removal Rate
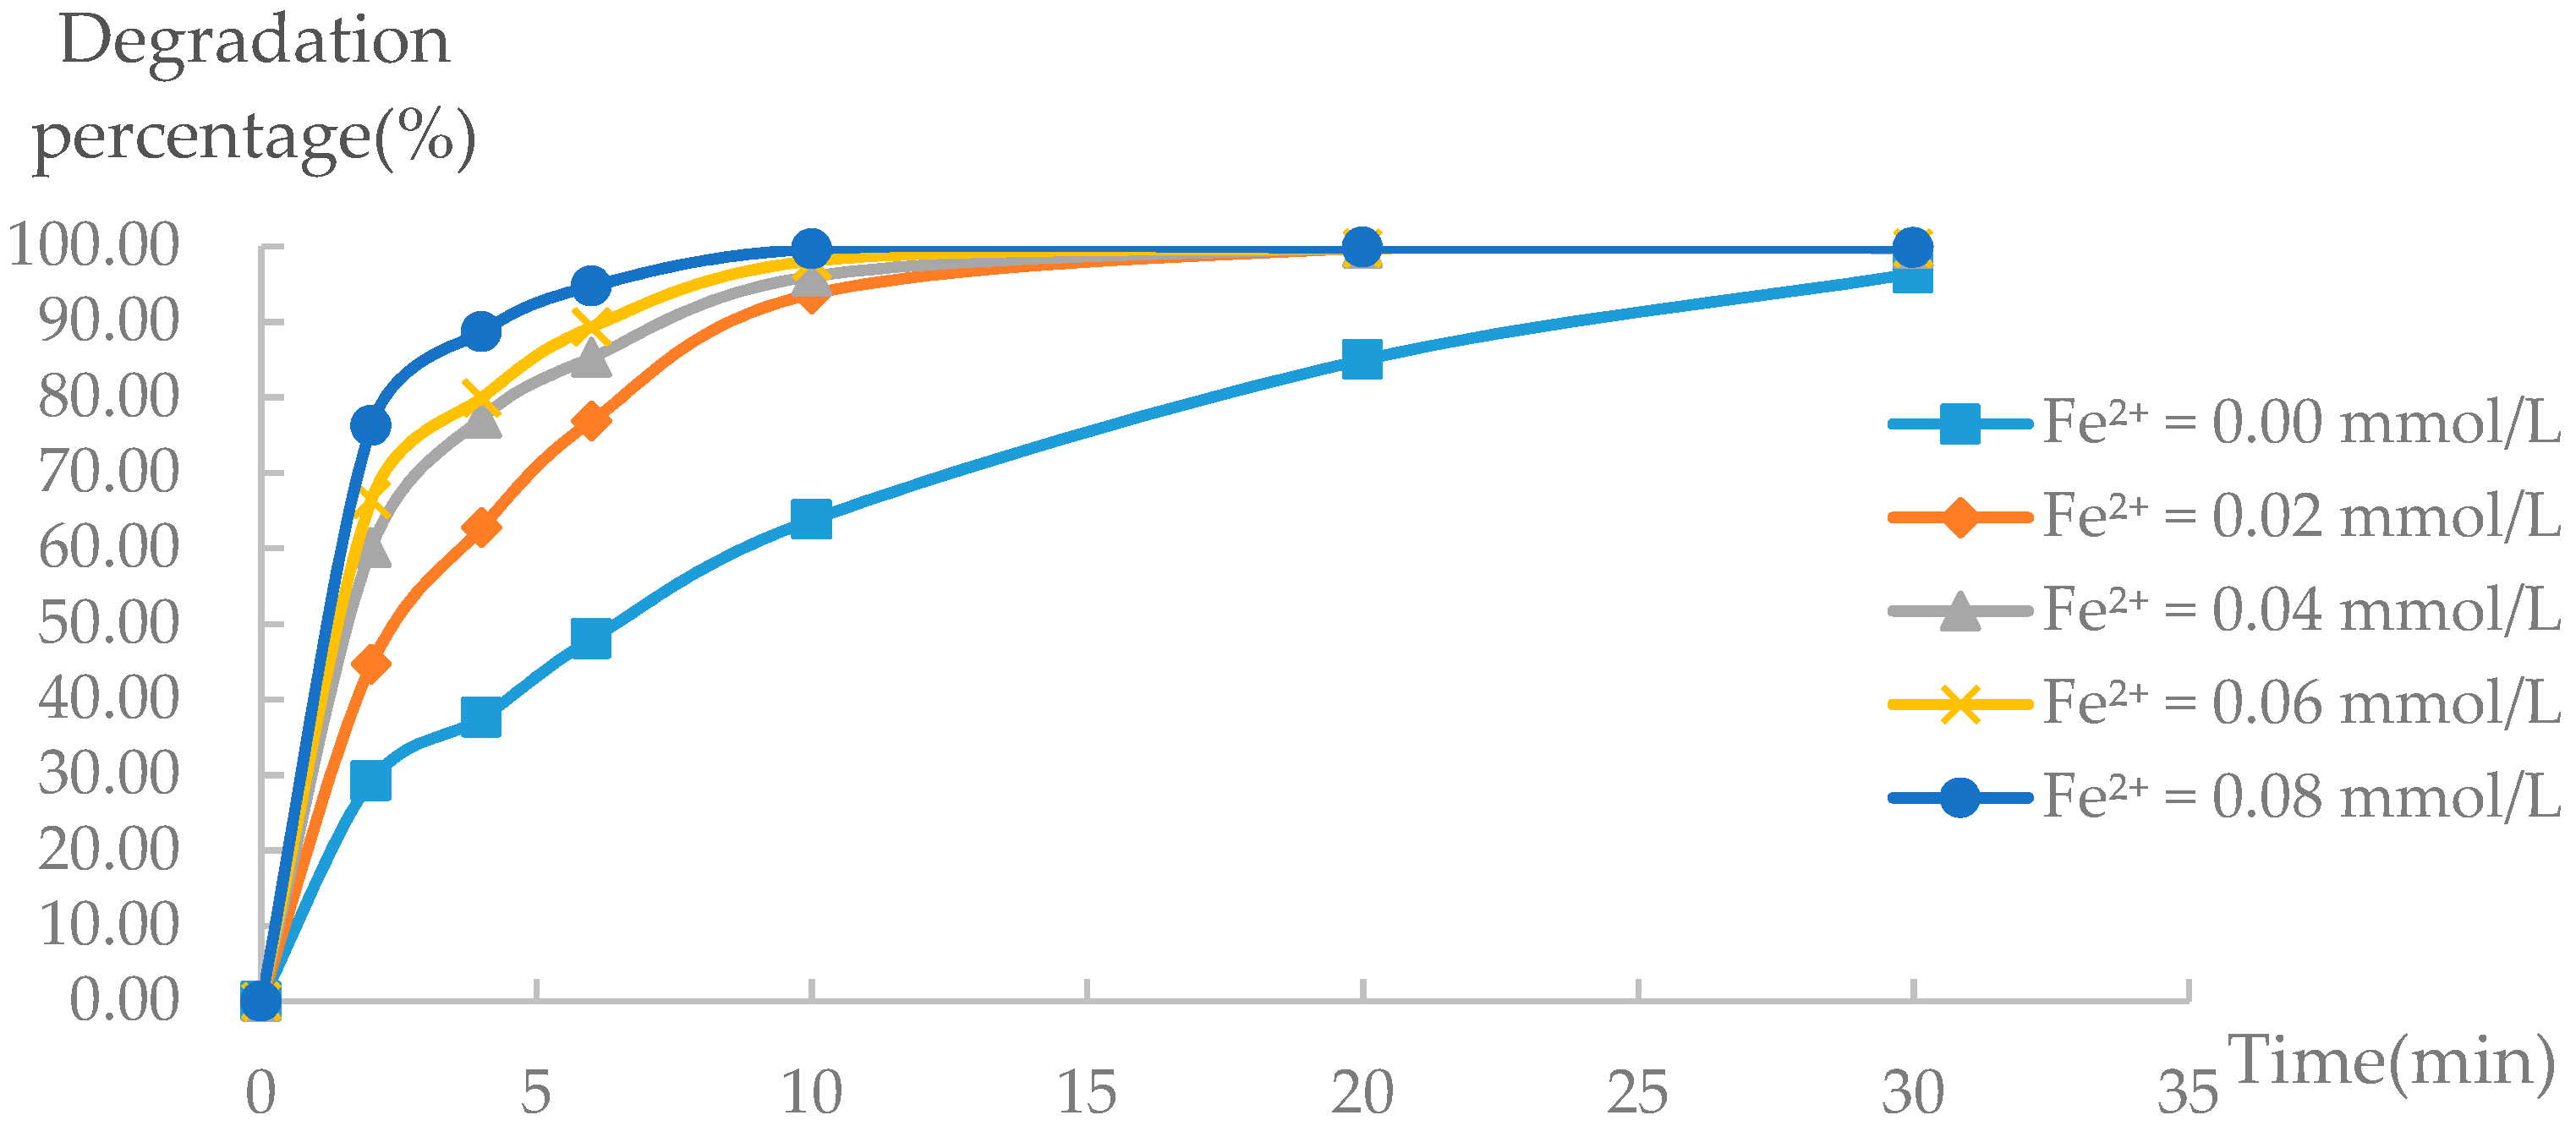
Ferrous iron ions are generally believed to play a catalytic role in the Fenton reaction because they can cause H2O2 to generate hydroxyl radicals. The concentration of Fe2+ was varied between 0 and 0.08 mmol/L.
The results (Figure 5) show that, with the increase of the dosage of Fe2+, the degradation effect of trimethoprim improved. This trend is mainly associated with the scavenging effect of Fe2+ at higher Fe2+:H2O2 ratios [31]. When the Fe2+ concentration was 0 mmol/L, the degradation process did occur, but its rate was much slower than the reaction with added Fe2+. When the concentration of Fe2+ was 0.06 mmol/L, the trimethoprim was almost completely degraded within 10 min and the degradation rate reached 98.01%. Because too much Fe2+ discharged into the water body will cause water pollution and increase the burden on the environment and the cost of degradation, the optimal Fe2+ concentration was chosen as 0.06 mmol/L.
3.2.4. The Influence of the Initial Concentration of Trimethoprim on the Removal Rate
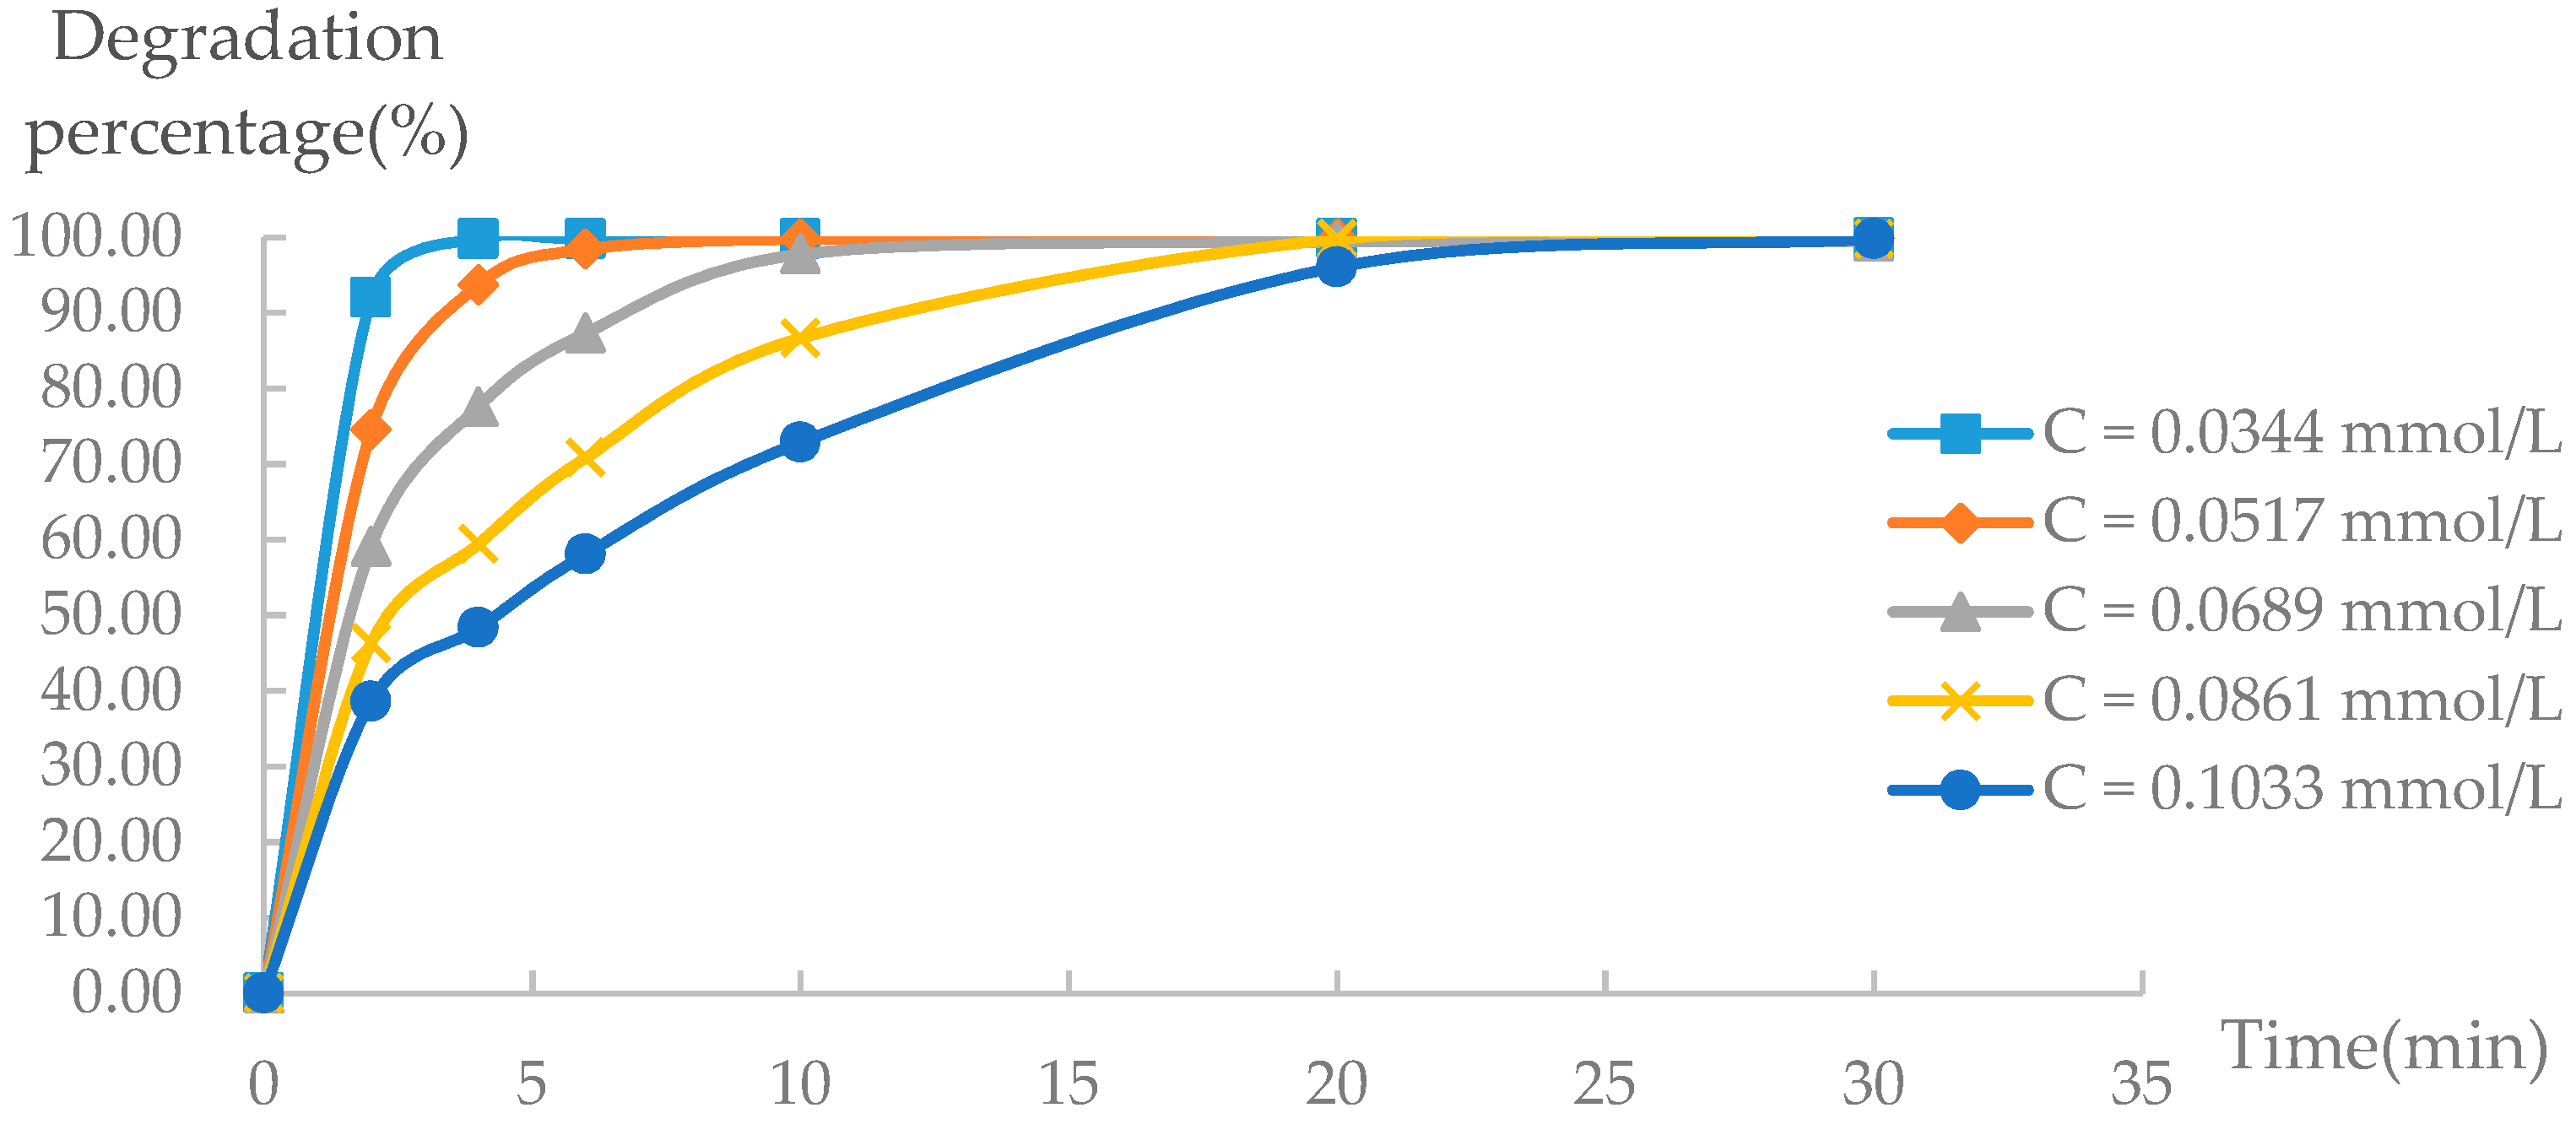
The concentration of trimethoprim in water is not fixed in practice nor is it fixed under field conditions, and different initial concentrations will also affect the degradation. Therefore, it is of practical importance to study the optimal initial concentration of trimethoprim. In this experiment, the concentration of the trimethoprim was varied between 0.0344 mmol/L and 0.1033 mmol/L, before being degraded under the optimized photo-Fenton conditions.
The experimental results (Figure 6) show that, with the increase of the dosage of trimethoprim, the degradation of trimethoprim decreased. On the one hand, under the optimal conditions in terms of the amount of catalyst, too much trimethoprim consumed a large amount of hydroxyl radicals in the initial reaction, thus reducing the catalytic effect. On the other hand, an increased initial trimethoprim concentration reduced the intensity of the irradiation on the surface of the catalyst, and caused a reduction of the photocatalytic effect. However, this effect should be very small due to the fast kinetics. When the concentration of trimethoprim was 0.0689 mmol/L, the trimethoprim was almost completely degraded within 10 min, and the degradation rate reached 98.08%. Thus, 0.0689 mmol/L was selected as the optimal initial trimethoprim concentration for degradation.
3.2.5. The Influence of Different UV Light Intensities on Trimethoprim Degradation
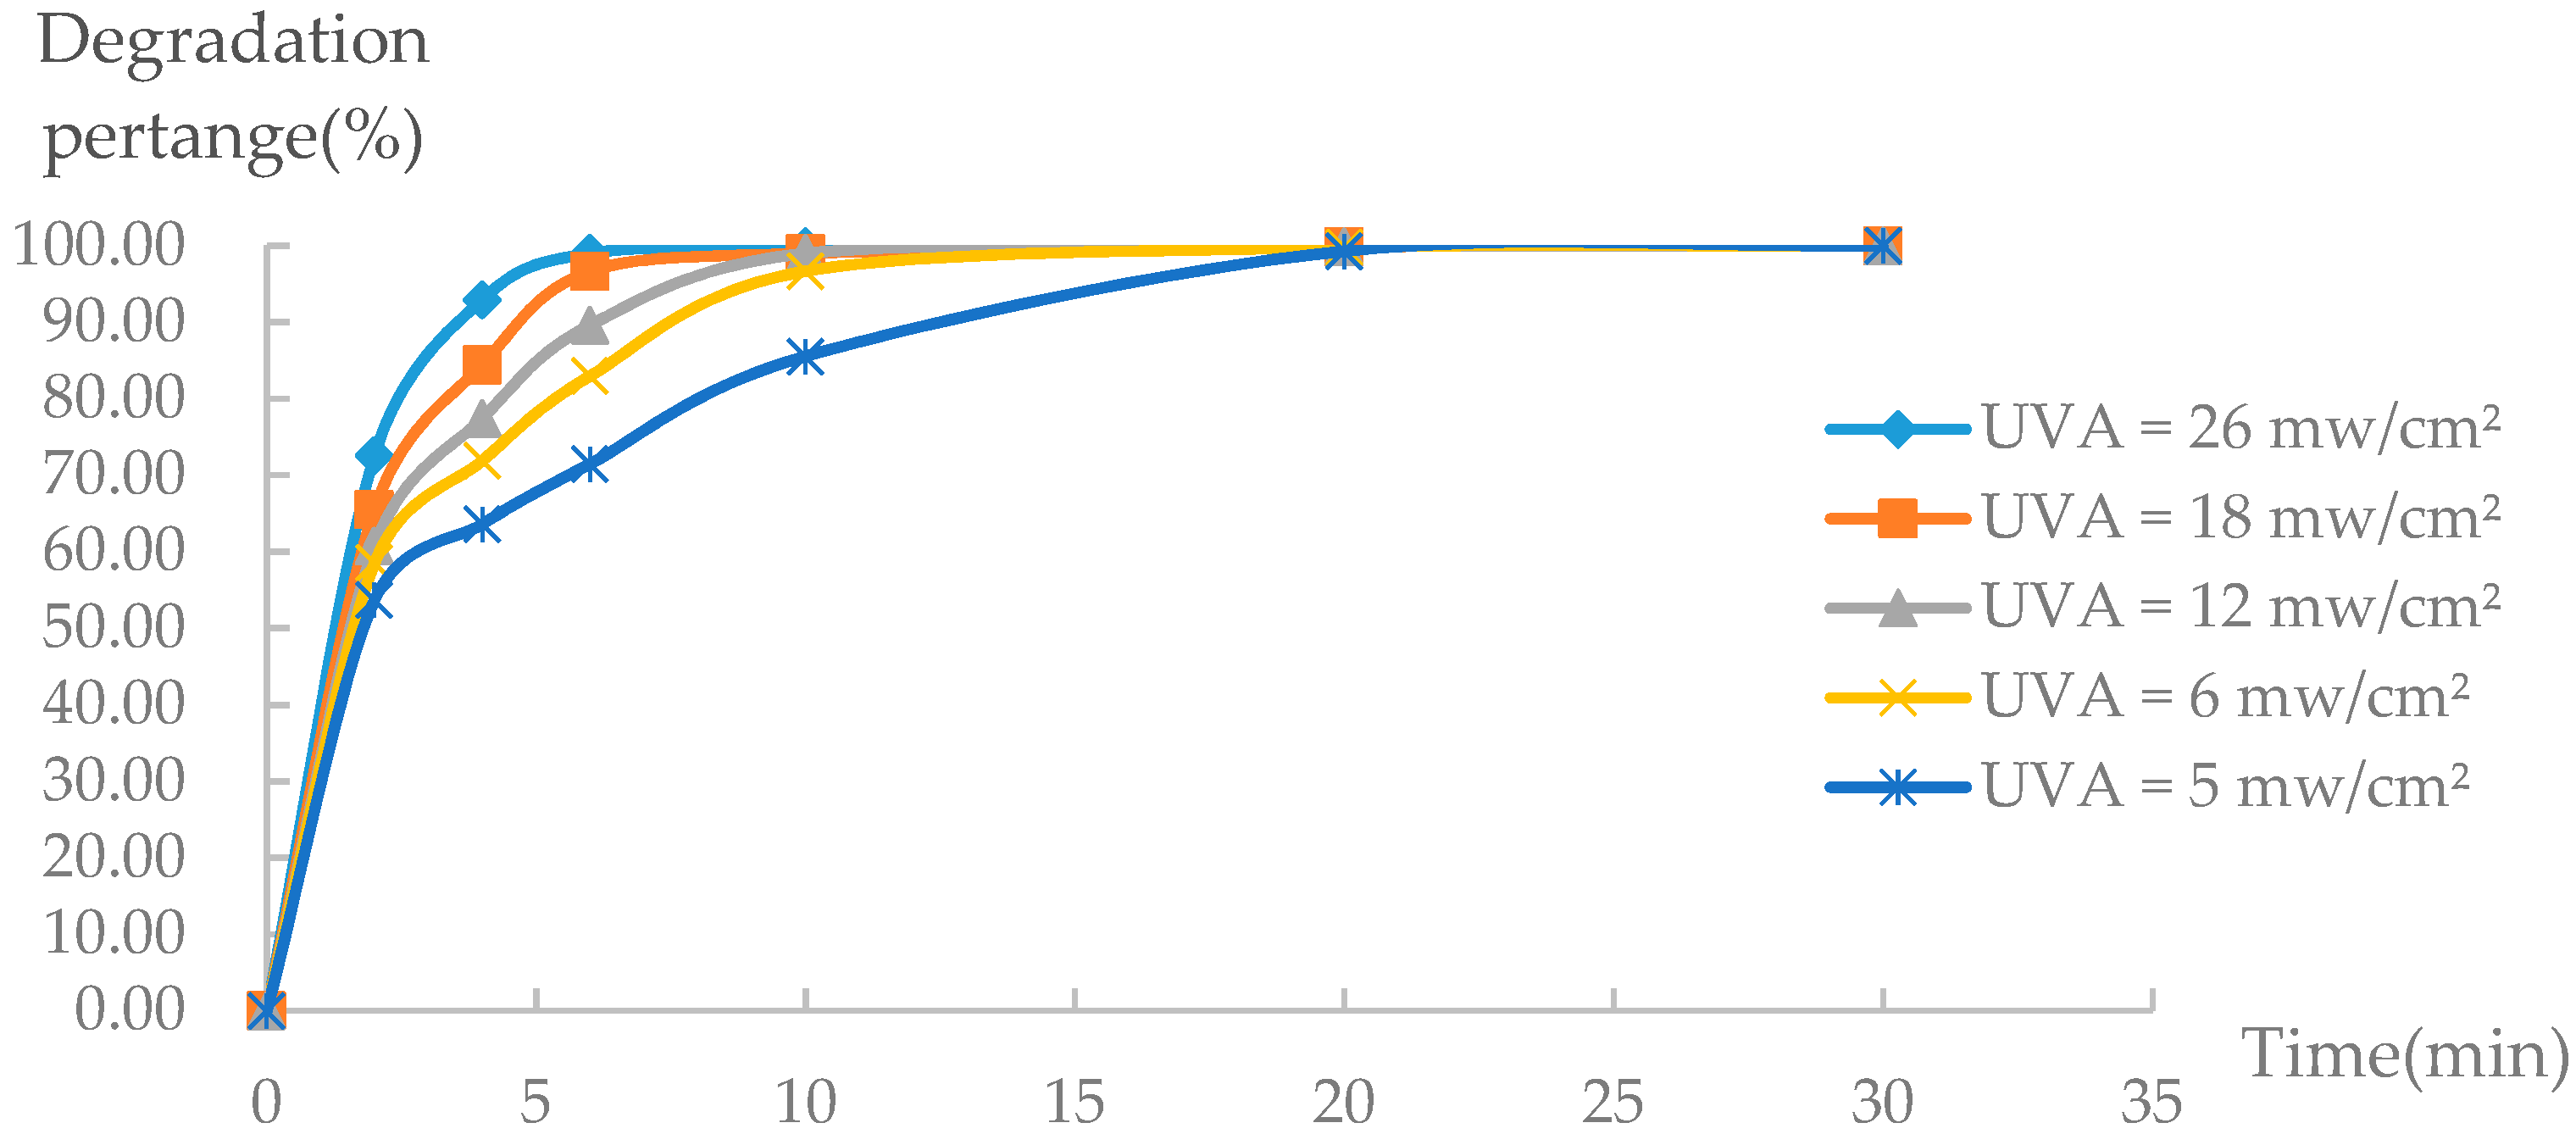
It is clear from the blank experiment that UV irradiation had a synergistic effect on the Fenton system alone. Different UV light intensities have an effect on the promotion of the degradation experiment. Therefore, we needed to determine the optimal intensity of UV light degradation of trimethoprim. To achieve this, the UV intensity was changed by altering the distance between the iron stand and the sample, before measuring the light intensity at different locations. The experimental results (Figure 7) show that, with the increase of UV intensity, the degradation effect of trimethoprim was greater because UV promoted trimethoprim decomposition. The stronger the light intensity was, the greater the promotion effect became. The optimal condition of light intensity was UVA = 12 mW/cm2.
3.3. Central Composite Experimental Design Optimization
Taking into account the interaction of pH and the H2O2 and Fe2+ concentrations, the central composite experimental design approach was used to explore the optimal degradation conditions. Response surface analysis can greatly improve the test efficiency and obtain the expected results. According to the single-factor optimization experiment, the optimal conditions were as follows: pH = 4; H2O2 concentration = 3 mmol/L; Fe2+ concentration = 0.06 mmol/L; and UVA = 12 mW/cm2. Through a preliminary experiment, the three factors and five levels of central composite design were used to optimize the possible existence of the optimal degradation conditions. This design is shown in Table 1.
Design Expert 8.0.5b software (Stat-Ease, Inc., Minneapolis, MN, USA) was used to design the experimental sequence and produce the 20 groups of complete factors of the experiment. Then, the experiment was carried out according to the order of the experimental design group (Table 2), and the degradation rate after 6 min was determined. The test results of each group are shown in Table 2. The highest degradation rate was 97.62% when the experimental conditions were pH = 4.00, H2O2 concentration = 5.5 mmol/L, and Fe2+ concentration = 0.06 mmol/L. Under these conditions, the consumption of H2O2 and Fe was too large, resulting in high cost; thus, it was necessary to optimize the condition.
The ANOVA results of the trimethoprim degradation model are shown in Table 3.
Through ANOVA, the model F-value of 8.20 implies that the model was significant, and the coefficient of variation (R2 = 0.88) indicates a comparatively high correlation between the observed and predicted values. Adequate precision compares the range of the predicted values at the design points to the average prediction error. Ratios >4 indicate adequate model discrimination [32]. It was found that p = 0.0014, suggested the experimental model was statistically significant at the 0.05 level. The regression equation of the predicted trimethoprim degradation percentage is shown below.
Degradation percentage = 89.37 − 1.07A + 13.70C + 6.34AC − 7.30A2 − 5.15C2.
The levels of A, B, and C were computed with the following equations: a = (A − 4) / 1.5; b = (B − 3) / 1.5; c = (C − 0.06) / 0.03, a, b, c represent the actual independent variable. Then, the equation was transformed to the actual values.
Degradation percentage = 3.00155 + 16.54958 × pH + 753.69973 × Fe + 140.81851 ×
pH × Fe − 3.24243 × pH2 − 5722.90348 × Fe2.
pH × Fe − 3.24243 × pH2 − 5722.90348 × Fe2.
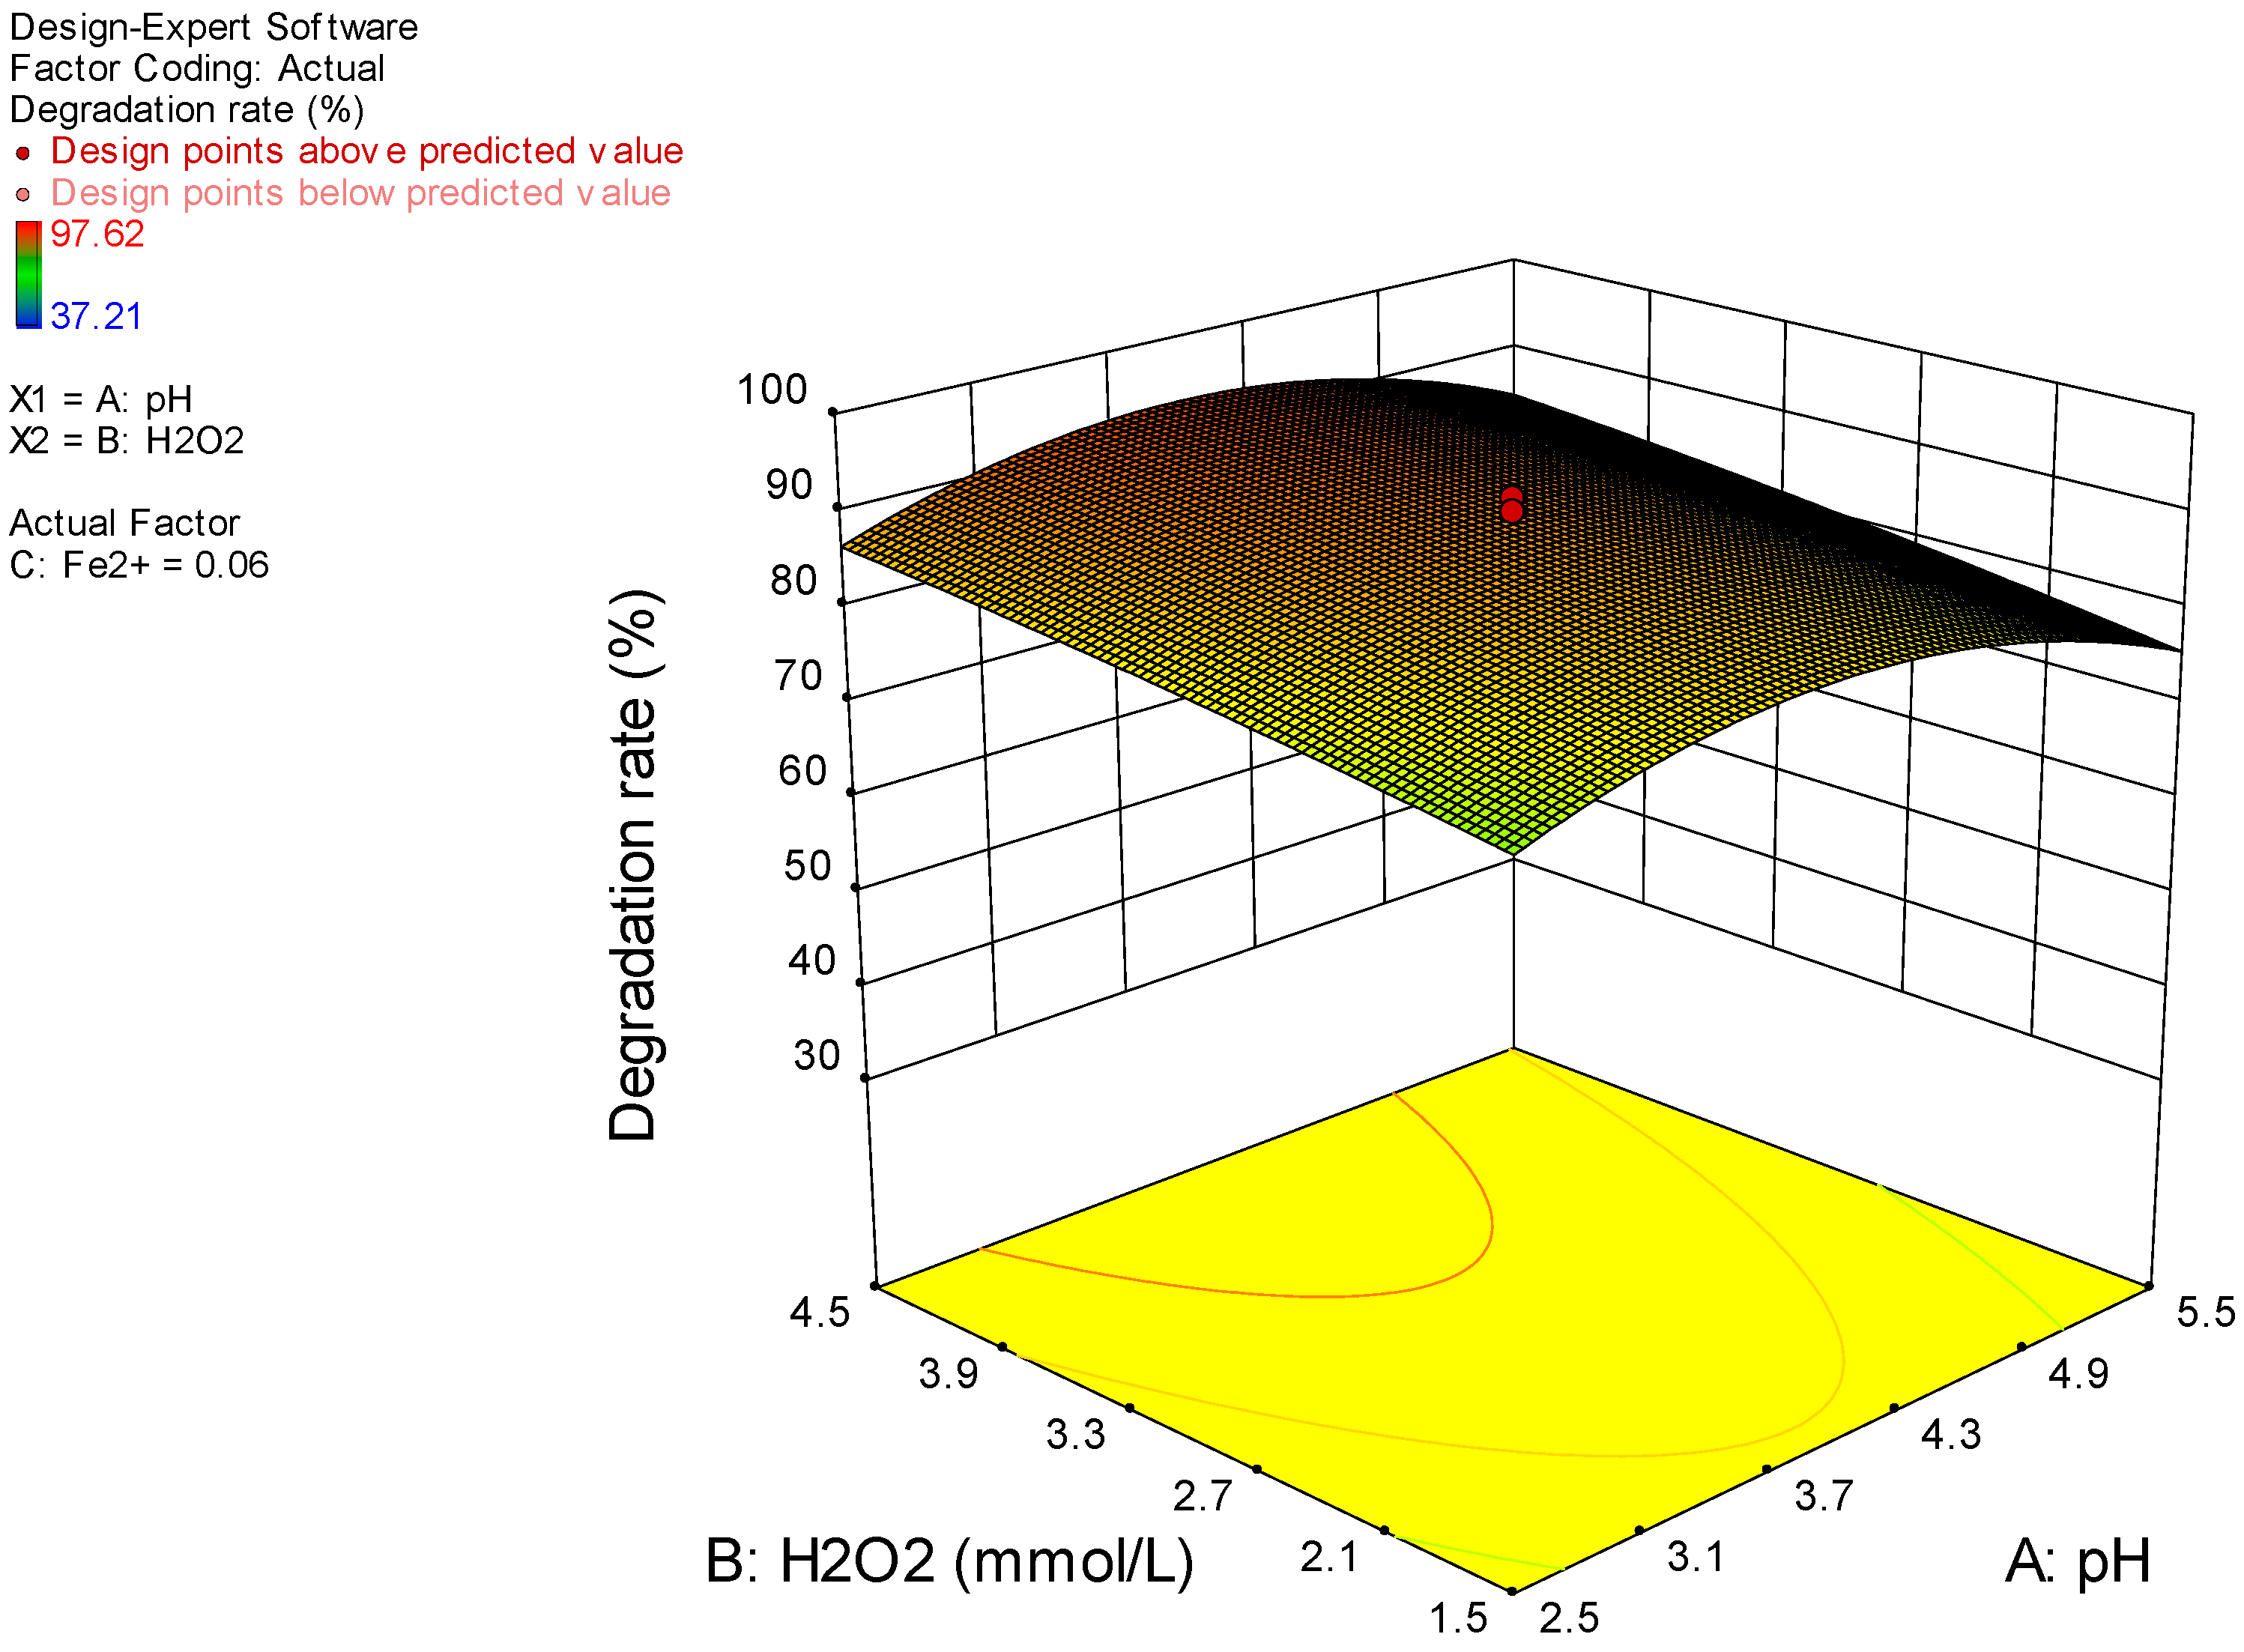
The analytical results of the interaction between pH, H2O2 concentration, and Fe2+ concentration are shown in Figure 8, Figure 9 and Figure 10.
Figure 8 shows that, under the same H2O2 concentrations, the degradation rate increased with the increase in pH and then decreased. At the same value of pH, the degradation rate of trimethoprim increased with the increase in H2O2 concentration. This shows that the degradation under the Fenton reaction requires a suitably acidic pH. If the pH is too high, the oxidation potential of hydroxyl radicals will decrease with the increase of pH, whereas, if the pH is too low, the stability of H2O2 will decrease and this could release a proton and form a stable hydrated proton, which is not conducive to the reaction.
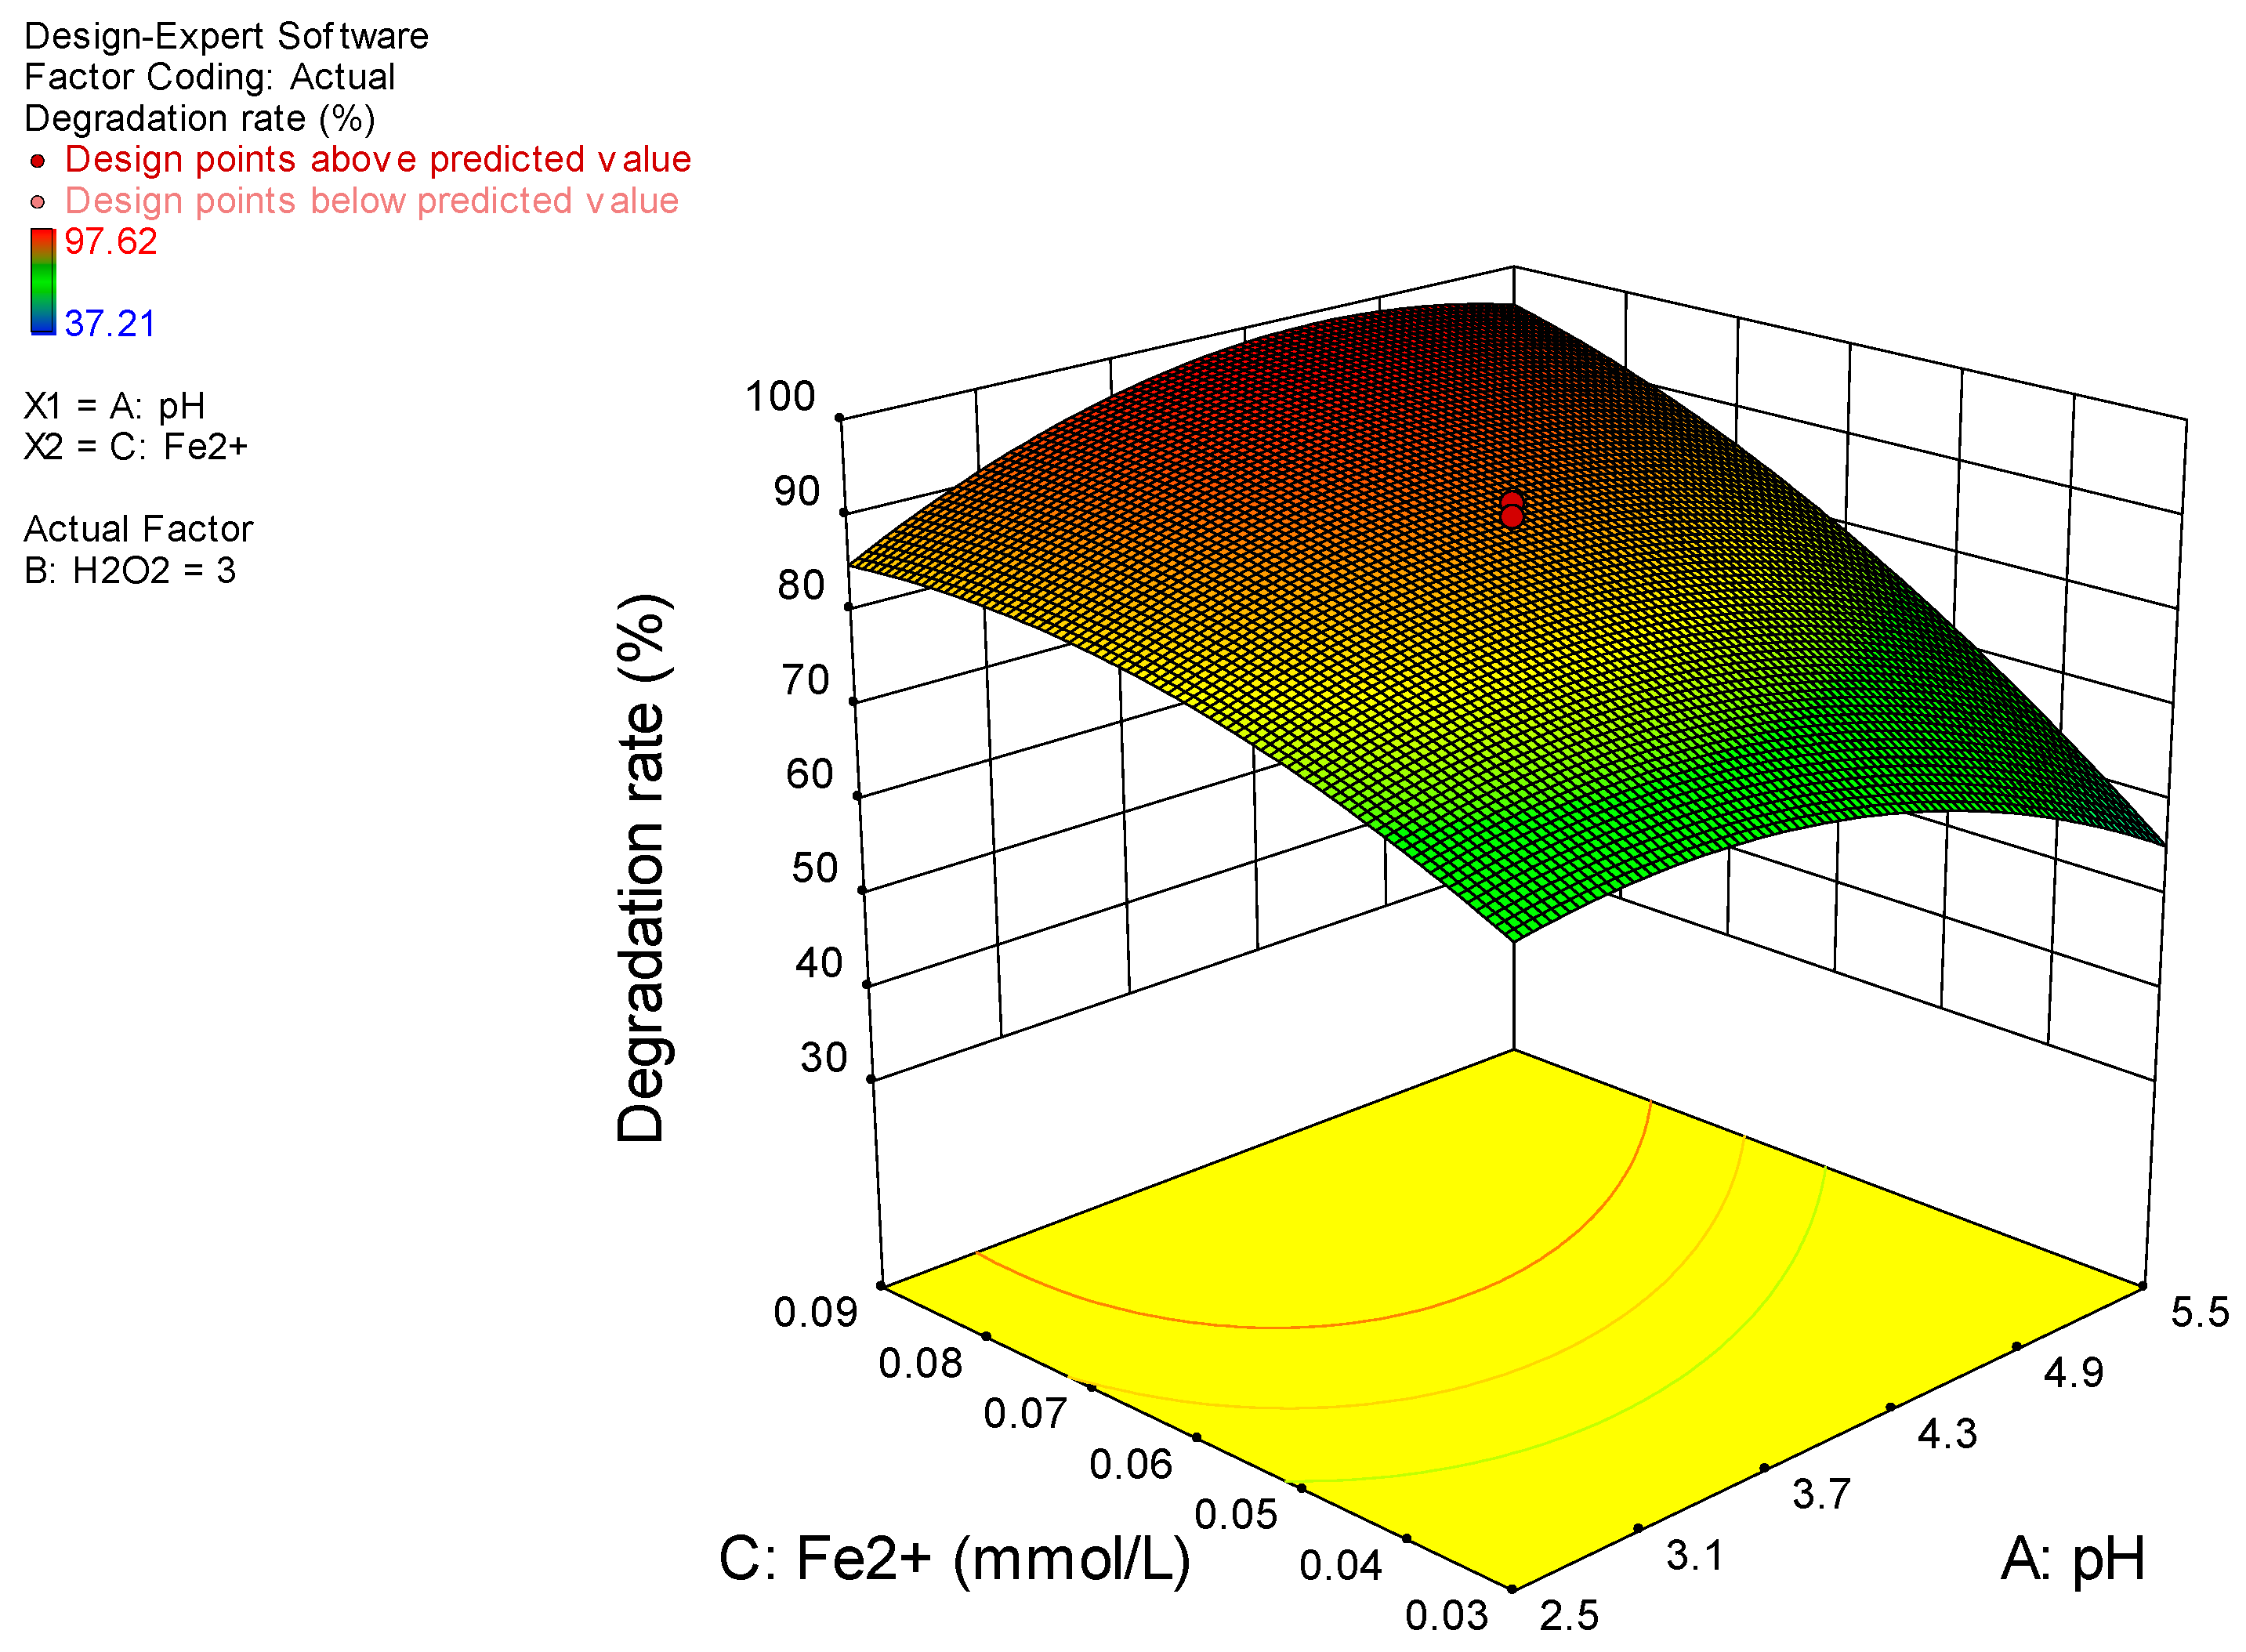
Figure 9 shows that, at the same pH, the degradation rate increased with the increase in Fe2+ concentration, while, under the same Fe2+ concentration, the degradation rate increased with the increase in pH and then decreased. Fe2+ plays the role of catalyst in the Fenton reaction; the greater the concentration of Fe2+ is, the more hydroxyl radicals can be generated, which improves the degradation efficiency. When the pH increases, Fe2+ will form ferric hydroxide precipitation quickly, which leads to a decrease in Fe2+ concentration. The reaction of Fe2+ and hydrogen peroxide to form hydroxyl radicals will slow down and influence the Fenton reaction.
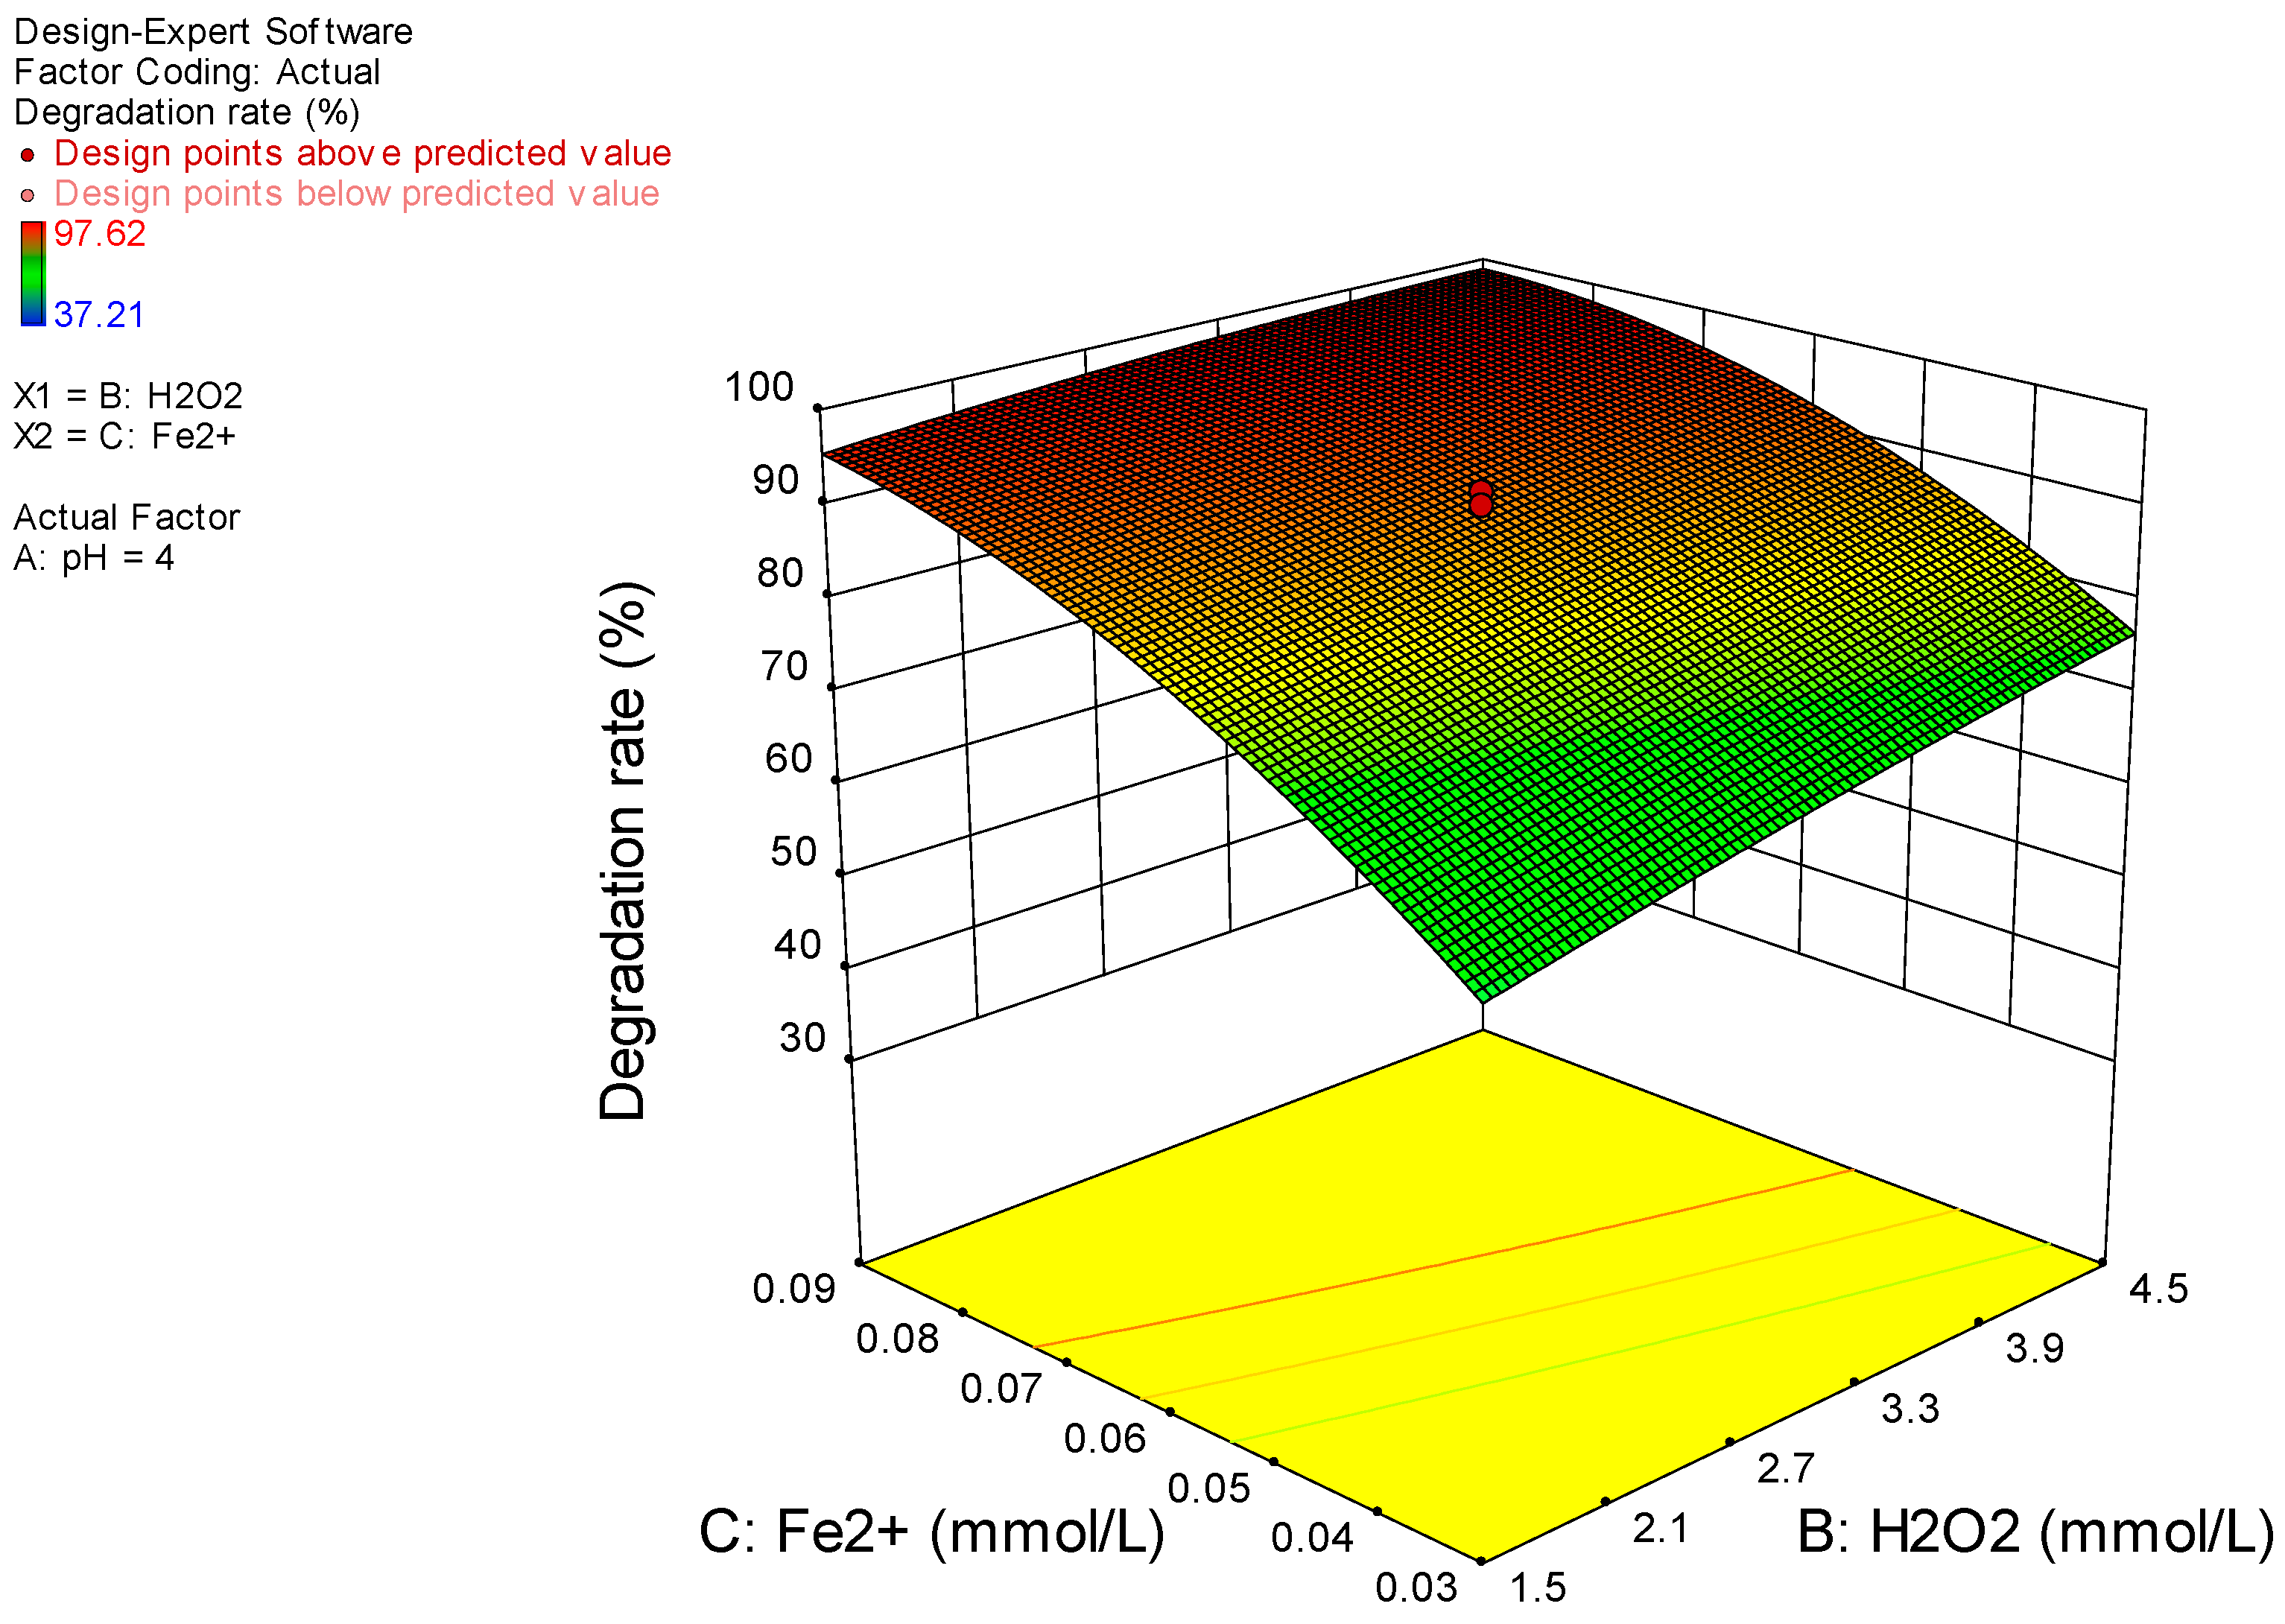
It is clear from Figure 10 that, under the same Fe2+ concentration, the degradation rate increased with the increase in H2O2 concentration, while, under the same H2O2 concentration, the degradation rate increased with the increase in Fe2+ concentration. Hydrogen peroxide produces hydroxyl radicals in the Fenton reaction and participates in the degradation reaction; thus, the more hydroxyl free radicals there are, the quicker the reaction will be.
The optimal degradation conditions optimized by Design Expert 8.0.5b were as follows: pH = 4.56, H2O2 concentration = 0.09 mmol/L, and Fe2+ concentration = 0.09 mmol/L. Under these conditions, the optimal degradation rate was 99.95%. Three sets of tests were carried out under the optimal degradation conditions after determining the optimal degradation conditions of the software. The results were close to the design value, which shows that the optimal conditions can be realized.
4. Conclusions
The experimental analysis showed that the photo-Fenton reagent can effectively degrade trimethoprim in wastewater. The blank experiment proved that the addition of UV irradiation has a synergistic effect on the Fenton system. This study shows that response surface methodology is a factual and error-free approach for the optimization of media composition to obtain the best performance for the degradation of trimethoprim. Taking into account the possible interactions of pH, Fe2+ concentration, and H2O2 concentration, Design Expert 8.0.5b was used to optimize the optimal degradation conditions as follows: pH = 4.56, H2O2 concentration = 0.09 mmol/L, and Fe2+ concentration = 0.09 mmol/L. Under these conditions, the optimal degradation rate was 99.95%. Then, three sets of tests were carried out under the optimal degradation conditions. The results were close to the design value, which indicates that the optimal conditions can be realized.
Author Contributions
Conceptualization, M.Z., C.D., and Q.W.; methodology, C.D., Q.W., Q.K., and H.Y.; software, P.Z. and Q.S.; investigation, P.Z., Q.S., W.P., C.D., Q.W., Q.K., and H.Y.; data curation, Y.M., Q.S., and W.P.; writing—original draft preparation, P.Z., Y.M., W.P., C.D., and Q.W.; writing—review and editing, W.P., Q.W., Q.K., and H.Y.; supervision, M.Z.; funding acquisition, Q.W. and M.Z.
Funding
This research was supported by the Zhejiang Provincial Natural Science Foundation of China under Grant Nos.LY16B070008 and LQ18C030002, and by the National Natural Science Foundation of China (Nos. 31570364 and 61871293).
Acknowledgments
We thank LetPub (www.letpub.com) for its linguistic assistance during the preparation of this manuscript.
Conflicts of Interest
The authors declare no conflicts of interest.
References
- Rudd, M.; Ankley, G.T.; Boxall, A.B.A.; Brooks, B.W. International scientists’ priorities for research on pharmaceutical and personal care products in the environment. Integr. Environ. Asses. 2014, 4, 576–587. [Google Scholar] [CrossRef] [PubMed]
- Bu, Q.W.; Wang, B.; Huang, J.; Deng, S.B.; Yu, G. Pharmaceuticals and personal care products in the aquatic environment in China: A review. J. Hazard. Mater. 2013, 262, 189–211. [Google Scholar] [CrossRef]
- Aasim, M.M.A.; Roland, K.; Leiv, K.S.; Helene, T.R.; Walied, M.A.; Sultan, A.L. Photolysis of pharmaceuticals and personal care products in the marine environment under simulated sunlight conditions: irradiation and identification. Environ. Sci. Pollut. Res. 2017, 24, 14657–14668. [Google Scholar]
- Yin, L.N.; Wang, B.; Yuan, H.L.; Den, S.B.; Huang, J.; Wan, Y.J.; Yu, G. Pay special attention to the transformation products of PPCPs in environment. Emerg. Contam. 2017, 3, 69–75. [Google Scholar] [CrossRef]
- Mottaleb, M.A.; Meziani, M.J.; Matin, M.A.; Arafat, M.M.; Wahab, M.A. Emerging Micro-Pollutants Pharmaceuticals and Personal Care Products (PPCPs) Contamination Concerns in Aquatic Organisms—LC/MS and GC/MS Analysis. In Emerging Micro-Pollutants in the Environment: Occurrence, Fate, and Distribution; Kurwadkar, S., Zhang, X., Ramirez, D., Mitchell, F.L., Eds.; ACS Symposium Series; American Chemical Society: Washington, DC, USA, 2015; pp. 43–74. [Google Scholar] [CrossRef]
- Raya, S.A.; Mushtaque, A.; Ahmed, A.; Choudri, B.S. Translocation of pharmaceuticals and personal care products (PPCPs) into plant tissues: A review. Emerg. Contam. 2017, 3, 132–137. [Google Scholar]
- Prince, N.; Hyeok, C. Sulfate Radicals Destroy Pharmaceuticals and Personal Care Products. Environ. Eng. Sci. 2011, 28, 605–609. [Google Scholar]
- German, S.M.; Gabriela, R.M.; Dora, S.C.; Rubi, R.; Reyna, N. Advanced Oxidation Processes: Ozonationand Fenton Processes Applied to the Removal of Pharmaceuticals. In Ecopharmacovigilance: Multidisciplinary Approaches to Environmental Safety of Medicines; Gómez-Oliván, L., Ed.; The Handbook of Environmental Chemistry; Springer International Publishing: New York, NY, USA, 2019; Volume 66, pp. 119–142. [Google Scholar]
- Su, J.C.; Wang, Y.L.; Su, J.J. Photocatalytic oxidation of dairy efuent with UV lamp or UV light-emitting diode module and biological treatment processes. Int. J. Environ. Sci. Technol. 2018. [Google Scholar] [CrossRef]
- Mohammad, M.; Nematollah, J.; Abbas, D. Efficiency investigation of photo-Fenton process in removal of sodium dodecyl sulphate from aqueous solutions. Desalin. Water Treat. 2016, 57, 24444–24449. [Google Scholar]
- Domingues, E.; Gomes, J.; Quina, M.J.; Quinta-Ferreira, R.M.; Martins, R.C. Detoxification of Olive Mill Wastewaters by Fenton’s Process. Catalysts 2018, 8, 662. [Google Scholar] [CrossRef]
- Wang, S.Z.; Wang, J.L. Trimethoprim degradation by Fenton and Fe(II)-activated persulfate processes. Chemosphere 2018, 191, 97–105. [Google Scholar] [CrossRef]
- Martínez-Costa, J.I.; Rivera-Utrilla, J.; Leyva-Ramos, R.; Sánchez-Polo, M.; Velo-Gala, I.; Mota, A.J. Individual and simultaneous degradation of the antibiotics sulfamethoxazole and trimethoprim in aqueous solutions by Fenton, Fenton-like and photo-Fenton processes using solar and UV radiations. J. Photochem. Photobiol. A 2018, 360, 95–108. [Google Scholar] [CrossRef]
- Liu, Q.Q.; Li, M.; Liu, X.; Zhang, Q.; Liu, R.; Wang, Z.L.; Shi, X.T.; Quan, J.; Shen, X.H.; Zhang, F.W. Removal of sulfamethoxazole and trimethoprim from reclaimed water and the biodegradation mechanism. Front. Environ. Sci. Eng. 2018, 12. [Google Scholar] [CrossRef]
- Alharbi, S.K.; Price, W.E.; Kang, J.; Fujioka, T.; Nghiem, L.D. Ozonation of carbamazepine, diclofenac, sulfamethoxazole and trimethoprim and formation of major oxidation products. Desalin. Water Treat. 2016, 57, 29340–29351. [Google Scholar] [CrossRef]
- Brown, K.D.; Kulis, J.; Thomson, B.; Chapman, T.H.; Mawhinney, D.B. Occurrence of antibiotics in hospital, residential, and dairy effluent, municipal wastewater, and the Rio Grande in New Mexico. Sci. Total Environ. 2006, 366, 772–783. [Google Scholar] [CrossRef] [PubMed]
- Hirsch, R.; Ternes, T.; Haberer, K.; Kratz, K.L. Occurrence of antibiotics in the aquatic environment. Sci. Total Environ. 1999, 225, 109–118. [Google Scholar] [CrossRef]
- Yilmaz, G.; Kaya, Y.; Vergili, I.; Gönder, Z.B.; Özhan, G.; Celik, B.O.; Altinkum, S.M.; Bagdatli, Y.; Boergers, A.; Tuerk, J. Characterization and toxicity of hospital wastewaters in Turkey. Environ. Monit. Assess. 2017, 189. [Google Scholar] [CrossRef] [PubMed]
- Celic, M.; Gros, M.; Farre, M.; Barcelo, D.; Petrovic, M. Pharmaceuticals as chemical markers of wastewater contamination in the vulnerable area of the Ebro Delta (Spain). Sci. Total Environ. 2019, 652, 952–963. [Google Scholar] [CrossRef] [PubMed]
- Moreira, F.C.; Garcia-Segura, S.; Boaventura, R.A.R.; Brillas, E.; Vilar, V.J.P. Degradation of the antibiotic trimethoprim by electrochemical advanced oxidation processes using a carbon-PTFE air-diffusion cathode and a boron-doped diamond or platinum anode. Appl. Catal. B 2014, 160–161, 492–505. [Google Scholar] [CrossRef]
- Garcia-Segura, S.; Mostafa, E.; Baltruschat, H. Could NOx be released during mineralization of pollutants containing nitrogen by hydroxyl radical? Ascertaining the release of N-volatile species. Appl. Catal. B 2017, 207, 376–384. [Google Scholar] [CrossRef]
- Archana, G.; Dhodapkar, R.; Kumar, A. Offline solid-phase extraction for preconcentration of pharmaceuticals and personal care products in environmental water and their simultaneous determination using the reversed phase high-performance liquid chromatography method. Environ. Monit. Assess. 2016, 188, 512. [Google Scholar] [CrossRef]
- Funai, D.H.; Didier, F.; Giménez, J.; Esplugas, S.; Marco, P.; Machulek, A. Photo-Fenton treatment of valproate under UVC, UVA and simulated solar radiation. J. Hazard. Mater. 2017, 323, 537–549. [Google Scholar] [CrossRef] [PubMed]
- Michael, S.G.; Michael-Kordatou, I.; Beretsou, V.G.; Jäger, T.; Michael, C.; Schwartz, T.; Fatta-Kassinos, D. Solar photo-Fenton oxidation followed by adsorption on activated carbon for the minimisation of antibiotic resistance determinants and toxicity present in urban wastewater. Appl. Catal. B 2019, 244, 871–880. [Google Scholar] [CrossRef]
- Babuponnusami, A.; Muthukumar, K. A review on Fenton and improvements to the Fenton process for wastewater treatment. J. Environ. Chem. Eng. 2014, 2, 557–572. [Google Scholar] [CrossRef]
- Garcia-Segura, S.; Anotai, J.; Singhadech, S.; Lu, M.C. Enhancement of biodegradability of o -toluidine effluents by electro-assisted photo-Fenton treatment. Process Saf. Environ. Prot. 2017, 106, 60–67. [Google Scholar] [CrossRef]
- Malik, P.K.; Saha, S.K. Oxidation of Direct Dyes with Hydrogen Peroxide Using Ferrous Ion as Catalyst. Sep. Purif. Technol. 2003, 31, 241–250. [Google Scholar] [CrossRef]
- Panizza, M.; Cerisola, G. Electro-Fenton Degradation of Synthetic Dyes. Water Res. 2009, 43, 339–344. [Google Scholar] [CrossRef]
- Maezono, T.; Tokumura, M.; Sekine, M.; Kawase, Y. Hydroxyl Radical Concentration Profile in photo-Fenton Oxidation Process Generation and Consumption of Hydroxyl Radicals during the Discoloration of Azo-Dye Orange Ii. Chemosphere 2011, 82, 1422–1430. [Google Scholar] [CrossRef]
- Inmaculada, V.G.; Jesús, J.L.P.; Manuel, S.P.; José, R.U. Comparative study of oxidative degradation of sodium diatrizoate in aqueous solution by H2O2/Fe2+, H2O2/Fe3+, Fe (VI) and UV, H2O2/UV, K2S2O8/UV. Chem. Eng. J. 2014, 241, 504–512. [Google Scholar]
- Boonrattanakij, N.; Sakul, W.; Garcia-Segura, S.; Lu, M.C. Implementation of fluidized-bed Fenton as pre-treatment to reduce chemical oxygen demand of wastewater from screw manufacture: Influence of reagents feeding mode. Sep. Purif. Technol. 2018, 202, 275–280. [Google Scholar] [CrossRef]
- Ghafari, S.; Aziz, H.A.; Isa, M.H.; Zinatizadeh, A.A. Application of response surface methodology (RSM) to optimize coagulation–flocculation treatment of leachate using poly-aluminum chloride (PAC) and alum. J. Hazard. Mater. 2009, 163, 650–656. [Google Scholar] [CrossRef]
Figure 1.
Trimethoprim chemical structure.

Figure 2.
The degradation of trimethoprim under different conditions.

Figure 3.
The influence of pH (2.5–4.5) on the degradation of trimethoprim.

Figure 4.
The influence of H2O2 concentration (0–5 mmol/L) on trimethoprim degradation.

Figure 5.
The influence of Fe2+ concentration (0–0.08 mmol/L) on trimethoprim degradation.

Figure 6.
The influence of different initial trimethoprim concentrations (0.0344–0.1033 mmol/L) on trimethoprim degradation.
Figure 6.
The influence of different initial trimethoprim concentrations (0.0344–0.1033 mmol/L) on trimethoprim degradation.

Figure 7.
The influence of different ultraviolet (UV) light intensities (5–26 mW/cm2) on trimethoprim degradation.
Figure 7.
The influence of different ultraviolet (UV) light intensities (5–26 mW/cm2) on trimethoprim degradation.

Figure 8.
The influence of pH and H2O2 concentration on trimethoprim degradation.

Figure 9.
The influence of pH and Fe2+ concentration on trimethoprim degradation.

Figure 10.
The influence of Fe2+ and H2O2 concentration on trimethoprim degradation.


Table 1.
Details of the central composite design optimization by Design Expert 8.0.5b software.
| Factor | Unit | −1 1 | 0 | 1 | Alpha (−) | Alpha (+) |
|---|---|---|---|---|---|---|
| pH | 2.5 | 4 | 5.5 | 1.47731 | 6.52269 | |
| H2O2 concentration | mmol/L | 1.5 | 3 | 4.5 | 0.477311 | 5.52269 |
| Fe2+ concentration | mmol/L | 0.03 | 0.06 | 0.09 | 0.009542 | 0.110454 |
Notes: 1 −1, 0, 1, Alpha (−), and Alpha (+) are the levels of the factor.
Table 2.
Central composite design experimental groups.
| Design Sequence | Operation Sequence | pH | H2O2 Concentration (mmol/L) | Fe2+ Concentration (mmol/L) | Degradation Rate (%) |
|---|---|---|---|---|---|
| 18 | 1 | 4.00 | 3.0 | 0.06 | 87.98 |
| 17 | 2 | 4.00 | 3.0 | 0.06 | 89.97 |
| 10 | 3 | 6.52 | 3.0 | 0.06 | 75.23 |
| 14 | 4 | 4.00 | 3.0 | 0.11 | 92.96 |
| 12 | 5 | 4.00 | 5.5 | 0.06 | 97.62 |
| 16 | 6 | 4.00 | 3.0 | 0.06 | 89.21 |
| 19 | 7 | 4.00 | 3.0 | 0.06 | 88.75 |
| 6 | 8 | 5.50 | 1.5 | 0.09 | 92.03 |
| 3 | 9 | 2.50 | 4.5 | 0.03 | 70.74 |
| 11 | 10 | 4.00 | 0.5 | 0.06 | 84.27 |
| 2 | 11 | 5.50 | 1.5 | 0.03 | 37.21 |
| 5 | 12 | 2.50 | 1.5 | 0.09 | 83.37 |
| 7 | 13 | 2.50 | 4.5 | 0.09 | 89.79 |
| 13 | 14 | 4.00 | 3.0 | 0.01 | 65.81 |
| 8 | 15 | 5.50 | 4.5 | 0.09 | 95.98 |
| 20 | 16 | 4.00 | 3.0 | 0.06 | 87.38 |
| 9 | 17 | 1.48 | 3.0 | 0.06 | 71.40 |
| 4 | 18 | 5.50 | 4.5 | 0.03 | 54.74 |
| 1 | 19 | 2.50 | 1.5 | 0.03 | 57.06 |
| 15 | 20 | 4.00 | 3.0 | 0.06 | 91.33 |
Table 3.
ANOVA results for the trimethoprim degradation model; df—degrees of freedom.
| Source | Sum of Squares | df | Mean Square | F-Value | p-Value Prob > F |
|---|---|---|---|---|---|
| Model | 4306.57 | 9 | 478.51 | 8.20 | 0.0014 significant |
| Residual | 583.46 | 1 | 58.35 | ||
| Pure Error | 10.06 | 5 | 2.01 | ||
| Corrected Total | 4890.04 | 19 | |||
| Standard Deviation | 7.64 | R2 | 0.8807 | ||
| Mean | 80.14 | Adjusted R2 | 0.7733 | ||
| Adequate Precision | 9.358 |
© 2019 by the authors. Licensee MDPI, Basel, Switzerland. This article is an open access article distributed under the terms and conditions of the Creative Commons Attribution (CC BY) license (http://creativecommons.org/licenses/by/4.0/).
Share and Cite
MDPI and ACS Style
Wang, Q.; Pang, W.; Mao, Y.; Sun, Q.; Zhang, P.; Ke, Q.; Yu, H.; Dai, C.; Zhao, M. Study of the Degradation of Trimethoprim Using Photo-Fenton Oxidation Technology. Water 2019, 11, 207. https://doi.org/10.3390/w11020207
AMA Style
Wang Q, Pang W, Mao Y, Sun Q, Zhang P, Ke Q, Yu H, Dai C, Zhao M. Study of the Degradation of Trimethoprim Using Photo-Fenton Oxidation Technology. Water. 2019; 11(2):207. https://doi.org/10.3390/w11020207
Chicago/Turabian StyleWang, Qi, Wenjing Pang, Yingdan Mao, Quan Sun, Pengfei Zhang, Qiang Ke, Hengguo Yu, Chuanjun Dai, and Min Zhao. 2019. "Study of the Degradation of Trimethoprim Using Photo-Fenton Oxidation Technology" Water 11, no. 2: 207. https://doi.org/10.3390/w11020207
Note that from the first issue of 2016, this journal uses article numbers instead of page numbers. See further details here.