The Water Footprint of Wood for Energy Consumed in the European Union


1
Twente Water Centre, University of Twente, P.O. Box 217, 7500 AE Enschede, The Netherlands
2
European Commission, Joint Research Centre (JRC), 21027 Ispra, Italy
*
Author to whom correspondence should be addressed.
Water 2019, 11(2), 206; https://doi.org/10.3390/w11020206
Submission received: 15 November 2018
/
Revised: 26 December 2018
/
Accepted: 10 January 2019
/
Published: 25 January 2019
(This article belongs to the Special Issue Energy and Water Nexus)
Abstract
:The European Union (EU) aims at increasing the share of renewable energy use, of which nearly half originates from wood sources currently. An energy supply from wood sources strongly relies on green water resources, which are limited and also essential for food security and terrestrial biodiversity. We have estimated the water footprint (WF) of wood for energy consumed in the EU-28 (WFwec) by combining data on energy produced from wood sources in the EU per member state for the year 2015 from the EU energy reference scenario 2016, extra-EU trade in fuelwood and charcoal, and country-specific estimates of the water footprint per unit of wood. We find that the WFwec is large (156 × 109 m3/y), 94% of this footprint is situated within the EU, and it is almost exclusively related to green water (99%). Adding WFwec to the WF related to the EU’s consumption of agricultural and industrial products as well as domestic water use (702 × 109 m3/y) signifies an increase of 22% to 858 × 109 m3/y. We show that over half of the internal WFwec is in member states that have a high degree of green water scarcity and hence very limited potential left to sustainably allocate more green water flows to biomass production. The results of this study feed into the debate on how the EU can achieve a sustainable and reliable energy supply. Policies on energy security should consider that increased use of wood or other biomass for energy increases the already significant pressure on limited green water resources.
1. Introduction
To ensure energy security, the discussion around wood for energy takes center stage. The main goals of the European Union (EU) energy policies are to reduce fuel import dependency, energy consumption, and carbon emissions and to decouple energy costs from oil prices. In a strive for a low-carbon economy and improved energy security, the EU aims at increasing the share of renewable energy in final energy consumption from 17% in 2016 to 20% by 2020 [1]. The 2030 climate and energy framework includes the key target to achieve a share for renewable energy of at least 27% [2]. Although these targets on renewables do not identify specific targets on biomass, a growth in biomass use for energy is foreseen. The 2050 long-term strategy, presented by the European Commission on 28 November 2018, calls for a climate-neutral Europe by 2050 [3]. In the related in-depth analysis, it is concluded that all scenarios rely on a substantial use of biomass for energy, which grows from 140 Mtoe in 2016 to about 190–250 Mtoe in 2050, through a slight increase in the use of wood for energy, while assuming much of the biomass demand for energy can be met through improved waste collection and fast growing energy crops [4].
Although wind and solar energy have been growing fast, energy from wood still accounts for almost half (45% in 2016) of the EU’s gross inland energy consumption of renewables [5]. The sustainability of wood used for energy has been the subject of much research. Wood harvests have been linked to carbon emissions [6] and forest loss [7], cascading to biodiversity loss [8]. Moreover, there is an ongoing debate on how European energy policies and forest management might affect carbon stocks and fluxes [9,10,11], hence influencing progress towards meeting the objectives of the Paris Agreement [12].
Both blue and green water resources are essential in meeting the Sustainable Development Goals of water, food, and energy security [13]. Food security is known to require high amounts of water resources [14,15], but producing wood for energy security also requires significant volumes of water. Recently, Schyns, et al. [16] made a first-time estimate of the water footprint (WF) of global wood production, which increases the WF of humanity computed by Hoekstra and Mekonnen [17] by 12%. The largest share of the WF of wood is green water—rainfall that infiltrates the soil or is intercepted by vegetation and eventually flows back to the atmosphere as evapotranspiration—and only a small share is blue water—groundwater uptake by the trees’ roots [16]. In a global assessment of the WF of electricity and heat, Mekonnen, et al. [18] have estimated that firewood has the largest WF per unit of energy compared to other energy sources. They also show that the European energy-related WF is dominated by hydropower and firewood.
An energy supply that requires water is also prone to water-related risks. Water is a limiting factor to forest productivity [19], and droughts have induced tree mortality [20], reductions in terrestrial net primary production [21], and forest fires. Turco, et al. [22] show that there is a statistically significant relationship between forest fire and same-summer droughts in most of Mediterranean Europe. In recent years, Europe has experienced large forest fires [23], and these are expected to occur more often in the coming decades [24]. Moreover, the level of water scarcity [25] increases when the energy mix becomes more water-demanding: not only blue but also green water scarcity [26]. Green water scarcity refers to the competition over limited green water flows, which can either support a natural ecosystem or the production of biomass for various purposes in the human economy [27]. The level of green water scarcity is significant in Europe, where nearly all sustainably available green water flows have already been allocated for human use [27,28].
The objective of this paper is to quantify the WF of wood for energy consumed in the EU-28 and place this in the context of limited green water availability.
European forests have been the subject of much research. Several authors have addressed the trade-offs between forest protection and wood supply [29,30,31,32,33] and between forest management and carbon stocks and fluxes [9,11,12]. Others have mapped European wood production [34] and estimated wood biomass potentials for energy [35,36]. The EU’s consumption of sawnwood has been studied by Hurmekoski, et al. [37]. Later, O’Brien and Bringezu [38] studied the EU’s consumption of all timber products and estimated the associated land footprint.
Several studies have addressed the WF of wood products [16,39,40,41], and a few studies estimated the WF of wood for energy. The WF of energy from poplar [42], eucalyptus, and pine [43] has been found to be large compared to first- and second-generation bioenergy from crops. The WF of ethanol from wood has been estimated by Chiu and Wu [44] and by Schyns, et al. [16], who found that wood compares to biofuel crops in terms of energy yield from bio-ethanol per m3 of water.
As part of their global assessment, Mekonnen, et al. [18] estimated Europe’s WF related to energy from wood by combining regional data on electricity and heat production per energy source with estimates of the WF of firewood (in m3/TJ) per country. They estimated the latter based on global estimates of forest evapotranspiration, wood yields for the 22 countries included in Van Oel and Hoekstra [39], the proportion between domestic production of wood and imported wood chips, and a single value to convert wood volumes to energy units. While focusing on the EU, we improve upon their estimate by using better data that recently became available. We combine data on energy produced from wood sources in the EU per member state for the year 2015 [45], extra-EU trade in fuelwood and charcoal [46], and country-specific estimates of the WF per unit of wood [16]. We subsequently put the green WF of wood for energy consumed in the EU in the context of green water scarcity, which to our knowledge has never been done before.
2. Materials and Methods
The WF of wood for energy consumed in the EU-28 (WFwec, in m3 per year) consists of an internal part (WFwec,int)—related to the wood produced for energy purposes in the EU minus the export of energy wood products to countries outside the EU—and an external part (WFwec,ext)—related to the import of energy wood products from countries outside the EU. WFwec has been estimated according to the following equation:
where P[m] is the wood produced for energy purposes in member state m in m3 solid wood equivalent (SWE), E[m] is the extra-EU export of energy wood products from member state m in m3 SWE, WFswe[m] is the WF of wood production in member state m in m3 water per m3 SWE, I[n] is the import of energy wood products from extra-EU country n in m3 of primary raw timber equivalents, and WFrt [n] is the WF of wood production in country n in m3 water per m3 of raw timber.
WFwec = WFwec,int + WFwec,ext = ∑ ((P[m] – E[m]) * WFswe[m] ) + ∑ (I[n] * WFrt [n])
Data on wood produced for energy purposes in the EU member states in the year 2015 has been obtained from the EU energy reference scenario [45]. Trade in fuelwood and charcoal in 2015 has been taken from EUROSTAT [46]. The WF per unit of wood per member state has been derived from Schyns, et al. [16] for the most recent ten-year period available (2001–2010). Schyns, et al. [16] have estimated forest evapotranspiration at 30 × 30 arc minute and attributed part of that to wood production and the rest to ecosystem services. We correct their data to include bark, which is an important source of wood for energy. In averaging the data per member state, we assumed that the production of wood for energy has the same spatial distribution as overall wood production due to the lack of more specific data. We needed to convert the data from these sources to the appropriate units for Equation (1) (see Table 1). Additionally, to estimate the WF of wood per unit of energy, we expressed the data on wood production for energy purposes (reported in ktoe) in TJ, and we converted trade data on fuelwood and charcoal (reported in kg) to TJ based on the higher heating value of fuelwood (17,500 kJ/kg from UNECE/FAO [47]) and charcoal (29,600 kJ/kg from Speight [48]).
We place the WF of wood for energy consumed in the EU in the context of green water scarcity per member state, which reflects the sustainable limits to the allocation of green water for the production of biomass [27]. Schyns, et al. [27] have estimated green water scarcity per country—in a complementary way to common blue water scarcity indicators—as the ratio of the national aggregate green WF to the national aggregate maximum sustainable green WF. They estimated green WFs of crop production, livestock grazing, wood production, and urban areas at a 5 × 5 arc minute grid cell spatial resolution. To estimate maximum sustainable green WFs (at the same resolution), they subtracted the green water flow to be reserved for nature from the total available green water flow [49]. Therein, they used a spatially-explicit map of biodiversity conservation areas to effectively achieve the Aichi Biodiversity Target 11 [50], which entails expanding the protected area network to at least 17% of the terrestrial world by 2020.
3. Results
The WF of wood for energy consumed (WFwec) in the EU is 156 × 109 m3/y (99% green; 1% blue). The largest share of this WF is within the EU member states (94%), with over half being situated in Sweden, Finland, Poland, Germany, and Austria (Table 2). These countries also represent the top 5 in terms of energy use from wood (Table 2; [45]). Only a small share (5.9%) of WFwec is related to the import of energy wood products into the EU, which originate mainly from the US, Russia, Canada, and Belarus. According to Vanham and Bidoglio [52] and Vanham [53], the blue plus green WF of consumption of agricultural and industrial products as well as domestic water use, amounts to 702 × 109 m3/y. Adding the WF of wood for energy consumed results in a WF of 858 × 109 m3/y (increase of 22%).
Given that 94% of the WFwec is in the EU and 99% relates to green water, we have focused on identifying green water-related risks to wood production within the EU only. The level of green water scarcity—the ratio of the actual to the maximum sustainable green WF [26]—is approaching or even exceeding 100% in many member states (Table 2), meaning that the potential to sustainably allocate more green water flows to produce biomass is very limited [27]. Over half of WFwec,int (57%) is in member states that have less than 20% of sustainably available green water flows left to potentially allocate for biomass production. Furthermore, 18% of WFwec,int is in member states where the green WF already exceeds the maximum sustainable level (Netherlands, Germany, Denmark, UK, Belgium, Greece, Czech Republic, and Portugal), meaning that sustainably available green water flows in these countries are mostly or fully allocated to human activities, occasionally at the cost of green water flows earmarked for nature [27].
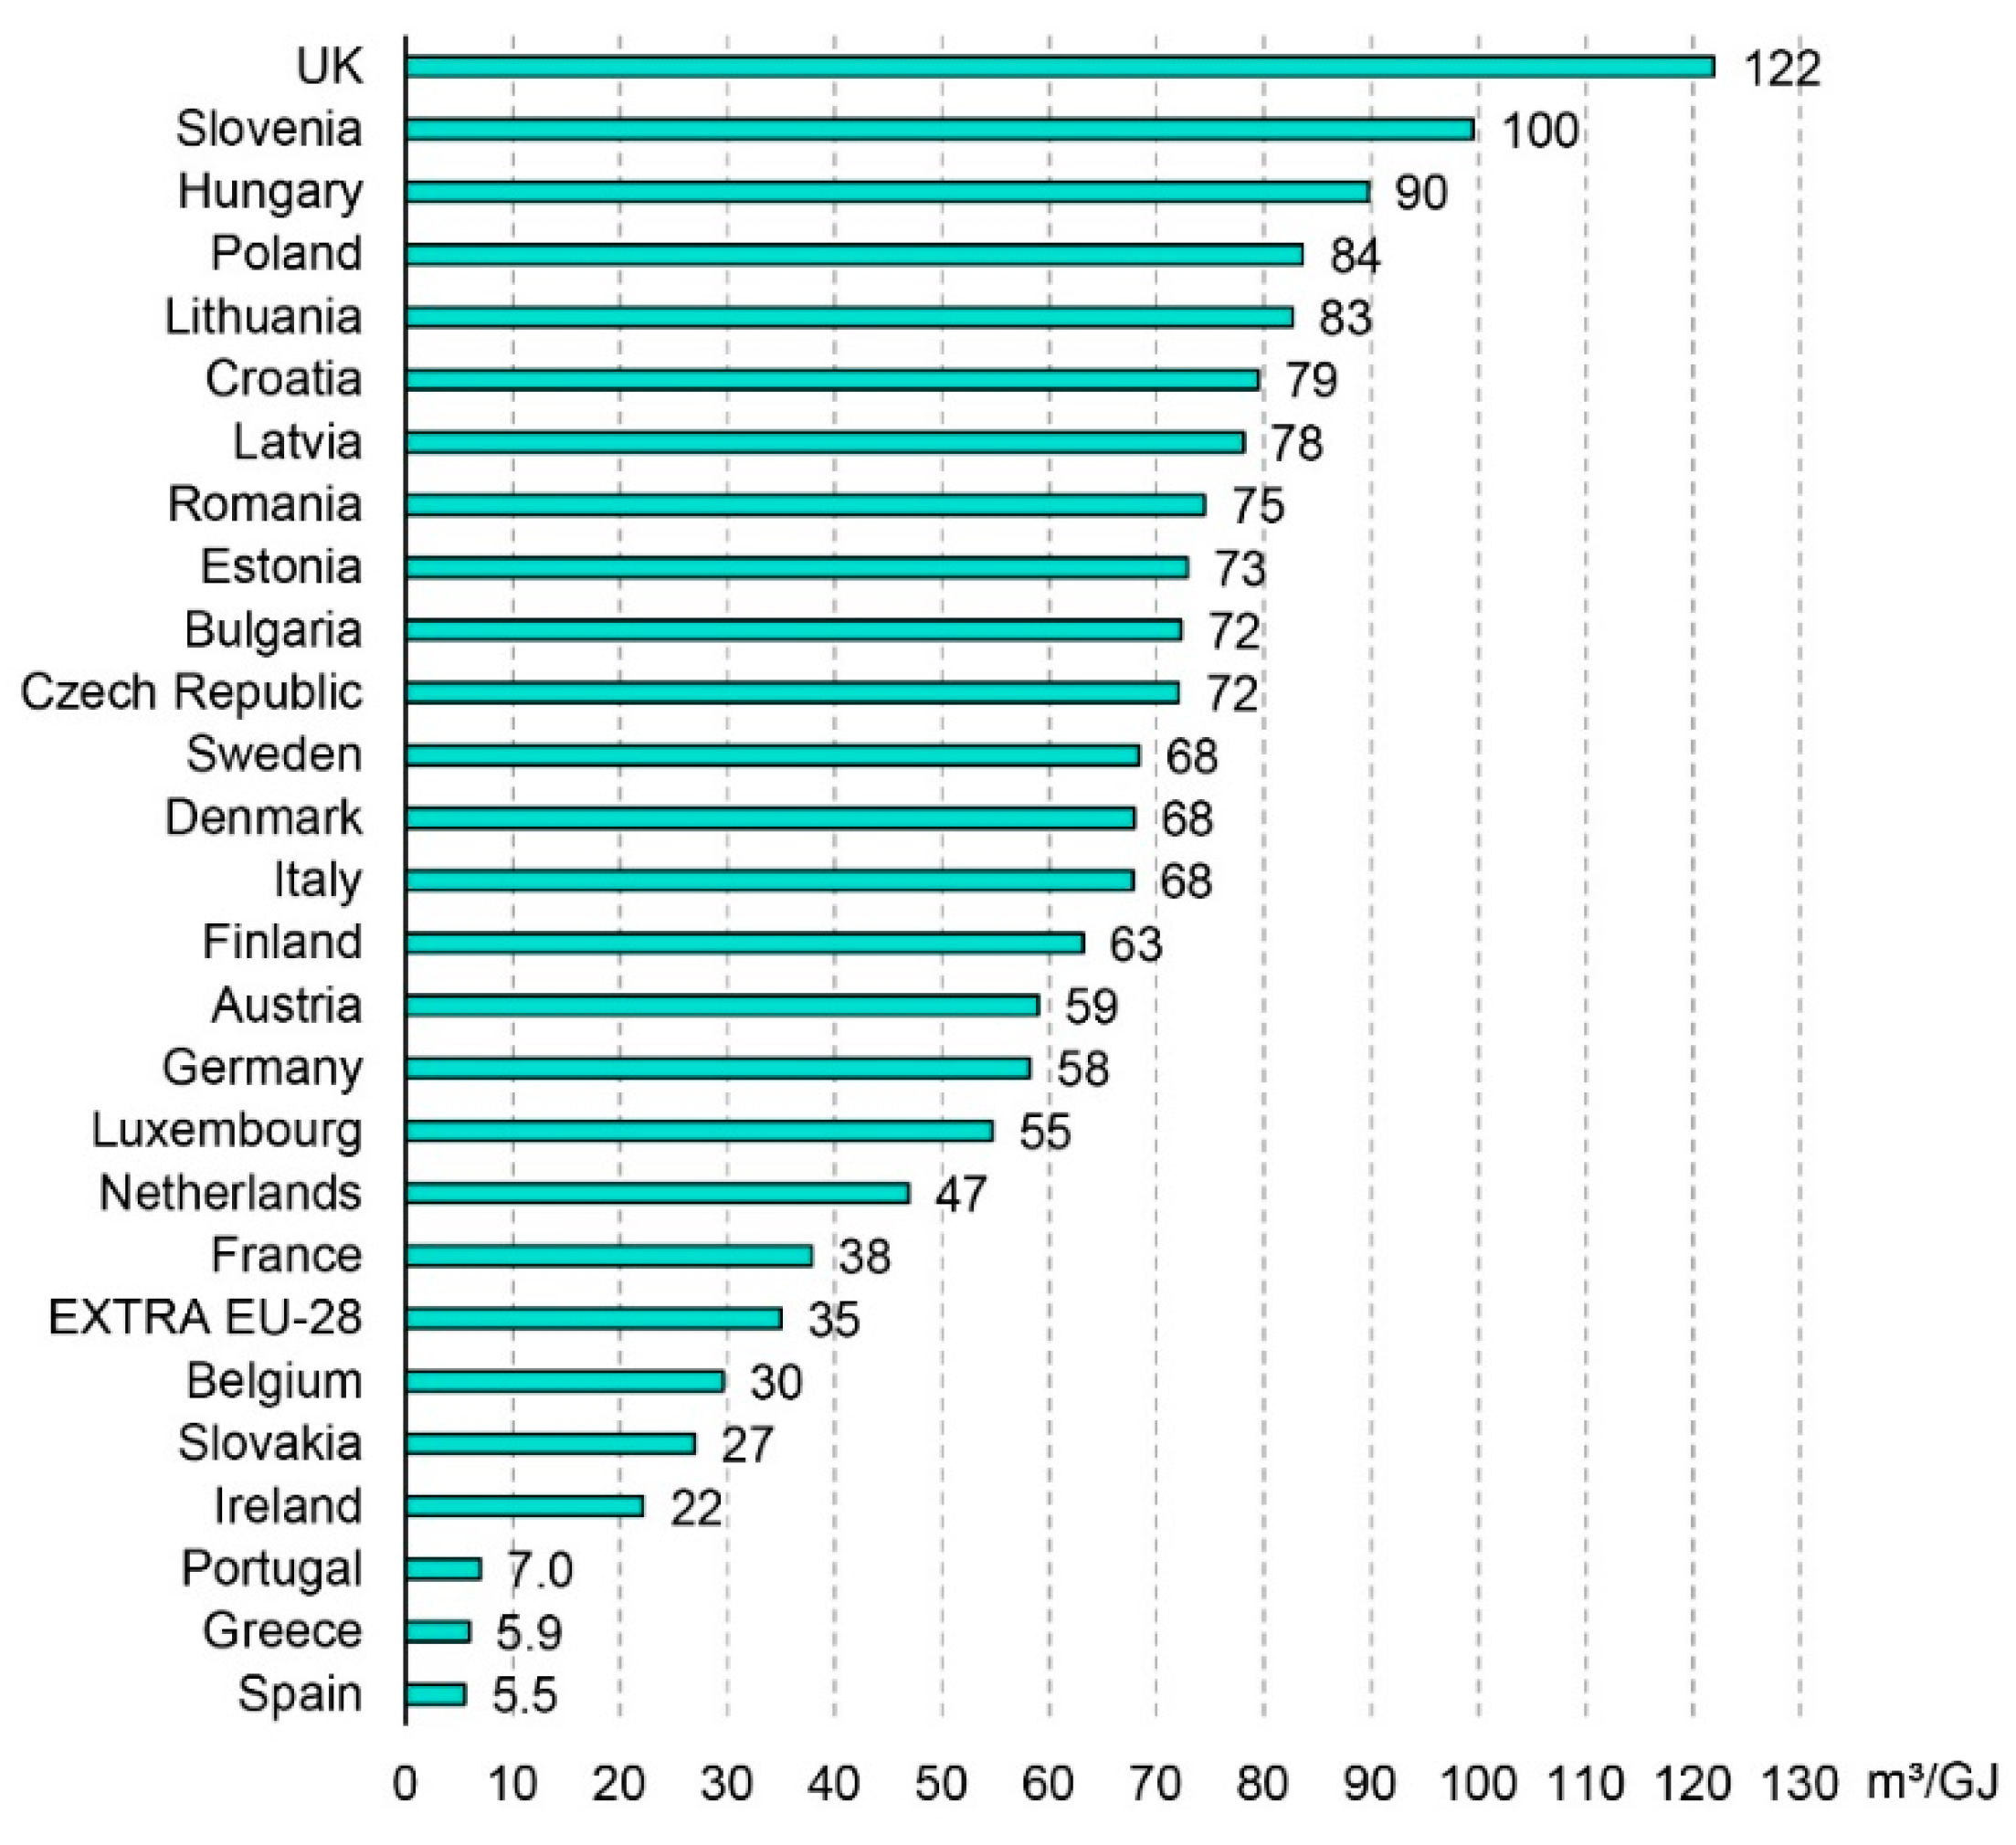
The WF of wood per unit of energy produced varies around an average of 59 m3/GJ (Figure 1). Some countries stand out with a relatively small or large WF per unit of energy. These differences mainly originate from the WF per unit of solid wood equivalent as estimated by Schyns, et al. [16] (see Appendix A, Table A1). They estimated total forest water use and subsequently allocated a fraction of that to wood production and the rest to other forest ecosystem services. This allocation has been done based on a value fraction, which is defined as the value of wood production divided by the total value of forest ecosystem services, and varies with the intensity of forest exploitation (for details see [16]). The value fraction is much smaller in (sub)tropical forest than in temperate/boreal forests because the former generate more ecosystem service value per hectare [54]. This explains the relatively small WFs in Greece, Spain, and Portugal, which host Mediterranean (subtropical) forests. Variation in the WF per unit of wood across the other member states is the result of varying forest water use—depending on actual evapotranspiration rates, which are governed by rainfall and potential evapotranspiration—and wood yields (Table A1). Wood yields have two counteracting effects on the WF per unit of wood. Larger wood yields reduce the total forest water use per unit of wood but increase the fraction of total forest water use allocated to wood production through the increasing intensity fraction (i.e., the ratio of the actual to the maximum sustainable wood yield). The overall effect on the WF per unit of wood can be either positive or negative depending on several factors as described in detail by Schyns, et al. [16]. In Ireland and France, the value fraction is relatively small owing to a rather low intensity fraction (Table A1), resulting in a small WFs per unit of wood compared to some other member states. In Slovakia, Belgium, and the Netherlands, high wood yields lead to small WFs per unit of wood. In the UK and Slovenia, forest water use is on the high side of the spectrum, while this is not being compensated by high wood yields.
4. Discussion
The estimated WF of wood for energy consumed in the EU (WFwec) is inherent to uncertainties in the data on energy use from wood sources according to the EU energy reference scenario, the WF per unit of wood, and the underlying forestry statistics. The EU energy reference scenario is the result of a suite of interlinked models, which are calibrated by EUROSTAT statistics. Although subject to uncertainties, the scenario has been crosschecked and validated by the EU member states. Uncertainties in the WF per unit of wood arise mainly from data on the forest area used for wood harvesting and the value of ecosystem services (for details see [16]). Inconsistencies and uncertainties in forestry production and trade statistics, as well as recommendations for improvement, have been elaborately discussed by others [38,55]. Interpretation of our results should be mindful of the described uncertainties.
We can roughly compare our estimate of the WF of wood for energy consumed in the EU for 2015 and the European WF of energy produced from firewood for 2008–2012 as estimated by Mekonnen, et al. [18]. Both estimates pertain to the consumptive WF but differ somewhat in the countries and years considered. The WF per unit of energy is rather comparable being 59 m3/GJ (ranging from 5.5 to 122 m3/GJ) in our study and 67 m3/GJ (obtained from 33 × 109 m3/y/494 × 106 GJ/y) in theirs. However, in total volumetric terms, we find that our estimate (156 × 109 m3/y) is about five times larger than theirs (33 × 109 m3/y), the difference originating from the data on energy produced from wood sources, which is also roughly five times larger in our study (2643 PJ/y, see Table 2) compared to the input data used by Mekonnen, et al. [18] (493 PJ/y).
Compared to other energy sources like fossil fuels, nuclear energy, or certain renewables [18], the WF of wood is extremely large. We have estimated the WF of wood for energy in the EU to be in the range of 5.5 to 122 m3/GJ. This is in the same order of magnitude as the WF of bioenergy from crops [43] and of hydropower [56] but is much larger than the WF of energy from other sources (nuclear, oil, coal and lignite, geothermal, natural gas, solar, and wind), which all are less than 1 m3/GJ [18]. These differences indicate possibilities to reduce the overall WF of the EU energy consumption by changing the energy mix. Assessing natural resource use and emissions associated with different energy mixes through a range of footprint indicators [57,58] remains a topic of further research.
Generally, three sources of wood are distinguished [59]: primary wood harvests and logging residues, secondary wood fibres in the form of residues and by-products of industrial wood processing, and post-consumer wood. In 2013, total woody biomass use for energy in the EU was 63% from primary sources, 32% from secondary sources, and 5% from post-consumer sources [59]. In this study, we assumed all wood for energy comes from newly grown biomass—either directly from the forest or indirectly as a by-product of industrial wood processing—thus neglecting the minor contribution of post-consumer wood, which has zero WF because no new material has been grown. The use of forest residues and secondary wood sources for energy may be more sustainable than using valuable stemwood, but these wood streams are nearly all utilized [10] and the wood-based panel and pulp industries also compete over these wood sources [59]. Furthermore, retrieving more forest residues is costly and comes with negative environmental effects related to the extraction of nutrients and deadwood [60]. According to Dammer, et al. [61], burning wood for energy can only be considered wise at the end of the cascade after the wood has been used, recycled, and reused as a material as long as possible before ultimately being used as an energy source.
We have discussed the use of wood for energy in the context of the appropriation of limited green water resources. As argued in the introduction, an energy supply from wood sources is also prone to the risk of (drought-induced) forest fires, which can wipe out production. About 16% of the total energy produced from wood sources is in member states where the historically maximum burnt area is larger than 1.5% of the total forest and woodland area (Portugal, Greece, Croatia, Italy, Spain, and Bulgaria) (see Appendix A, Table A1). Particularly in Portugal the forest fire risk based on historic observations is high, with reported burnt areas up to 8.7% of the total forest and woodland area.
5. Conclusions
We have estimated the WF of wood for energy consumed in the EU-28 (WFwec) and placed the green WFwec in the context of green water scarcity. The WFwec is very large (156 × 109 m3/y) and adds significantly (22%) to the WF related to the EU’s consumption of agricultural and industrial products as well as domestic water use. WFwec is 94% situated within the EU and almost exclusively related to green water (99%). We show that over half of the internal WFwec is in member states that have very limited potential left to sustainably allocate more green water flows to biomass production. Policies on energy security should consider that the increased use of wood or other biomass for energy increases the already significant pressure on limited green water resources.
Author Contributions
Conceptualization, J.F.S. and D.V.; data curation, J.F.S.; formal analysis, J.F.S.; investigation, J.F.S. and D.V.; methodology, J.F.S. and D.V.; validation, J.F.S. and D.V.; visualization, J.F.S.; writing—original draft, J.F.S.; writing—review and editing, D.V.
Funding
The work by J.S. was funded by the European Commission Project “Moving Towards Adaptive Governance in Complexity: Informing Nexus Security” (MAGIC), EU-H2020 Grant Proposal No. 689669.
Acknowledgments
The work was partially developed within the framework of the Panta Rhei Research Initiative of the International Association of Hydrological Sciences (IAHS).
Conflicts of Interest
The authors declare no conflict of interest. The funders had no role in the design of the study; in the collection, analyses, or interpretation of data; in the writing of the manuscript; or in the decision to publish the results.
Appendix A

Table A1.
The water footprint per unit of solid wood equivalent (SWE) in the EU-28 member states (period: 2001–2010; source: [16]) and the historically maximum burnt area (1990–2016) from the European Fire Database [62] as fraction of the total forest and woodland area in 2015 [63].
| Member State | Water Footprint (m³/m³ SWE) | Forest Water Use (m³/ha) | Intensity Fraction * | Value Fraction ** | Wood Yield (m³ SWE/ha) | Historically Maximum Burnt Area as Fraction of Forest and Other Woodland Area in 2015 (%) |
|---|---|---|---|---|---|---|
| Slovenia | 1000 | 6855 | 0.37 | 0.33 | 2.3 | 0.17% |
| United Kingdom | 913 | 6731 | 0.46 | 0.39 | 2.9 | - |
| Croatia | 870 | 6904 | 0.45 | 0.32 | 2.6 | 2.7% |
| Hungary | 756 | 5131 | 0.55 | 0.44 | 3.0 | 0.64% |
| Luxembourg | 755 | 6008 | 0.94 | 0.75 | 6.0 | - |
| Poland | 704 | 5175 | 0.59 | 0.49 | 3.6 | 0.46% |
| Lithuania | 695 | 5106 | 0.64 | 0.54 | 4.0 | 0.052% |
| Romania | 661 | 5476 | 0.53 | 0.43 | 3.5 | 0.10% |
| Latvia | 657 | 5024 | 0.75 | 0.62 | 4.8 | 0.24% |
| Bulgaria | 642 | 5296 | 0.32 | 0.26 | 2.1 | 1.5% |
| Estonia | 624 | 4935 | 0.62 | 0.54 | 4.3 | 0.13% |
| Czech Republic | 609 | 5579 | 0.81 | 0.66 | 6.1 | 0.077% |
| Sweden | 594 | 4128 | 0.56 | 0.48 | 3.3 | 0.048% |
| Denmark | 581 | 5683 | 0.78 | 0.65 | 6.3 | - |
| Italy | 574 | 5987 | 0.35 | 0.21 | 2.2 | 2.0% |
| Finland | 556 | 3795 | 0.41 | 0.35 | 2.4 | 0.0070% |
| Germany | 545 | 5692 | 0.55 | 0.46 | 4.8 | 0.043% |
| Austria | 502 | 5926 | 0.76 | 0.64 | 7.6 | 0.010% |
| Netherlands | 417 | 5786 | 1.00 | 0.86 | 12 | - |
| France | 380 | 6238 | 0.59 | 0.26 | 4.3 | 0.42% |
| Slovakia | 311 | 5452 | 1.00 | 0.85 | 15 | 0.087% |
| Belgium | 263 | 6301 | 1.00 | 0.92 | 22 | - |
| Ireland | 193 | 6725 | 0.25 | 0.13 | 4.4 | - |
| Portugal | 61 | 7348 | 0.53 | 0.041 | 5.0 | 8.7% |
| Greece | 53 | 6860 | 0.05 | 0.0035 | 0.46 | 3.5% |
| Spain | 49 | 6630 | 0.31 | 0.020 | 2.7 | 1.6% |
* The ratio of actual wood production to maximum sustainable wood production. ** The ratio of the value of wood production to the total value of forest ecosystem services.
References
- Eurostat. Smarter, Greener, More Inclusive—Indicators to Support the Europe 2020 Strategy, 2018 ed.; Eurostat: Luxembourg, 2018. [Google Scholar]
- European Commission. 2030 Climate & Energy Framework. Available online: https://ec.europa.eu/clima/policies/strategies/2030_en (accessed on 15 November 2018).
- European Commission. 2050 Long-Term Strategy. Available online: https://ec.europa.eu/clima/policies/strategies/2050_en (accessed on 20 December 2018).
- European Commission. In-Depth Analysis in Support of the Commission Communication COM(2018) 773: A Clean Planet for All—A European Long-Term Strategic Vision for a Prosperous, Modern, Competitive and Climate Neutral Economy; European Commission: Brussels, Belgium, 2018. [Google Scholar]
- Eurostat. Wood as a Source of Energy. Available online: https://ec.europa.eu/eurostat/statistics-explained/index.php/Wood_as_a_source_of_energy (accessed on 7 November 2018).
- Henders, S.; Persson, U.M.; Kastner, T. Trading forests: Land-use change and carbon emissions embodied in production and exports of forest-risk commodities. Environ. Res. Lett. 2015, 10, 125012. [Google Scholar] [CrossRef]
- Curtis, P.G.; Slay, C.M.; Harris, N.L.; Tyukavina, A.; Hansen, M.C. Classifying drivers of global forest loss. Science 2018, 361, 1108–1111. [Google Scholar] [CrossRef] [PubMed]
- Betts, M.G.; Wolf, C.; Ripple, W.J.; Phalan, B.; Millers, K.A.; Duarte, A.; Butchart, S.H.M.; Levi, T. Global forest loss disproportionately erodes biodiversity in intact landscapes. Nature 2017, 547, 441–444. [Google Scholar] [CrossRef] [PubMed]
- Pilli, R.; Grassi, G.; Kurz, W.A.; Fiorese, G.; Cescatti, A. The European forest sector: Past and future carbon budget and fluxes under different management scenarios. Biogeosciences 2017, 14, 2387–2405. [Google Scholar] [CrossRef]
- Searchinger, T.D.; Beringer, T.; Holtsmark, B.; Kammen, D.M.; Lambin, E.F.; Lucht, W.; Raven, P.; van Ypersele, J.-P. Europe’s renewable energy directive poised to harm global forests. Nat. Commun. 2018, 9, 3741. [Google Scholar] [CrossRef]
- Yousefpour, R.; Augustynczik, A.L.D.; Reyer, C.P.O.; Lasch-Born, P.; Suckow, F.; Hanewinkel, M. Realizing Mitigation Efficiency of European Commercial Forests by Climate Smart Forestry. Sci. Rep. 2018, 8, 345. [Google Scholar] [CrossRef]
- Luyssaert, S.; Marie, G.; Valade, A.; Chen, Y.Y.; Njakou Djomo, S.; Ryder, J.; Otto, J.; Naudts, K.; Lansø, A.S.; Ghattas, J.; et al. Trade-offs in using European forests to meet climate objectives. Nature 2018, 562, 259–262. [Google Scholar] [CrossRef]
- Vanham, D. Does the water footprint concept provide relevant information to address the water–food–energy–ecosystem nexus? Ecosyst. Serv. 2016, 17, 298–307. [Google Scholar] [CrossRef]
- Vanham, D.; Comero, S.; Gawlik, B.M.; Bidoglio, G. The water footprint of different diets within European sub-national geographical entities. Nat. Sustain. 2018, 1, 518–525. [Google Scholar] [CrossRef]
- Vanham, D.; Mekonnen, M.M.; Hoekstra, A.Y. The water footprint of the EU for different diets. Ecol. Indic. 2013, 32, 1–8. [Google Scholar] [CrossRef]
- Schyns, J.F.; Booij, M.J.; Hoekstra, A.Y. The water footprint of wood for lumber, pulp, paper, fuel and firewood. Adv. Water Resour. 2017, 107, 490–501. [Google Scholar] [CrossRef]
- Hoekstra, A.Y.; Mekonnen, M.M. The water footprint of humanity. Proc. Natl. Acad. Sci. USA 2012, 109, 3232–3237. [Google Scholar] [CrossRef] [PubMed]
- Mekonnen, M.M.; Gerbens-Leenes, P.W.; Hoekstra, A.Y. The consumptive water footprint of electricity and heat: A global assessment. Environ. Sci. Water Res. Technol. 2015, 1, 285–297. [Google Scholar] [CrossRef]
- Boisvenue, C.; Running, S.W. Impacts of climate change on natural forest productivity—Evidence since the middle of the 20th century. Glob. Chang. Biol. 2006, 12, 862–882. [Google Scholar] [CrossRef]
- Allen, C.D.; Macalady, A.K.; Chenchouni, H.; Bachelet, D.; McDowell, N.; Vennetier, M.; Kitzberger, T.; Rigling, A.; Breshears, D.D.; Hogg, E.H.; et al. A global overview of drought and heat-induced tree mortality reveals emerging climate change risks for forests. For. Ecol. Manag. 2010, 259, 660–684. [Google Scholar] [CrossRef]
- Zhao, M.; Running, S.W. Drought-Induced Reduction in Global Terrestrial Net Primary Production from 2000 through 2009. Science 2010, 329, 940–943. [Google Scholar] [CrossRef]
- Turco, M.; von Hardenberg, J.; AghaKouchak, A.; Llasat, M.C.; Provenzale, A.; Trigo, R.M. On the key role of droughts in the dynamics of summer fires in Mediterranean Europe. Sci. Rep. 2017, 7, 81. [Google Scholar] [CrossRef] [PubMed]
- De Rigo, D.; Libertà, G.; Durrant, T.H.; Vivancos, T.A.; San-Miguel-Ayanz, J. Forest Fire Danger Extremes in Europe Under Climate Change: Variability and Uncertainty; European Union: Luxembourg, 2017. [Google Scholar]
- Seidl, R.; Schelhaas, M.-J.; Rammer, W.; Verkerk, P.J. Increasing forest disturbances in Europe and their impact on carbon storage. Nat. Clim. Chang. 2014, 4, 806–810. [Google Scholar] [CrossRef]
- Vanham, D.; Hoekstra, A.Y.; Wada, Y.; Bouraoui, F.; de Roo, A.; Mekonnen, M.M.; van de Bund, W.J.; Batelaan, O.; Pavelic, P.; Bastiaanssen, W.G.M.; et al. Physical water scarcity metrics for monitoring progress towards SDG target 6.4: An evaluation of indicator 6.4.2 “Level of water stress”. Sci. Total Environ. 2018, 613, 218–232. [Google Scholar] [CrossRef]
- Schyns, J.F.; Hoekstra, A.Y.; Booij, M.J. Review and classification of indicators of green water availability and scarcity. Hydrol. Earth Syst. Sci. 2015, 19, 4581–4608. [Google Scholar] [CrossRef]
- Schyns, J.F.; Hoekstra, A.Y.; Booij, M.J.; Hogeboom, R.J.; Mekonnen, M.M. Limits to the world’s green water resources for food, feed, fibre, timber and bioenergy. Proc. Natl. Acad. Sci. USA 2019, in press. [Google Scholar]
- Schyns, J.F. Sustainable and Efficient Allocation of Limited Blue and Green Water Resources. Ph.D. Thesis, University of Twente, Enschede, The Netherlands, 2018. [Google Scholar]
- Bengtsson, J.; Nilsson, S.G.; Franc, A.; Menozzi, P. Biodiversity, disturbances, ecosystem function and management of European forests. For. Ecol. Manag. 2000, 132, 39–50. [Google Scholar] [CrossRef]
- Verkerk, P.J.; Zanchi, G.; Lindner, M. Trade-Offs Between Forest Protection and Wood Supply in Europe. Environ. Manag. 2014, 53, 1085–1094. [Google Scholar] [CrossRef] [PubMed]
- Angelstam, P.; Naumov, V.; Elbakidze, M.; Manton, M.; Priednieks, J.; Rendenieks, Z. Wood production and biodiversity conservation are rival forestry objectives in Europe’s Baltic Sea Region. Ecosphere 2018, 9, e02119. [Google Scholar] [CrossRef]
- Naumov, V.; Manton, M.; Elbakidze, M.; Rendenieks, Z.; Priednieks, J.; Uhlianets, S.; Yamelynets, T.; Zhivotov, A.; Angelstam, P. How to reconcile wood production and biodiversity conservation? The Pan-European boreal forest history gradient as an “experiment”. J. Environ. Manag. 2018, 218, 1–13. [Google Scholar] [CrossRef] [PubMed]
- Langner, A.; Irauschek, F.; Perez, S.; Pardos, M.; Zlatanov, T.; Öhman, K.; Nordström, E.-M.; Lexer, M.J. Value-based ecosystem service trade-offs in multi-objective management in European mountain forests. Ecosyst. Serv. 2017, 26, 245–257. [Google Scholar] [CrossRef]
- Verkerk, P.J.; Levers, C.; Kuemmerle, T.; Lindner, M.; Valbuena, R.; Verburg, P.H.; Zudin, S. Mapping wood production in European forests. For. Ecol. Manag. 2015, 357, 228–238. [Google Scholar] [CrossRef]
- Mola-Yudego, B.; Arevalo, J.; Díaz-Yáñez, O.; Dimitriou, I.; Freshwater, E.; Haapala, A.; Khanam, T.; Selkimäki, M. Reviewing wood biomass potentials for energy in Europe: The role of forests and fast growing plantations. Biofuels 2017, 8, 401–410. [Google Scholar] [CrossRef]
- Mola-Yudego, B.; Arevalo, J.; Díaz-Yáñez, O.; Dimitriou, I.; Haapala, A.; Carlos Ferraz Filho, A.; Selkimäki, M.; Valbuena, R. Wood biomass potentials for energy in northern Europe: Forest or plantations? Biomass Bioenergy 2017, 106, 95–103. [Google Scholar] [CrossRef]
- Hurmekoski, E.; Hetemäki, L.; Linden, M. Factors affecting sawnwood consumption in Europe. For. Policy Econ. 2015, 50, 236–248. [Google Scholar] [CrossRef]
- O’Brien, M.; Bringezu, S. European Timber Consumption: Developing a Method to Account for Timber Flows and the EU’s Global Forest Footprint. Ecol. Econ. 2018, 147, 322–332. [Google Scholar] [CrossRef]
- Van Oel, P.R.; Hoekstra, A.Y. Towards Quantification of the Water Footprint of Paper: A First Estimate of its Consumptive Component. Water Resour. Manag. 2012, 26, 733–749. [Google Scholar] [CrossRef]
- Tian, M.H.; Ke, S.F. Virtual Water Content and Trade Analysis of Primary Woody Products in China. Int. For. Rev. 2012, 14, 380–390. [Google Scholar] [CrossRef]
- Ma, X.; Shen, X.; Qi, C.; Ye, L.; Yang, D.; Hong, J. Energy and carbon coupled water footprint analysis for Kraft wood pulp paper production. Renew. Sustain. Energy Rev. 2018, 96, 253–261. [Google Scholar] [CrossRef]
- Gerbens-Leenes, P.W.; Hoekstra, A.Y.; van der Meer, T. The water footprint of energy from biomass: A quantitative assessment and consequences of an increasing share of bio-energy in energy supply. Ecol. Econ. 2009, 68, 1052–1060. [Google Scholar] [CrossRef]
- Mathioudakis, V.; Gerbens-Leenes, P.W.; Van der Meer, T.H.; Hoekstra, A.Y. The water footprint of second-generation bioenergy: A comparison of biomass feedstocks and conversion techniques. J. Clean. Prod. 2017, 148, 571–582. [Google Scholar] [CrossRef]
- Chiu, Y.-W.; Wu, M. The water footprint of biofuel produced from forest wood residue via a mixed alcohol gasification process. Environ. Res. Lett. 2013, 8, 035015. [Google Scholar] [CrossRef]
- Capros, P.; De Vita, A.; Tasios, N.; Siskos, P.; Kannavou, M.; Petropoulos, A.; Evangelopoulou, S.; Zampara, M.; Papadopoulos, D.; Nakos, C. EU Reference Scenario 2016-Energy, Transport and GHG Emissions Trends to 2050; European Commission: Luxembourg, 2016. [Google Scholar]
- Eurostat. EU Trade since 1988 by HS2-HS4 [DS-016894]. Available online: https://ec.europa.eu/eurostat/data/database (accessed on 24 October 2018).
- UNECE/FAO. Forest Product Conversion Factors for the UNECE Region; UNECE/FAO: Geneva, Switzerland, 2010. [Google Scholar]
- Speight, J.G. Properties of fuels from wood sources. In The Biofuels Handbook; Speight, J.G., Ed.; RSC Energy Series; Royal Society of Chemistry: Cambridge, UK, 2010; Chapter 4; pp. 304–330. [Google Scholar]
- Hoekstra, A.Y.; Chapagain, A.K.; Aldaya, M.M.; Mekonnen, M.M. The Water Footprint Assessment Manual: Setting the Global Standard; Earthscan: London, UK, 2011. [Google Scholar]
- Pouzols, F.M.; Toivonen, T.; Di Minin, E.; Kukkala, A.S.; Kullberg, P.; Kuustera, J.; Lehtomaki, J.; Tenkanen, H.; Verburg, P.H.; Moilanen, A. Global protected area expansion is compromised by projected land-use and parochialism. Nature 2014, 516, 383–386. [Google Scholar] [CrossRef]
- UNECE/FAO. 2015 Joint Wood Energy Enquiry. Available online: http://www.unece.org/forests/jwee.html (accessed on 22 October 2018).
- Vanham, D.; Bidoglio, G. A review on the indicator water footprint for the EU28. Ecol. Indic. 2013, 26, 61–75. [Google Scholar] [CrossRef]
- Vanham, D. The water footprint of the EU: Quantification, sustainability and relevance. Water Int. 2018, 43, 731–745. [Google Scholar] [CrossRef]
- Costanza, R.; de Groot, R.; Sutton, P.; van der Ploeg, S.; Anderson, S.J.; Kubiszewski, I.; Farber, S.; Turner, R.K. Changes in the global value of ecosystem services. Glob. Environ. Chang. 2014, 26, 152–158. [Google Scholar] [CrossRef]
- Kallio, A.; Solberg, B. On the Reliability of International Forest Sector Statistics: Problems and Needs for Improvements. Forests 2018, 9, 407. [Google Scholar] [CrossRef]
- Hogeboom, R.J.; Knook, L.; Hoekstra, A.Y. The blue water footprint of the world’s artificial reservoirs for hydroelectricity, irrigation, residential and industrial water supply, flood protection, fishing and recreation. Adv. Water Resour. 2018, 113, 285–294. [Google Scholar] [CrossRef]
- Mekonnen, M.M.; Gerbens-Leenes, P.W.; Hoekstra, A.Y. Future electricity: The challenge of reducing both carbon and water footprint. Sci. Total Environ. 2016, 569, 1282–1288. [Google Scholar] [CrossRef] [PubMed]
- Fang, K.; Heijungs, R.; de Snoo, G.R. Theoretical exploration for the combination of the ecological, energy, carbon, and water footprints: Overview of a footprint family. Ecol. Indic. 2014, 36, 508–518. [Google Scholar] [CrossRef]
- Camia, A.; Robert, N.; Jonsson, K.; Pilli, R.; Garcia Condado, S.; Lopez Lozano, R.; van der Velde, M.; Ronzon, T.; Gurria Albusac, P.; M’barek, R.; et al. Biomass Production, Supply, Uses and Flows in the European Union: First Results from an Integrated Assessment; European Union: Luxembourg, 2018. [Google Scholar]
- European Commission. Sustainable and Optimal Use of Biomass for Energy in the EU Beyond 2020; European Commission: Luxembourg, 2017. [Google Scholar]
- Dammer, L.; Bowyer, C.; Breitmayer, E.; Eder, A.; Nanni, S.; Allen, B.; Carus, M.; Essel, R. Mapping Study on Cascading Use of Wood Products; WWF: Gland, Switzerland, 2016. [Google Scholar]
- Joint Research Centre (JRC). European Fire Database of the European Forest Fire Information System (EFFIS)—Total Burnt Areas. Available online: http://effis.jrc.ec.europa.eu/media/cms_page_media/54/burnt_area_SSA8Odn.csv (accessed on 6 November 2018).
- Eurostat. Area of Wooded Land (Source: FAO—FE). Available online: https://ec.europa.eu/eurostat/data/database (accessed on 6 November 2018).
Figure 1.
Water footprint of wood per unit of energy produced (m3/GJ).

Table 1.
Data sources and applied conversions to estimate the water footprint (WF) of wood for energy consumed in the European Union (EU) according to Equation (1).
Table 1.
Data sources and applied conversions to estimate the water footprint (WF) of wood for energy consumed in the European Union (EU) according to Equation (1).
| Variable | Source | Unit in Source | Converted to | Conversion Factors |
|---|---|---|---|---|
| P | Capros, et al. [45] | ktoe | m3 SWE | Per member state [51]; on average, 0.21 ktoe/thousand m3 SWE. |
| E | EUROSTAT [46] | kg | m3 SWE | Traded weight to volumes of primary raw timber equivalents (metric ton to m3): 1.5 for fuelwood and 6 for charcoal [38]; volumetric fraction of SWE in raw timber: 0.9 [16]. |
| WFswe | Schyns, et al. [16] | m3 water per m3 roundwood | m3 water per m3 SWE | Adjusted for bark using conversion factors for coniferous and non-coniferous fuelwood [47]; volumetric fraction of SWE in raw timber [16]. |
| I | EUROSTAT [46] | kg | m3 raw timber equivalent | Traded weight to volumes of primary raw timber equivalents, per product group [38]. |
| WFrt | Schyns, et al. [16] | m3 water per m3 roundwood | m3 water per m3 raw timber | Adjusted for bark using conversion factors for coniferous and non-coniferous fuelwood [47]. |
Table 2.
The water footprint of wood for energy consumed in the EU in 2015 per country of origin. Member states are ordered top-down based on the largest total water footprint.
Table 2.
The water footprint of wood for energy consumed in the EU in 2015 per country of origin. Member states are ordered top-down based on the largest total water footprint.
| Origin | Energy from Wood Sources Produced for Consumption within the EU-28 a (PJ) | Green Water Footprint b (109 m3/y) | Blue Water Footprint b (109 m3/y) | Total Water Footprint b (109 m3/y) | Green Water Scarcity c (%) |
|---|---|---|---|---|---|
| Sweden | 379 | 26 | 0.00082 | 26 | 47% |
| Finland | 347 | 22 | 0.0066 | 22 | 43% |
| Poland | 195 | 16 | 0.0070 | 16 | 83% |
| Germany | 216 | 12 | 0.26 | 13 | 179% |
| Austria | 163 | 10 | 0 | 10 | 68% |
| Romania | 118 | 8.9 | 0 | 8.9 | 83% |
| Italy | 124 | 8.1 | 0.24 | 8.4 | 90% |
| Czech Republic | 86 | 6.2 | 0 | 6.2 | 101% |
| France | 157 | 6.0 | 0.0051 | 6.0 | 91% |
| Latvia | 72 | 5.3 | 0.36 | 5.7 | 85% |
| UK | 42 | 5.2 | 0 | 5.2 | 128% |
| Hungary | 33 | 2.6 | 0.36 | 2.9 | 86% |
| Lithuania | 35 | 2.7 | 0.15 | 2.9 | 94% |
| Estonia | 37 | 2.3 | 0.49 | 2.7 | 88% |
| Bulgaria | 35 | 2.6 | 0 | 2.6 | 76% |
| Slovenia | 26 | 2.5 | 0 | 2.5 | 85% |
| Croatia | 29 | 2.3 | 0 | 2.3 | 70% |
| Slovakia | 36 | 1.0 | 0 | 1.0 | 85% |
| Denmark | 14 | 0.85 | 0.089 | 0.94 | 145% |
| Belgium | 20 | 0.58 | 0.0088 | 0.59 | 120% |
| Spain | 101 | 0.55 | 0 | 0.55 | 93% |
| Portugal | 77 | 0.54 | 0 | 0.54 | 100% |
| Netherlands | 5.2 | 0.19 | 0.058 | 0.24 | 253% |
| Ireland | 11 | 0.24 | 0.00013 | 0.24 | 78% |
| Luxembourg | 3.9 | 0.22 | 0 | 0.22 | 86% |
| Greece | 19 | 0.11 | 0 | 0.11 | 120% |
| Cyprus | 0 | 0 | 0 | 0 | 229% |
| Malta | 0 | 0 | 0 | 0 | 187% |
| EXTRA EU-28 | 264 | 8.9 | 0.28 | 9.2 | - |
| TOTAL | 2643 | 154 | 2 | 156 | - |
© 2019 by the authors. Licensee MDPI, Basel, Switzerland. This article is an open access article distributed under the terms and conditions of the Creative Commons Attribution (CC BY) license (http://creativecommons.org/licenses/by/4.0/).
Share and Cite
MDPI and ACS Style
Schyns, J.F.; Vanham, D. The Water Footprint of Wood for Energy Consumed in the European Union. Water 2019, 11, 206. https://doi.org/10.3390/w11020206
AMA Style
Schyns JF, Vanham D. The Water Footprint of Wood for Energy Consumed in the European Union. Water. 2019; 11(2):206. https://doi.org/10.3390/w11020206
Chicago/Turabian StyleSchyns, Joep F., and Davy Vanham. 2019. "The Water Footprint of Wood for Energy Consumed in the European Union" Water 11, no. 2: 206. https://doi.org/10.3390/w11020206
Note that from the first issue of 2016, this journal uses article numbers instead of page numbers. See further details here.