Socioeconomic Factors Affecting Water Access in Rural Areas of Low and Middle Income Countries


1
Generalitat de Catalunya, Catalonia Trade and Investment Washington DC, Washington, DC 20001, USA
2
Research Group of “Economia Aplicada” (GEAP), Institut d’Economia de Barcelona (IEB), Departament d’Economia Aplicada, Universitat Autònoma de Barcelona, 08193 Bellaterra, Spain
3
Departament d’Economia i d’Història Econòmica, Unitat de Fonaments de l’Anàlisi Econòmica, Universitat Autònoma de Barcelona, 08193 Bellaterra, Spain
*
Author to whom correspondence should be addressed.
Water 2019, 11(2), 202; https://doi.org/10.3390/w11020202
Submission received: 23 November 2018
/
Revised: 18 January 2019
/
Accepted: 20 January 2019
/
Published: 24 January 2019
(This article belongs to the Special Issue Water Allocation in Rural Area: Economic Influences and Better Management)
Abstract
:Worldwide, 844 million people still lack access to basic drinking water, especially in the rural areas of low and middle income countries. However, considerable progress has been made in recent years due to work on the Millennium Development Goals and Sustainable Development Goals. Nevertheless, countries’ national characteristics have often impacted on this progress. This paper analyzes whether specific socioeconomic factors affect access to improved water sources in the rural areas of developing countries. In particular, we analyze access to ‘total improved’, piped on premises, as well as other improved sources of access in rural areas for low income, low-middle income, and high-middle income countries. Our results suggest that gross national income (GNI); female primary completion rate; agriculture; growth of rural population; and governance indicators, such as political stability, control of corruption, or regulatory quality are variables related to water access, although specific associations depend on the source of water and income group examined. Understanding these interrelations could be of great importance for decision makers in the water sector as well as for future research on this topic.
1. Introduction
Water is essential to all environmental, human, and social processes. It is a key element both for life itself and for development. Its fundamental role in food and sanitation makes it an irreplaceable commodity, as well as a basic resource for economic activity: agriculture and many other industrial and commercial activities require it as a raw material, and it also constitutes a source of energy. It is impossible to conceive of socioeconomic development without a healthy population. Health and development are very closely linked and it is unimaginable to consider one without the other. A healthy community depends on development and, at the same time, health is an essential requisite for development. Contaminated drinking water is one of the most common causes of disease and death in developing countries. Inadequate drinking-water is estimated to cause 502,000 diarrheal deaths per year in low and middle income countries and for children aged under five it leads to 361,000 deaths a year [1].
According to the World Health Organization (WHO) and United Nations International Children’s Emergency Fund’s (UNICEF) Joint Monitoring Programme (JMP), approximately 844 million people worldwide lacked access to safe water in 2015 [2]. A vast majority of them were individuals who resided in the rural regions of developing countries. Although 97% of the global urban population used improved water sources (i.e., an improved water source within a 30 min round trip to collect water), only 86% of the global rural population had access to them [2]. Improved water sources are those protected from outside contamination (particularly fecal matter [2]), such as rainwater, protected public taps, or dug wells. However, it is possible that applying this criteria for quantifying water access in the world may be misleading, and that a more significant figure may be the “piped on premises” water source. If this is the measure, then the percentage of the population that has had access to drinking water is much lower. Employing these criteria, in 2015 the percentage of global water access went from 92% to 74% of the total population, and only about 60% of the rural population [2]. Additionally, in the rural areas of developing countries, only 28% of the population had access to piped water sources; and 3% in the least developed countries [2].
Neither does access to piped or dug sources imply regular water provision. Circumstances such as rain shortages, bad water management, or a lack of resources for the maintenance of infrastructure, can lead to irregular provision. Not having on premises access to water may force some members of the family, especially women and girls, to spend many hours a day fetching water instead of using this time to generate income, go to school, or enjoy leisure activities.
An important step to universalize water access was taken during the millennium summit of the United Nations Assembly (UN) held in 2000. Recognizing the urgency to establish measures oriented to alleviate poverty, eight goals—known as the Millennium Development Goals (MDGs)—were established. These specific and quantifiable objectives were set to be fulfilled in 15 years. Within goal number 7 access to water was included in Target 7.3, stating that, by 2015, the percentage of global population without access to safe water and sanitation should be reduced by half [3].
Another important step towards the achievement of universal access was taken in July 2010 when the United Nations General Assembly recognized the basic human right to water and sanitation. The UN “calls on States and international organizations to provide financial resources, build capacity and transfer technology, particularly to developing countries, in scaling up efforts to provide safe, clean, accessible, and affordable drinking water and sanitation for all” (A/RES/64/292). Even though several treaties, previous to this date, contemplated this fact, this resolution was essential in order to make it binding, and meant that “all means possible” were to be applied in order to make access to drinking water a reality.
An assessment in 2015 of the MDGs’ targets showed that globally, 147 countries met the MDG sustainable drinking water target and a total of 2.6 billion people had gained access since 1990. However, only over half of the global population enjoyed water supply piped on premises (58%). The last step in this process was taken in September 2015 when a new set of 17 goals, known as the Sustainable Development Goals (SDGs), was agreed. The overall aim is to achieve universal and equitable access to safe and affordable drinking water for all by 2030 [4].
Lack of improved water sources, especially in developing countries, is a global problem with very severe consequences for human development. Extensive efforts are being made by numerous organizations such as the WHO, UNICEF, and the UN to decrease the magnitude of this problem and make water access universal. In the last two decades, much progress has been made [3]. However, the national characteristics of countries may intensify or obstruct this progress and therefore, it is of great importance to understand these underlying forces as they may provide the basis for establishing grounded objectives and policy priorities. With the aim of contributing to this knowledge, the objective of our paper is to identify the determinants of water access with a specific focus on rural areas of developing countries, as these are the most affected by the lack of access to improved water sources [2]. In our analysis we identify as developing countries those classified as middle-high, middle-low, and low income countries by the World Bank Classification. This classification was also employed by Alcamo et al. [5].
For doing this paper we follow the previous studies of Munamati et al., Luo et al. and Luh and Bartram [6,7,8]. Munatami et al. [6] analyze the determinants for sanitation success in Sub-Saharan African, Luo et al. [7] analyze access to improved sanitation in China and Luh and Bartram [8] study the determinants for water access for 73 countries. In their paper, Munatami et al. make a regression analysis to estimate the number of population gaining access to sanitation from years 2000 to 2015 depending on different economic variables and socio-political variables, such as Gross Domestic Product (GDP) per capita, Official Development Assistance (ODA) and political stability. Their results suggest that countries achieving a higher access to sanitation are the ones with higher levels of education, higher incomes levels, higher population density and political stability [6]. Luo et al. use a spatial regression model to analyze the factors easing access to sanitation in China. They find that some socio-economic variables, such as GDP per capita or illiteracy are related to access to sanitation [7]. Finally, Luh and Bartram study the factors easing access to water services using as a dependent variable an “indicator of progress” instead of “access to water resources” for years 2000 up to 2012. However, their results show that none of the variables analyzed had any significance in relation to the indicator of water progress. They suggest that this could be due to the fact that data for the independent variables are taken for the last year available and not for the whole period analyzed [8]. Following these studies, in our paper we want to analyze the determinants for access to water in rural areas as Munatami et al. did [6] but, instead of analyzing only the increase of population gaining access to sanitation during these years, we analyze the access to water for the whole period between 1990 and 2015. In contrast to the Luo et al. [7] analysis we use a panel data approach using a fixed effect model instead of a spatial model because we think it fits better our database. In addition, we want to provide new results that may contrast with the previous results of Luh and Bartram [8] by using a different approach and also by taking into account a longer period, 1990–2015, as well as different indicators. A similar procedure is used by Hopewell and Graham when analyzing access to water services in 31 different sub-Saharan cities. They use different independent variables but they do not find them to be significant except for population density, GDP growth and ODA [9]. Note that the adoption of socioeconomic variables to understand the situation of water access is also used by Onda et al. They do a cluster analysis for water access using similar variables as we use (Gross National Product per capita, ODA, Government Effectiveness) [10]. In addition to these studies our paper is also related to the studies of [11,12,13,14,15,16], in their studies they analyze determinants for water access at a national level, although they concentrated solely on one variable, such as foreign aid [11,12,13] or, if they analyze a number of variables, then they focus only on a specific country or region [14,15,16]. Following these previous studies, the main contribution of our paper is to give a more general perspective. Instead of taking into account only one variable or one region, we analyze several socioeconomic variables with a worldwide perspective. In this regard, for developing countries, Dondeynaz et al. developed a study based on principal components (factor) analysis of the indicators for water access, but provided few insights into the relation between water access and the indicators analyzed. These authors do not find empirical evidence, or at least robust results, to confirm the link between the variables used in their models with the access to water sources [17]. So, our main objective is to identify the determinants of water access in rural areas of developing countries and their links with different sources of access to water. To do so, a regression analysis will be performed using a panel data approach to analyze whether the percentage of the population with access to improved water sources in those areas is correlated with a set of national, social and economic characteristics. As substantial differences between provision by improved and piped on premises sources exist, the regression analysis will be carried out separately, taking into account different sources. Moreover, using the classification from the World Bank, we have grouped the countries analyzed into high-middle, low-middle and low income countries. Regressions will be made for the global list and for each classification. Additionally, performing the regression analysis for groups of countries at the same economic level will allow for a greater degree of specification of the water access problem, and may also help guide the development of policies that are more focused.
As far as we know this is the first time that this problem has been analyzed using a panel data approach. In addition, no specific literature was found that addressed water access as a disaggregated variable depending on the type of sources—whether piped on premises or improved, although there are many differences between these sources of access. Moreover, performing regressions by income–country groupings may also provide different insights on the problem of improved water service access. This paper takes a different approach that has not been examined to date.
Our results show that the richer the country, the greater the access to piped water sources. This result is more pronounced in middle-low and low income countries. Female education has a positive relation with water access to improved and piped water sources for middle-low and low income countries. On the other hand, agriculture has a negative relationship for those countries. For low income countries, this negative relationship is present in all water sources analyzed. Governance indicators impact access to water sources differently, predominantly depending on the group of countries analyzed. Finally, our results show that, in general, official development assistance presents no significant relation with water access, except in the case of other improved sources.
2. Materials and Methods
In this section we are going to present the variables used in our regressions and the methodological approach used to analyze the relation between these variables and water access in the rural areas of developing countries.
2.1. Countries Selected for the Analysis
To perform our study, we follow the classification of the World Bank (2015) that groups countries by income. This classification generates four different country groups: low, lower-middle, upper-middle, and high. Income is measured by gross national income (GNI) per capita, in U.S. dollars, converted from local currency using the World Bank Atlas method.
For the 2016 fiscal year, low-income economies are defined as those with a Gross National Income (GNI) per capita, lower than $1045; middle-income economies are those with a GNI per capita between $1045 and $12,736; high-income economies are those with a GNI per capita of $12,736 or more. Lower-middle-income and upper-middle-income economies are separated at a GNI per capita of $4125 (World Bank Group, 2015).
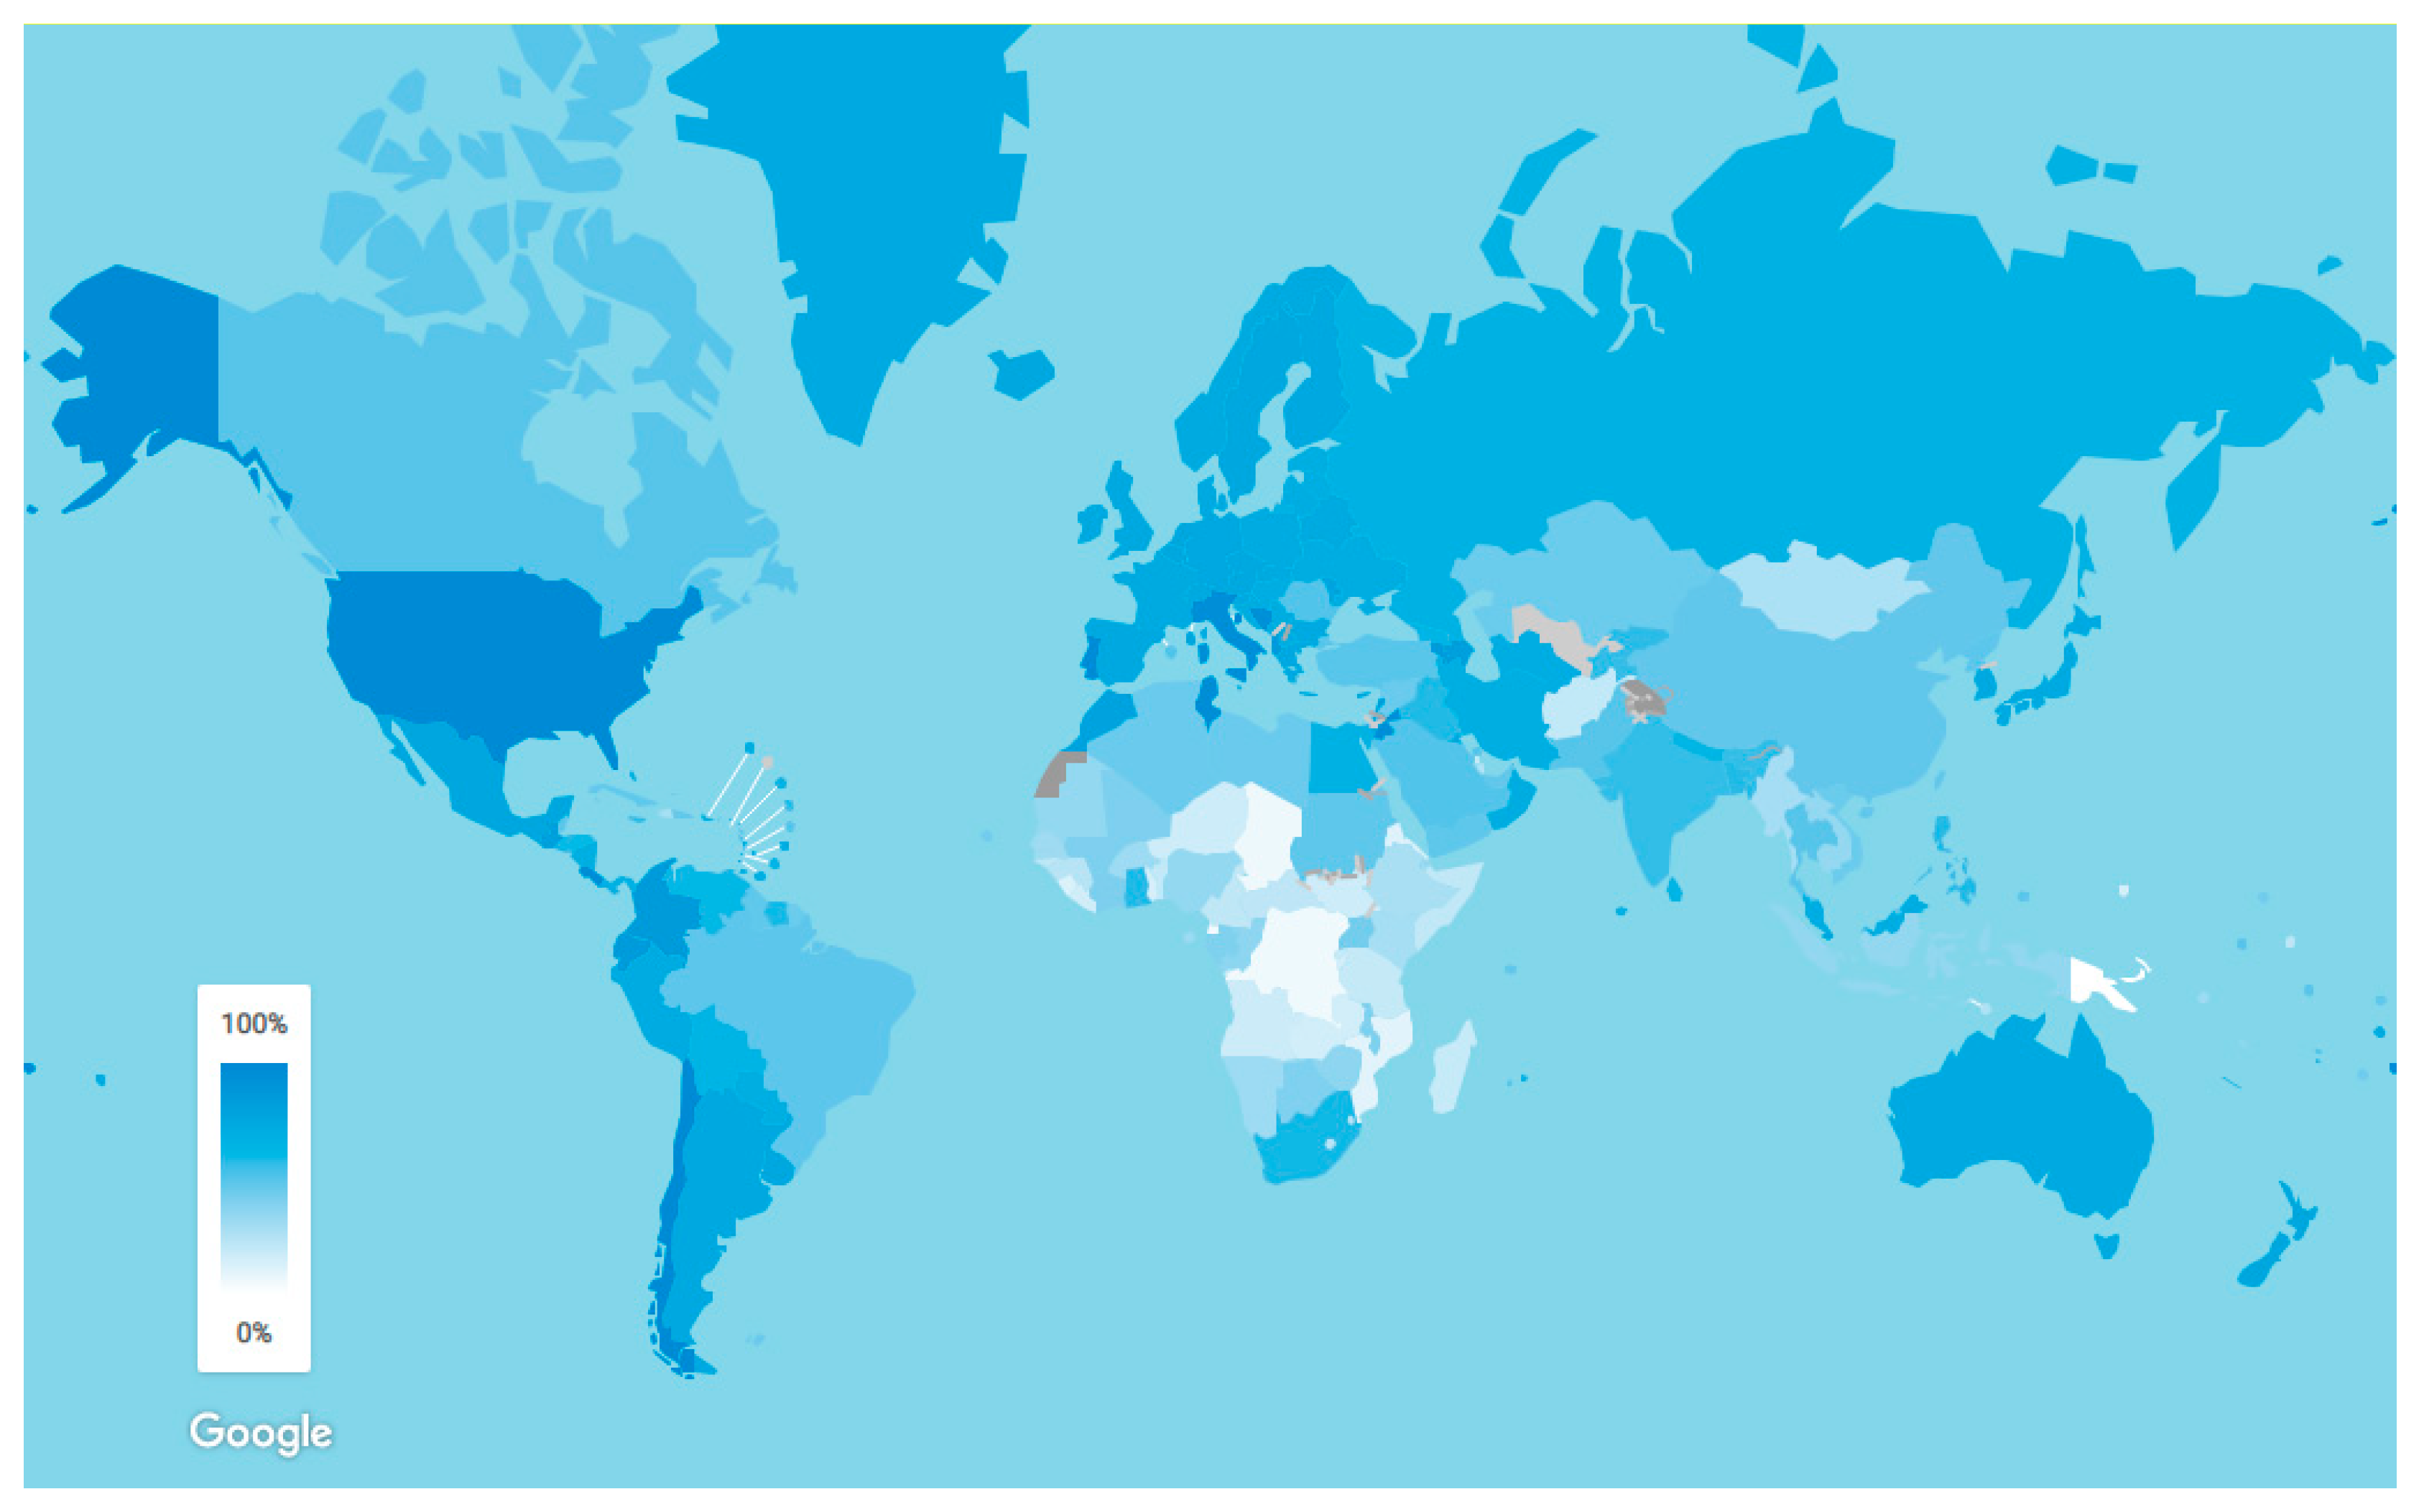
As we can see in the Figure 1, sub-Saharan African countries have least water access. It can also be noted that serious efforts to improve water services are needed in a number of Southeast Asian and South American countries.
In our classification we have 31 countries classified as low-income (Table A1, Appendix A), 51 as lower-middle-income (Table A2, Appendix A) and 53 as higher-middle-income countries (Table A3, Appendix A). The majority are located in sub-Saharan Africa, but also in South America and Southeast Asia. Therefore, it will be important to perform regressions at a broader scale (for the global list of countries), and individually for the different income level groups, to check for any possible variation in the results between groups.
2.2. Econometric Model
Our paper analyzes the relation between water access and socio-economic characteristics. This econometric approach seeks to analyze the relationship between one dependent variable (water access in our case), and our independent variables. As we have information for different countries (cross-section information) and through time (time-series information), our data set presents a panel data structure.
A linear fixed effects model was chosen for the regressions in the global data set and in the middle-high income countries because it was assumed that the differences between countries were constant or “fixed”, rather than random. The Hausman test confirms our hypothesis, chi (2) = 64.92; prob > chi (2) = 0.0000 for the global data set and chi (2) = 20.36; prob > chi (2) = 0.0091 for middle-high income countries. For middle-low and low income countries the prob > chi (2) are 0.1666 and 0.5220 respectively. Since the Hausman test cannot be implemented when there is heterokedasticity and autocorrelation in the database, we prefer to present the results with fixed effects in all cases, assuring our estimates are unbiased. The main results do not change significantly if we use random effects for middle-low and low income countries. A fixed effects model is less restricted than a random effects model, because it does not assume a common interception for all countries (it includes country dichotomizing variables). Moreover, we incorporate dummy country variables and dummy temporal variables (one for every year in the sample). All these variables help us to capture any particular characteristic of a country or any common event that affects all the countries at a specific point in time, respectively.
This model is expressed as follows:
where i = 1, …; m is the number of countries; t = 1, …, Ti; Ti is the number of years in the panel, vi is a vector of the dichotomous variables for each country, ηt represents a dichotomous variable vector for every year and eit is a disturbance that in our case is autocorrelated of order 1 and present heteroscedasticity:
where the covariance matrix of uit is assumed to be:
Yit = vi + ηt + β1X1it + ⋯ + eit
Section eit = ρeit−1 + uit
And the covariance matrix Ψ of the error term eit can then be written as:
We estimate the model using the command “xtpcse” of Stata13 software, with the options “het” (assume panel-level heteroskedastic errors) and “correlation(psar1)” (use panel-specific AR1 autocorrelation structure), under a generalized least-squares (GLS) estimator of Prais-Winsten.
We implement an F-test to check the significance of the fixed effects in front of the pooled Ordinary Least Squares (OLS) regression. Our results indicate that the null hypothesis can be rejected, and therefore it is preferable to use the fixed effects model (2) instead of pooled OLS (Results of the F-test for the significance of fixed effects show a coefficient of 293.83, so we can reject the possibility that pooled OLS is preferred to fixed effects).
Moreover, for the analysis by income groups and water source, we used the Wald analysis to obtain data on which of the different governance indicators are relevant to increase the robustness of our results. (Table A4, Table A5 and Table A6 in the Appendix A).
Multicollinearity tests were run for the independent variables. Results showed high correlation between logGNI, “agriculture added value”, and primary completion rate for females for the global data set. In order to eliminate this problem, we estimated the global model by analyzing the impact of these variables using different regressions.
For the reduced data set, there were no multicollinearity problems between our variables.
2.3. Dependent Variables
The dependent variables used in this paper provide information on the different levels of the population that has improved water access, for different types of water access. We consider different definitions for “improved water source”, that includes piped water on premises sources (piped household water connections located inside the user’s dwelling, plot, or yard), and other improved drinking water sources (public taps or standpipes, tube wells or boreholes, protected dug wells, protected springs, and rainwater collection stored in tanks or cisterns until used) [2]. Unimproved drinking-water sources include unprotected dug wells and springs, carts with small tanks or drums, tanker trucks, surface water (river, dam, lake, pond, stream, canal, irrigation channel), and bottled water that comes from unimproved sources). Finally, we divide our dependent variables into three categories that show the source type of water access: total improved, piped on premises, and other improved. That is, total improved represents the proportion of rural population with access to improved water sources. Piped on premises represents the proportion of rural population with access to water by pipes. Finally, other improved water represents the proportion of the rural population with access to improved drinking water sources apart from pipes, located inside the household.
2.4. Independent Variables
The variables chosen that explain access to water sources represent an indicator of development. Table 1 shows the mean value and standard deviation value (in brackets) for the variables chosen. Results are provided for all the period analyzed both for the global database and also for each income country group.
Gross national income (GNI) is defined by the World Bank as the sum of value added by all resident producers plus any product taxes (less subsidies) not included in the valuation of output plus net receipts of primary income from abroad (World Bank Group, 2015). GNI per capita World Bank Atlas method (formerly GNP per capita) is the gross national income, converted to U.S. dollars using the World Bank Atlas method divided by the midyear population.
In this paper, variables that define a country’s development are used as independent variables. As development includes many factors—economic, environmental, cultural, educational, and institutional—no individual variable provides a complete picture. However, residents’ total earnings in an economy, measured by its GNI, is a good measure of a country’s capacity to provide “well-being” to its people (World Bank Group, 2015). Therefore, we are testing if greater capacity to provide well-being translates into greater access to water resources or not. We expect a positive and significant relation between these two variables, since higher economic standards should mean greater access to water resources.
We transform this variable into its natural logarithm, because the relationship between GNI and water access is not linear. If we assume a linear model, the distributional properties of errors is not fitted and our estimations would be biased. To solve this problem, we use a natural log transformation of the variable GNI. In the case in which the independent variable is transformed into its logarithm and the independent variable remains the same the interpretation is made in terms of percentage change [18].
Another important independent variable is the role that women play in their families and communities in developing countries. Women are major contributors to their households due to the role they carry out in society as caretakers. Water scarcity affects this role in a significant way. Women and young girls primarily have the task of fetching water in developing countries [19]. In Africa, 90% of the wood gathering and water collection is done by women [20]. This was evidenced by [20,21] who estimated in their studies on women’s relation to development activities, that about six hours are spent fetching water by girls and women every day. Moreover, it was estimated by United Nations Educational, Scientific and Cultural Organization’s (UNESCO) World Water Assessment Programme (2015) that girls walk an average of 3.7 miles a day just to get water. When women and children have to spend most of their days providing water to their families and communities, they have to sacrifice a significant amount of time, which otherwise might be spent in income generating activities, caring for the family, going to school, or simply enjoying leisure time. Many studies have revealed a link between education and water scarcity [21,22]. One in four girls do not complete primary school compared to one in seven boys, and school enrollment rates have been shown to improve by over 15% when girls have clean water facilities, due to the fact that they no longer had to walk miles every day to fetch water [23].
As mentioned above, women are a key agent in obtaining water for their families and communities. However, they face significant challenges when it comes to accessing resources and participating in decision making within their communities when compared to men. Paradoxically, women have traditionally not been included in the decision-making process regarding water services despite being the “primary administrators”; neither in the implementation stages, nor in the planning of the projects. There are several studies that have shown how the exclusion of women from water projects, including the inability of planners to take their knowledge into account, explain the failure of many of the water resources management projects [24,25,26]. In addition, the UN shows how involving women can have a positive impact on the effectiveness of water-related projects, by improving that effectiveness up to six or seven times [20]. The link between the level of education of women and the effectiveness of water projects was shown in [27], where it is argued that women with a higher educational level participate to a greater extent in the implementation and continuity of the project; with their contributions being fundamental for their success.
Therefore, access to water is closely related to the role of women in communities. Consequently, it is essential to estimate the possible contribution of women to water access within our econometric models. Initially, we considered the Gender Inequality Index as part of the dependent variables; however insufficient observations for the years and countries made it impossible to use in the study. For this reason we have chosen the variable that includes the primary completion rate estimated by the World Bank (2015) and UNESCO’s Institute for Statistics’ official responses to its annual education survey. The primary completion rate, or gross intake ratio to the last grade of primary education, is calculated by the number of new entrants (enrollments minus repeaters) in the last grade of primary education, regardless of age, divided by the population in the age of entry for the last grade of primary education (World Bank Group, 2015). This indicator is being used more and more frequently, since it adequately reflects the performance of an education system, in this case, for women. However, it is true that it has limitations, such as the lack of an adjustment for students who drop out during the final year; therefore, it should be taken as an upper estimate of primary completion rate. In addition, it can sometimes exceed 100% because it occasionally includes late entrants.
In order to eliminate endogeneity between access to water and primary completion rate, we used the variable with a lag of one period. It is expected that there will be a high and positive relation between these two variables, since the higher education level of women often implies a greater capacity to influence water projects in their communities.
Although developed countries have prioritized commercial and industrial sectors, history shows that agriculture is one of the most important drivers of economic growth especially in the early stages of development, as it is a basic source of food, income and employment. In 2014, agriculture contributed approximately 33% of GDP in low income countries, 17% in lower middle income countries, and only 7.4% in upper middle income countries (World Bank Group, 2015). Therefore, especially for low income countries, agriculture is an important source of wealth. The relationship between the agricultural sector and access to water is straightforward, since water is a necessary resource for any type of plant, fruit, or vegetable to grow. In fact, the agricultural sector is the highest water consumption in the world. In consequence, compatibility between the use of water resources for agriculture and for human consumption is essential. In this paper we seek to estimate the relationship that could exist between agriculture and access to water resources for human consumption. We believe that the relation between agriculture and water access can be positive or negative. It can promote access to water sources in rural areas that live from agriculture but, as water sources are limited, agricultural pressure can reduce water for human consumption.
The “official level of development assistance” refers to subsidies (that do not have to be repaid) or loans (which do) to countries and territories on the Development Assistance Committee (DAC) list of beneficiaries for Official Development Assistance (ODA). The DAC is a committee from the Organisation for Economic Co-operation and Development (OECD) in charge of development and cooperation matters involving 29 member countries. The list of potential recipients, developed for statistical purposes, includes developing countries that may be eligible to receive Official Development Assistance. These grants and loans could be from countries that are part of the DAC, not from the DAC or from other multilateral agencies such as development banks (for example, the World Bank), United Nations agencies and regional groupings (for example, the European Union).
The data was obtained from Query Wizard for International Development Statistics (QWIDS), an online platform that allows easy access to OECD databases. Specifically, we use the disbursement (in millions $) that each of the countries included in our databases received as grants or loans from 1995 to 2015 for projects related to water and sanitation as a variable. This variable is expressed in 2014 constant million dollars so that the data is comparable over time and between countries. To take into account the size of the recipient country, it was considered appropriate for this variable to be included in relation to GDP. To reduce the problems of endogeneity, we use the variable with a delay of one period.
It seems logical that countries that receive a greater amount of funds should improve their capacity to improve water services’ access to its population. However, literature on the subject illustrates that there is no clear consensus on the effect of aid on improving access to water. Although the studies of [13,28] show a positive relationship between access to water and external financing, other authors such as [9,11] find the opposite. The reason for these disagreements may be for the use of different methodologies and approaches. In this paper, by including the ODA variables, we seek to provide more empirical evidence about the effect of foreign aid to improve access to water.
Although there are many definitions in the economic literature on the concept of governance, there is no consensus on one single definition. In general terms it can be understood as “rules, enforcement mechanisms, and organizations”, as defined by the World Bank. Therefore, it would affect both the freedom of citizens, infrastructure, and access to basic resources, among many other factors. As mentioned above, water is a key factor for human development, and therefore, should be high on the government’s list of priorities to provide safe water access to its citizens. There are several studies within the economic literature that link the problems of governability with access to water [8,17,29,30]. Our paper estimates this relationship in greater depth and aims to show the relationship between governance problems and access to water.
Due to the existence of multiple indicators of governance, it has been decided to choose as independent variables the Worldwide Governance Indicators (WGI), which are provided by the World Bank. Specifically, they are the following:
Rule of law (RL)—this indicator captures the perception that a country’s population has of compliance and respect for the rules, and in particular, on the quality of compliance with contracts, respect for property rights, police and courts, as well as the likelihood of suffering a crime or a violent act.
Voice and accountability (VA)—captures perceptions of the extent to which a country’s citizens are able to participate in selecting their government, as well as freedom of expression, freedom of association, and a free media.
Political stability and absence of violence/terrorism (PV)—captures perceptions of the likelihood that the government will be destabilized or overthrown by unconstitutional or violent means, including politically-motivated violence and terrorism.
Control of corruption (CC)—captures perceptions of the extent to which public power is exercised for private gain, including both petty and grand forms of corruption, as well as “capture” of the state by elites and private interests.
Government effectiveness (GE)—captures perceptions of the quality of public services; the quality of the civil service and the degree of its independence from political pressures; the quality of policy formulation and implementation; and the credibility of the government’s commitment to such policies.
Regulatory quality (RQ)—captures perceptions of the ability of the government to formulate and implement sound policies and regulations that permit and promote private sector development.
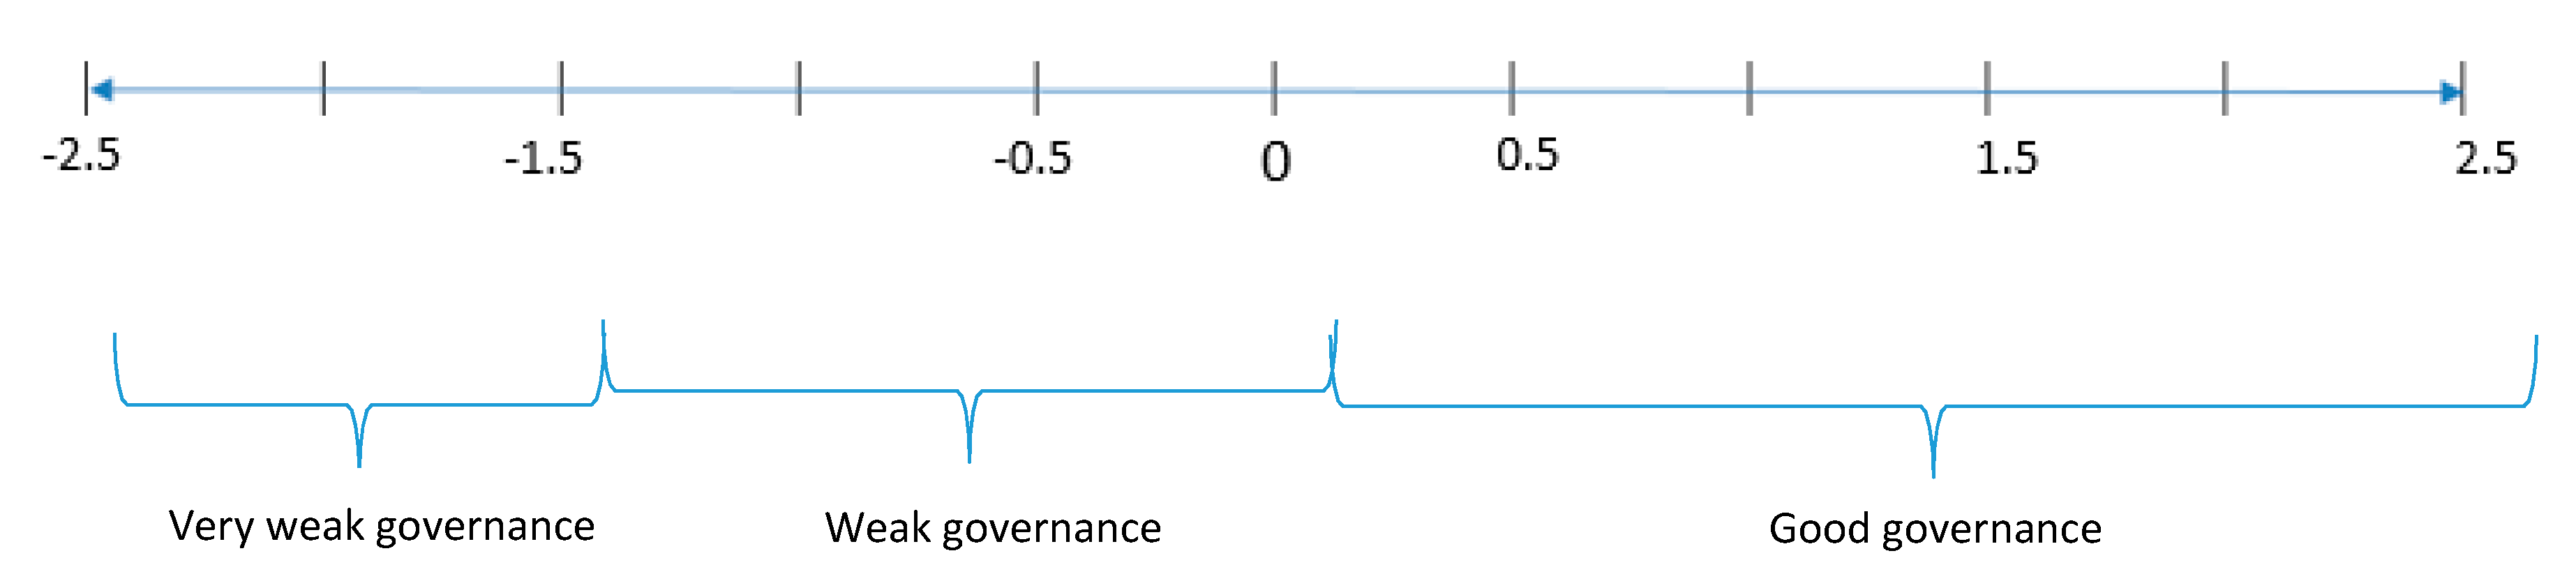
In order to create these data, the World Bank uses information from surveys to households and firms, commercial business information providers, from non-governmental organizations and from public sector organizations. Next, the World Bank constructs its six governance indicators from the data gathered. Therefore, this set of indicators is a good summary of information on the different points of view (citizens, entrepreneurs, experts in the public and private sector, NGOs from around the world) on the level of governance of the countries included in our database. These variables oscillate in a range that goes approximately between −2.5 and 2.5; −2.5 being very weak governance and 2.5 strong governance. These indicators allow comparisons between countries and over time, although the changes may not only be due to actual changes in governance but in the data sources [31]. Therefore, and despite the fact that the data also present limitations, it was the most reliable source of governance indicators found and that is why it was used in the study.
To make the interpretation of the variables simpler and more straightforward, a scale was developed that assigns ranges of estimates into a category. These were introduced into the database as dummy variables. Figure 2 shows the scale.
3. Results
Next, we will present the results of our estimations along with the underlying reasons for them. For simplicity, we will present the results of individual variables with respect to total improved, piped on premises, and other improved sources.
We checked for the possibility that there is autocorrelation and heteroskedasticity in our dataset. In the case of autocorrelation we implemented a Wooldridge test and the coefficient of this test (2817.586) confirmed the presence of autocorrelation. For heteroskedasticity we implemented a modified Wald test and the chi-squared value (1.2 × e33) rejected the null hypothesis of homokedasticity. Therefore, all our estimations presented in the following tables are robust to autocorrelation and heteroskedasticity.
3.1. Global Results
Table 2, Table 3 and Table 4 show the results for the global database. GNI variable has been found to be a significant variable explaining water access; though the relation they may hold depends on the source of water that is being analyzed. For piped on premises water sources, an increase of 1% in GNI increases access to piped water by 0.11%. On the other hand, an increase of 1% in GNI decreases access to other improved sources by 0.03%. That is, the population of richer countries is gaining more access to piped water sources while the population of poorer countries is accessing more precarious sources of water. These results were as expected, as richer countries are expected to have more economic resources and infrastructure to provide piped water to its population.
Results for women’s primary completion rate show that the higher the number of females entering the last course of primary school, the higher the expected access to water is. Taking into account all countries, for total improved and piped water, an increase of 1% in female primary completion rate increases access by 0.23% and 0.15%, respectively. The significance of this variable and its positive sign could be linked to the fact that, in rural areas, women, along with their daughters, are those fetching water, so they are more conscious of the water problem as they are the most affected by it. As a result, when women are educated, they can exert greater pressure in their communities to push for access to improved water sources. In addition, they may also value sending their daughters to school.
Agriculture is closely linked to access to improved water sources holding a negative relationship for all the countries analyzed. When the relative weight of agriculture on GDP increases by 1%, access to total improved sources and piped on premises sources decrease by 0.39% and 0.41% respectively. It is possible that since irrigation is intensive, farmers exert pressures to reallocate resources to irrigation instead of household consumption, or simply because agriculture is taking up most water resources.
Rural population growth is only significant for the case of total improved access. Results show that an increase in rural population has a negative impact on access to total improved water sources. Nevertheless, this result includes countries from the whole database, across which rural access differs greatly, and therefore the effect of rural population growth may be somewhat influenced by this fact. Bearing this in mind it is possible that lower income countries have a higher percentage of disperse rural population so an increase in the population living in rural areas will make it more difficult to provide water access to them. On the contrary, in higher income countries, there is a lower percentage of rural population and rural population tend to be more concentrated so access is not expected to decrease—but to increase—as it might be easier to provide access to a new population.
Results for governance indicators show that, for the global data, countries with a lower rule of law, voice, accountability, and stability have lower access to improved sources. That is, countries with a poor rule of law have between 1 and 3 points lower access to improved water. Poor voice and accountability implies an access to improved water between 0.6 and 2 points lower. Instability implies that access to improved water is about 0.4 up to 1.6 points lower. Results for other indicators are insufficiently robust to show a direct relationship with improved water access. For piped on premises, countries with very weak voice and accountability, stability, and effectiveness have lower access to pipes from 0.5 to 9.9 points. In addition, countries with weak regulatory regimes have an access to piped water that is between 1.8 and 2.5 points lower than countries with good regulatory regimes. Finally, for access to water from other improved sources, countries with a poor rule of law, voice, accountability, and stability have lower access. On the contrary, countries with weak regulatory regimes have greater access to this type of source than countries with good regulatory regimes. This could be due to the fact that entrepreneurs in water services face less strong regulations in those countries facilitating the implementation of different solutions like communal organizations [25] or the creation of networks from privately-owned wells.
Surprisingly, the results for the variable related to official development for sanitation and water show a significant and negative relationship with regard to access to pipes. One possible explanation for this result could be that the aid granted to poorer countries is linked to projects aimed at easing access through public taps or communal services, so countries have to use part of their own resources to construct these infrastructures instead of constructing the infrastructure needed for piped water inside homes.
3.2. Results for Middle-High Income Economies
Table 5 shows the result for middle-high income economies. In this case, as the countries are richer, access to improved water is high, so the results for the log (GNI) are not significant.
In addition, there is near universal female access to the last year of primary education in those countries (96% mean for all the period), so our results do not show any relationship with water access.
Agriculture holds a positive relationship with piped water and other improved. That is, as agriculture increases in importance, it becomes a key actor in pushing for improved water sources in rural areas. Also, the more industrialized the country is the lower the importance of agriculture in their economies is, and they probably have more advanced irrigation techniques to save water resources as well as more resources to extend pipes for agriculture and household consumption purposes.
This result is confirmed by the fact that an increase in rural population increases access to piped sources. In addition, an increase in the rural population means a greater demand for piped water instead of other improved. That is, the larger the rural population in middle-high income areas, the greater the pressure for governments to increase piped water in those areas.
In the case of governance indicators, results show that countries with a very weak voice and poor accountability negatively affects access to total improved and other improved water sources. Surprisingly, results for the regulatory variable show a positive and significant coefficient for other improved sources. That is, countries with lower regulatory regimes tend to facilitate access to water sources not only by pipes but also by other private means. Results for stability are mixed, it seems that weak stability increases access to total improved water sources but, at the same time, it has no impact on piped water, and has a negative and significant impact on other improved sources. So, results for stability are not robust.
Our results show that receiving aid does not affect the total population accessing improved water sources.
3.3. Results for Middle-Low income Economies
Table 6 shows the result for middle-low income economies. Results for the variable GNI are as expected. For piped on premises water source, an increase of 1% in GNI increases access by 0.022%. For total improved water access sources, an increase of 1% in GNI increases access by 0.021%.
For middle-low income countries, results show that if more females enter the last year of primary school, the expected access for all sources of water increases. A 1% increase in female primary completion rate translates into an increase of 0.12% for total improved water, 0.03% for piped water, and 0.05% for other improved sources. This result may be due to the fact that women push in their communities for easier access to water infrastructures instead of other type of infrastructures. In this regard, the higher the level of education of women, the greater the possibility for them to influence their communities.
Agriculture holds a negative relationship with total improved and other improved sources. For total improved, an increase of 1% of agriculture value added represents a 0.51% decrease in improved access. For other improved water sources, the decrease is about 0.12%. This result may be explained by the fact that agriculture is pushing to get water resources for irrigation instead of household consumption, or simply because agriculture is taking up most water resources.
In the case of governance indicators, results show that weak effectiveness of governments implies lesser access through pipes; between 1.1 and 2.9 points lower. In addition, countries with a very weak voice and poor accountability have an access to total improved sources 9.4 points lower than countries with a good voice. On the other hand, countries with low regulatory quality have more access to total improved water sources.
No relationship is found between development aid and access to water for middle-low income countries.
3.4. Results for Low Income Economies
Finally, Table 7 shows the result for low income economies. GNI is a significant variable explaining access to water access in these countries. For piped on premises, an increase of 1% in if GNI increases access to piped water by 0.006%. However, for total improved water access sources the increase is up to 0.023%.
Our results show that if more females enter the last course of primary school, the expected access for all sources of water increases. A 1% increase in female primary completion rate translates into an increase of 0.10% for total improved sources, 0.02% for piped water and 0.08% of other improved sources.
Agriculture holds a negative relationship with all three sources. For total improved, an increase of 1% of agriculture value added represents 0a decrease of improved access in 0.24%. For piped water the decrease is about 0.03% and 0.15% for other improved sources.
In the case of governance indicators, results do not show robust relationships.
4. Conclusions
Water is essential for human life and the development of societies. Inadequate access to it has negative effects on health, which impact negatively on productivity and human welfare. However, nowadays 2.1 billion people still lack access to safe drinking water at home; mainly in the rural areas of developing countries. When we take into account piped water on premises, the scenario is worse. Substantial effort has been made to improve water access, but there is still space for improvement. The socioeconomic characteristics of countries might affect the improvement of water access. Identification of these factors may help to better address the problems. The main objective of this paper is to provide insights on the socioeconomic factors that are determinants for increasing water access in rural areas. In contrast with previous studies, we find that socioeconomic factors analyzed have a link with water access. GNI, the primary completion rate for women, the percentage of added value that agriculture contributes to GDP, and population growth in rural areas were found to be determinants for water access in rural zones; and therefore, variables that should be considered when evaluating access in a country. Poorer countries have access to water from precarious sources while richer countries have access to water from pipes. It is important to note that women’s education is determinant for increasing water access and therefore their empowerment may be directly related to improving access, especially in lower-middle and low income countries. Although agriculture is an essential part of least developed countries economies, it has a negative impact on water access for middle-low and low income countries. The lack of association between official development assistance for water and sanitation and water access is consistent with previous studies [8,9,11]. This reinforces the idea that investment on its own is insufficient to improve water access. These correlations may allow policy makers to understand better the drivers for water access, so they might make better evidence-based decisions in future.
Author Contributions
M.G. undertook the literature review and wrote the introduction to this paper. She was also in charge of creating the database used in the paper, and of performing the first econometric estimations. J.P. was mainly involved, together with A.S., in the implementation of the empirical methodology, interpreting the econometric results, and extracting the main conclusions. A.S. reviewed the introductory part, and together with J.P., developed the empirical strategy, as well as the analysis of the econometric results and the conclusions derived from them.
Funding
This research received no external funding.
Acknowledgments
This research did not receive any specific grant from funding agencies in the public, commercial or not-for-profit sectors. We are especially grateful to Joan Calzada.
Conflicts of Interest
The authors declare no conflict of interest.
Appendix A

Table A1.
List of low income economies ($1045 or less).
| Afghanistan | Gambia, The | Niger |
| Benin | Guinea | Rwanda |
| Burkina Faso | Guinea-Bisau | Sierra Leone |
| Burundi | Haiti | Somalia |
| Cambodia | Korea, Dem People’s Rep | South Sudan |
| Central African Republic | Liberia | Tanzania |
| Chad | Madagascar | Togo |
| Comoros | Malawi | Uganda |
| Congo, Dem. Rep | Mali | Zimbabwe |
| Eritrea | Mozambique | |
| Ethiopia | Nepal |
Source: World Bank Group, 2015.
Table A2.
List of lower-middle economies ($1046 to $4125).
| Armenia | Indonesia | Samoa |
| Bangladesh | Kenya | Sao Tomé and Principe |
| Bhutan | Kiribati | Senegal |
| Bolovia | Kosovo | Solomon Islands |
| Cabo Verde | Kyrgyz Republic | Sri Lanka |
| Cameroon | Lao PDR | Sudan |
| Congo Rep. | Lesotho | Swaziland |
| Côte d’Ivoire | Mauritania | Syrian Arab Republic |
| Djibouti | Micronesia, Fed. Sts. | Tajikistan |
| Egypt, Arab Rep. | Moldova | Timor-Leste |
| El Salvador | Morocco | Ukraine |
| Georgia | Myanmar | Uzbekistan |
| Ghana | Nicaragua | Vanuatu |
| Guatemala | Nigeria | Vietnam |
| Guyana | Pakistan | West Bank and Gaza |
| Honduras | Papua New Guinea | Yemen, Rep. |
| India | Philippines |
Source: World Bank Group, 2015.
Table A3.
List of high-middle economies ($4126 to $12,735$).
| Albania | Fiji | Namibia |
| Algeria | Gabon | Palau |
| American Samoa | Grenada | Panama |
| Angola | Iran, Islamic Rep. | Paraguay |
| Azerbaijan | Iraq | Peru |
| Belarus | Jamaica | Romania |
| Belize | Jordan | Serbia |
| Bosnia and Herzegovina | Kazakhstan | South Africa |
| Botswana | Lebanon | St. Lucia |
| Brazil | Libya | St. Vincent and the Grenadines |
| Bulgaria | Macedonia, FYR | Suriname |
| China | Malaysia | Thailand |
| Colombia | Maldives | Tonga |
| Costa Rica | Marshall Islands | Tunisia |
| Cuba | Mauritius | Turkey |
| Dominica | Mexico | Turkmenistan |
| Dominican Republic | Mongolia | Tuvalu |
| Ecuador | Montenegro |
Source: World Bank Group, 2015.
Table A4.
Results of Wald test for middle-high income countries.
| Total Improved Access | Piped Access | Other Improved Access | |
|---|---|---|---|
| Rule of law | 3.47 * (0.0624) | 6.43 ** (0.0112) | 0.00 (0.9789) |
| Voice and accountability | 12.90 *** (0.0016) | 7.39 ** (0.0249) | 5.89 * (0.0526) |
| Political stability | 14.82 *** (0.0006) | 0.80 (0.6697) | 4.11 (0.1280) |
| Control of corruption | 1.40 (0.2359) | 0.96 (0.3277) | 1.62 (0.2034) |
| Government effectiveness | 1.46 (0.4819) | 1.36 (0.2444) | 2.72 (0.2567) |
| Regulatory quality | 0.39 (0.8245) | 2.21 (0.3307) | 15.46 *** (0.0004) |
Standard errors in brackets. (***) 1%, (**) 5%, (*) 10%.
Table A5.
Results of Wald test for middle-low income countries.
| Total Improved Access | Piped Access | Other Improved Access | |
|---|---|---|---|
| Rule of law | 5.21 * (0.0738) | 1.07 (0.5853) | 3.16 (0.2064) |
| Voice and accountability | 19.10 *** (0.0001) | 3.07 (0.2158) | 2.58 (0.2753) |
| Political stability | 4.28 (0.1178) | 1.34 (0.5106) | 0.29 (0.8658) |
| Control of corruption | 0.01 (0.9309) | 0.75 (0.3851) | 0.01 (0.9432) |
| Government effectiveness | 1.81 (0.4053) | 12.04 *** (0.0024) | 1.22 (0.5432) |
| Regulatory quality | 16.16 *** (0.0003) | 2.83 (0.2426) | 0.45 (0.7977) |
Standard errors in brackets. (***) 1%, (**) 5%, (*) 10%.
Table A6.
Results of Wald test for low income countries.
| Total improved Access | Piped Access | Other Improved Access | |
|---|---|---|---|
| Rule of law | 0.01 (0.9964) | 5.00 * (0.0821) | 0.28 (0.8707) |
| Voice and accountability | 0.85 (0.6546) | 12.69 *** (0.0018) | 2.95 (0.2287) |
| Political stability | 1.08 (0.5814) | 2.22 (0.3296) | 0.69 (0.7084) |
| Control of corruption | 2.64 (0.1040) | 0.00 (0.9774) | 0.01 (0.9344) |
| Government effectiveness | 2.66 (0.2648) | 6.10 ** (0.0473) | 2.80 (0.2471) |
| Regulatory quality | 7.64 ** (0.0220) | 7.39 ** (0.0249) | 0.23 (0.8922) |
Standard errors in brackets. (***) 1%, (**) 5%, (*) 10%.
References
- WHO. Drinking Water Fact Sheet. 2018. Available online: https://www.who.int/news-room/fact-sheets/detail/drinking-water (accessed on 9 December 2018).
- WHO; UNICEF. Progress on Drinking Water, Sanitation and Hygiene: 2017 Update and SDG Baselines; World Health Organization: Geneva, Switzerland, 2017; Available online: https://www.unicef.org/publications/index_96611.html (accessed on 9 December 2018).
- UNDP. The Millennium Development Goals Report 2015; United Nations: New York, NY, USA, 2015; Available online: http://www.un.org/millenniumgoals/2015_MDG_Report/pdf/MDG%202015%20rev%20(July%201).pdf (accessed on 9 May 2016).
- UNDP. Support to the Implementation of Sustainable Development. Goal 6. Sustainable Management of Water and Sanitation; United Nations: New York, NY, USA, 2016. [Google Scholar]
- Alcamo, J.; Henrichs, T.; Rösch, T. World Water in 2025: Global Modeling and Scenario Analysis for the World Commission on Water for the 21st Century; Report A0002; Center for Environmental Systems Research, University of Kassel: Kassel, Germany, 2000. [Google Scholar]
- Munamati, M.; Nhapi, I.; Misi, S. Exploring the determinants of sanitation success in Sub-Saharan Africa. Water Res. 2016, 103, 435–443. [Google Scholar] [CrossRef] [PubMed]
- Luo, Q.; Zhang, M.; Yao, W.; Fu, Y.; Wei, H.; Tao, Y.; Liu, J.; Yao, H. A spatio-temporal pattern and socio-economic factors analysis of improved sanitation in China, 2006–2015. Int. J. Environ. Res. Publ. Health 2018, 15, 2510. [Google Scholar] [CrossRef] [PubMed]
- Luha, J.; Bartrama, J. Drinking water and sanitation: Progress in 73 countries in relation to socioeconomic indicators. Bull. World Health Organ. 2015, 94, 111–121. [Google Scholar] [CrossRef] [PubMed]
- Hopewell, M.R.; Graham, J.P. Trends in access to water supply and sanitation in 31 major Sub-Saharan African cities: an analysis of DHS data from 2000 to 2012. BMC Publ. Health 2014, 14, 208. [Google Scholar] [CrossRef] [PubMed]
- Onda, K.; Crocker, J.; Kayser, G.L.; Bartram, J. Country clustering applied to the water and sanitation sector: A new tool with potential applications in research and policy. Int. J. Hyg. Environ. Health 2014, 217, 379–385. [Google Scholar] [CrossRef] [PubMed] [Green Version]
- Bain, R.; Luyendijk, R.; Bartram, J. Universal access to drinking water: The role of aid. In WIDER Working Papers; No. 2013/088; World Institute for Development Economics Research (UNU-WIDER), United Nations University: Tokyo, Japan, 2013. [Google Scholar]
- Ndikumana, L.; Pickbourn, L. The Impact of Foreign Aid Allocation on Access to Social Services in Sub-Saharan Africa: The Case of Water and Sanitation; Political Economy Research Institute, University of Massachusetts Amherst: Amherst, MA, USA, 2015. [Google Scholar]
- Wayland, J. A Drop in the Bucket? The Effectiveness of Foreign Aid in the Water, Sanitation, and Hygiene (WASH) Sector; American University: Washington, DC, USA, 2014. [Google Scholar]
- Adams, E.A.; Boateng, G.O.; Amoyaw, J.A. Socioeconomic and demographic predictors of potable water and sanitation access in Ghana. Soc. Indic. Res. 2016, 126, 673–687. [Google Scholar] [CrossRef]
- Koskei, E.C.; Koskei, R.C.; Koske, M.C.; Koech, H.K. Effect of Socio-economic Factors on Access to Improved Water Sources and Basic Sanitation in Bomet Municipality, Kenya. Res. J. Environ. Earth Sci. 2013, 5, 714–719. [Google Scholar]
- Mulenga, J.N.; Bwalya, B.B.; Kaliba-Chishimba, K. Determinants and inequalities in access to improved water sources and sanitation among the Zambian households. Int. J. Dev. Sustain. 2017, 6, 746–762. [Google Scholar]
- Dondeynaz, C.; Carmona Moreno, C.; Céspedes Lorente, J. Analysing inter- relationships among water, governance, human development variables in developing countries. Hydrol. Earth Syst. Sci. 2012, 16, 3791–3816. [Google Scholar] [CrossRef]
- Wooldridge, J. Introductory Econometrics: A Modern Approach; Nelson Education: Scarborough, ON, Canada, 2015. [Google Scholar]
- Webbink, E.; Smits, J.; de Jong, E. Household and context determinants of child labor in 221 districts of 18 developing countries. Soc. Indic. Res. 2013, 110, 819–836. [Google Scholar] [CrossRef] [PubMed]
- UN Water. UN-Water Factsheet on Water and Gender, World Water Day 2013; UN Water: Geneva, Switzerland, 2013. [Google Scholar]
- Demie, G.; Bekele, M.; Seyoum, B. Water accessibility impact on girl and women’s participation in education and other development activities: The case of Wuchale and Jidda Woreda, Ethiopia. Environ. Syst. Res. 2016, 5, 1–12. [Google Scholar] [CrossRef]
- Kookana, R.S.; Maheshwari, B.; Dillon, P.; Dave, S.H.; Soni, P.; Bohra, H.; Katara, P. Groundwater scarcity impact on inclusiveness and women empowerment: Insights from school absenteeism of female students in two watersheds in India. Int. J. Incl. Educ. 2016, 20, 1155–1171. [Google Scholar] [CrossRef]
- World Water Assessment Programme; UNESCO. Water for Women: Every Woman Counts. Every Second Counts; Stockholm International Water Institute: Stockholm, Sweden, 2015. [Google Scholar]
- Ray, I. Women, water, and development. Annu. Rev. Environ. Resour. 2007, 32, 421–449. [Google Scholar] [CrossRef]
- Calzada, J.; Iranzo, S.; Sanz, A. Community-Managed Water Services: The Case of Peru. J. Environ. Dev. 2017, 26, 400–428. [Google Scholar] [CrossRef] [Green Version]
- Figueiredo, P.; Perkins, P.E. Women and water management in times of climate change: Participatory and inclusive processes. J. Clean. Prod. 2013, 60, 188–194. [Google Scholar] [CrossRef]
- Mensah, M. Women’s Participation in Rural Water Projects: The Case of Kwaebibirem District in the Eastern Region of Ghana. Ph.D. Thesis, University of Ghana, Accra, Ghana, 2015. [Google Scholar]
- Botting, M.J.; Porbeni, E.O.; Joffres, M.R.; Johnston, B.C.; Black, R.E.; Mills, E.J. Water and sanitation infrastructure for health: The impact of foreign aid. Glob. Health 2010, 6, 12. [Google Scholar] [CrossRef] [PubMed] [Green Version]
- Davis, J. Corruption in public service delivery: Experience from South Asia’s water and sanitation sector. World Dev. 2004, 32, 53–71. [Google Scholar] [CrossRef]
- Biswas, A.K.; Tortajada, C. Future water governance: Problems and perspectives. Water Resour. Dev. 2010, 26, 129–139. [Google Scholar] [CrossRef]
- Kaufmann, D.; Kraay, A.; Mastruzzi, M. The worldwide governance indicators: Methodology and analytical issues. Hague J. Rule Law 2011, 3, 220–246. [Google Scholar] [CrossRef]
Figure 1.
Proportion of the population using improved drinking water sources in 2015. Source: The World Health Organization (WHO) and UNICEF, 2015 [4].
Figure 1.
Proportion of the population using improved drinking water sources in 2015. Source: The World Health Organization (WHO) and UNICEF, 2015 [4].

Figure 2.
Scale for governance variables; Source: Own elaboration.

Table 1.
Explanatory variables used in the regression.
| Global Database | Middle-High Income | Middle-low Income | Low Income | |
|---|---|---|---|---|
| GNI per capita | $2093.49 (2192,47) | $3889.46 (2420.69) | $1248.49 (886,35) | $374.94 (196.12) |
| Primary completion rate, female | 76.67% (28.02) | 96.14% (13.16) | 78.48% (22.50) | 43.41% (22.36) |
| Agriculture (%GDP) | 21.14% (13.46) | 11.40% (7.16) | 23.00% (10.88) | 36.76% (10.85) |
| Official level of development assistance (% GDP) | 0.018% (0.038) | 0.005% (0.014) | 0.019% (0.036) | 0.035% (0.055) |
| Rural population growth | 0.91 (1.60) | 0.10 (1.51) | 1.11 (1.20) | 1.97 (1.59) |
| Six governance indicators | ||||
| Rule of Law | −0.55 (0.58) | −0.24 (0.66) | −0.59 (0.56) | −1.01 (0.56) |
| Voice and accountability | −0.43 (0.83) | −0.11 (0.87) | −0.48 (0.75) | −0.91 (0.62) |
| Political Stability | −0.44 (0.93) | −0.07 (0.83) | −0.53 (0.90) | −0.91 (0.90) |
| Control of corruption | −0.54 (0.58) | −0.28 (0.59) | −0.60 (0.49) | −0.87 (0.47) |
| Government effectiveness | −0.56 (0.61) | −0.23 (0.60) | −0.58 (0.44) | −1.07 (0.52) |
| Regulatory quality | −0.53 (0.69) | −0.22 (0.71) | −0.59 (0.51) | −0.98 (0.64) |
Table 2.
Socioeconomic indicators. Global data. Total improved sources.
| Total Improved | Total Improved | Total Improved | |
|---|---|---|---|
| LogGNI | 10.583 *** (0.425) | ||
| Female | 0.234 *** (0.020) | ||
| Agriculture | −0.391 *** (0.026) | ||
| Rural Growth | −0.614 *** (0.162) | −1.351 *** (0.230) | −0.017 (0.116) |
| Development Aid | 0.846 (1.472) | -1.773 (1.591) | −1.887 (1.469) |
| Weak Rule | −2.272 *** (0.312) | −1.637 *** (0.614) | −1.078 *** (0.358) |
| Very weak Rule | −2.276 *** (0.484) | −2.978 ** (1.230) | −0.170 (0.597) |
| Weak Voice | −0.631 ** (0.270) | −2.024 *** (0.357) | −0.982 *** (0.222) |
| Very weak Voice | −0.806 (0.625) | −2.720 *** (0.877) | −0.903 * (0.508) |
| Weak Stability | −0.621 *** (0.216) | −0.838 *** (0.304) | −0.381 ** (0.175) |
| Very weak Stability | −0.687 ** (0.323) | −1.632 *** (0.464) | 0.087 (0.290) |
| Weak Corruption | −0.080 (0.309) | −0.575 (0.463) | −0.350 (0.282) |
| Very weak Corruption | −0.362 (0.899) | 6.178 *** (2.166) | 0.172 (0.835) |
| Weak Effectiveness | −0.074 (0.280) | 0.147 (0.423) | 0.065 (0.195) |
| Very weak Effectiveness | −1.562 *** (0.554) | −1.234 (1.520) | −0.069 (0.902) |
| Weak Regulatory | 1.330 *** (0.367) | 0.648 (0.417) | 0.043 (0.260) |
| Very weak Regulatory | 0.716 (0.637) | 1.710 ** (0.660) | −0.511 (0.484) |
| N | 1713 | 1087 | 1593 |
Robust standard errors to heterokedasticity and autocorrelation in brackets. (***) 1%, (**) 5%, (*) 10%.
Table 3.
Socioeconomic indicators. Global Data. Piped water sources.
| Piped | Piped | Piped | |
|---|---|---|---|
| LogGNI | 11.034 *** (0.563) | ||
| Female | 0.154 *** (0.024) | ||
| Agriculture | −0.409 *** (0.032) | ||
| Rural Growth | −0.260 * (0.152) | −0.266 (0.415) | 0.931 *** (0.170) |
| Development Aid | −2.654 * (1.289) | −8.421 ** (3.703) | −6.519 *** (1.798) |
| Weak Rule | 0.356 (0.293) | −1.296 * (0.707) | 0.352 (0.374) |
| Very weak Rule | 0.459 (0.568) | −3.932 ** (1.611) | 1.060 (0.680) |
| Weak Voice | 0.451 (0.283) | −2.429 *** (0.591) | −0.780 ** (0.328) |
| Very weak Voice | 0.727 (0.602) | −3.397 ** (1.402) | 0.048 (0.753) |
| Weak Stability | 0.377 * (0.202) | 0.274 (0.370) | −0.034 (0.220) |
| Very weak Stability | 0.247 (0.340) | −1.160 ** (0.520) | −0.537 * (0.322) |
| Weak Corruption | −0.079 (0.279) | −1.516 * (0.816) | −0.277 (0.367) |
| Very weak Corruption | 0.315 (0.723) | −4.589 (4.899) | −0.642 (1.092) |
| Weak Effectiveness | −0.014 (0.264) | −1.091 (1.278) | 0.322 (0.373) |
| Very weak Effectiveness | −1.438 ** (0.588) | −9.874 *** (2.494) | −1.045 (0.813) |
| Weak Regulatory | 0.126 (0.362) | −2.252 *** (0.834) | −1.809 *** (0.564) |
| Very weak Regulatory | 0.254 (0.642) | −1.930 (1.368) | −1.469 * (0.778) |
| N | 1691 | 1076 | 1573 |
Robust Standard errors to heterokedasticity and autocorrelation in brackets. (***) 1%, (**) 5%, (*) 10%.
Table 4.
Socioeconomic indicators. Global Data. Other improved sources.
| Other Improved | Other Improved | Other Improved | |
|---|---|---|---|
| LogGNI | −2.975 *** (0.454) | ||
| Female | 0.018 (0.023) | ||
| Agriculture | −0.023 (0.033) | ||
| Rural Growth | −0.062 (0.151) | −0.300 (0.509) | −0.206 (0.176) |
| Development Aid | 0.619 (1.428) | −1.230 (2.860) | 5.828 *** (2.172) |
| Weak Rule | −2.142 *** (0.472) | −0.385 (0.708) | −2.535 *** (0.611) |
| Very weak Rule | −1.978 *** (0.558) | −2.409 ** (1.219) | −2.306 *** (0.695) |
| Weak Voice | −1.079 *** (0.331) | 0.554 (0.424) | −0.720 * (0.380) |
| Very weak Voice | −1.750 *** (0.573) | −0.003 (1.058) | −2.080 *** (0.795) |
| Weak Stability | −0.864 *** (0.302) | −0.459 (0.373) | −0.797 *** (0.291) |
| Very weak Stability | −1.043 *** (0.379) | −0.906 * (0.500) | −0.649 * (0.388) |
| Weak Corruption | −0.018 (0.417) | 1.108 * (0.671) | −0.249 (0.475) |
| Very weak Corruption | 0.486 (0.818) | −2.055 (2.659) | 0.026 (1.354) |
| Weak Effectiveness | −0.515 (0.423) | 1.209 (1.032) | −0.488 (0.500) |
| Very weak Effectiveness | −0.608 (0.655) | 2.203 (2.062) | 0.349 (1.179) |
| Weak Regulatory | 2.017 *** (0.635) | 2.943 *** (0.915) | 3.368 *** (0.763) |
| Very weak Regulatory | 1.052 (0.848) | 1.979 (1.295) | 2.646 *** (0.989) |
| N | 1697 | 1083 | 1577 |
Robust Standard errors to heterokedasticity and autocorrelation in brackets. (***) 1%, (**) 5%, (*) 10%.
Table 5.
Socioeconomic indicators. Middle-high income countries.
| Total Improved | Piped | Other Improved | |
|---|---|---|---|
| LogGNI | −1.174 (0.933) | 1.758 (1.528) | −2.154 (1.617) |
| Female | −0.012 (0.011) | 0.023 (0.017) | −0.023 (0.032) |
| Agriculture | 0.096 (0.080) | 0.574 *** (0.175) | 0.521 * (0.277) |
| Rural Growth | 0.332 ** (0.148) | 0.267 (0.236) | −0.646 ** (0.284) |
| Development Aid | 6.951 (17.375) | −12.302 (22.174) | −12.853 (29.625) |
| Weak Rule | −0.977 ** (0.490) | −1.707 *** (0.658) | |
| Weak Voice | −0.153 (0.449) | 2.089 ** (0.894) | −2.437 ** (1.058) |
| Very weak Voice | −3.415 *** (0.861) | −0.296 (0.894) | −6.866 ** (2.871) |
| Weak Stability | 0.579 * (0.349) | −1.578 * (0.957) | |
| Very weak Stability | 3.083 *** (0.738) | 0.773 (1.726) | |
| Weak Regulatory | 3.955 *** (1.074) | ||
| Very weak Regulatory | 4.028 ** (1.567) | ||
| N | 351 | 343 | 347 |
Robust Standard errors to heterokedasticity and autocorrelation in brackets. (***) 1%, (**) 5%, (*) 10%.
Table 6.
Socioeconomic indicators. Middle-low income countries.
| Total Improved | Piped | Other Improved | |
|---|---|---|---|
| LogGNI | 2.094 ** (1.056) | 2.157 * (1.113) | 0.489 (1.062) |
| Female | 0.118 *** (0.018) | 0.030 * (0.017) | 0.052 *** (0.018) |
| Agriculture | −0.515 *** (0.064) | 0.042 (0.046) | −0.122 ** (0.050) |
| Rural Growth | 1.126 *** (0.289) | −0.523 * (0.297) | −0.017 (0.208) |
| Development Aid | 0.368 (4.370) | −5.379 (3.903) | 0.242 (3.162) |
| Weak Rule | −0.424 (0.498) | ||
| Very weak Rule | 1.416 (1.461) | ||
| Weak Voice | −0.090 (0.415) | ||
| Very weak Voice | −9.386 *** (2.059) | ||
| Weak Effectiveness | −1.123 ** (.567) | ||
| Very weak Effectiveness | −2.863 *** (0.750) | ||
| Weak Regulatory | 1.639 *** | ||
Very weak Regulatory | (0.504) −2.701 (2.160) | ||
| N | 408 | 408 | 458 |
Robust Standard errors to heterokedasticity and autocorrelation in brackets. (***) 1%, (**) 5%, (*) 10%.
Table 7.
Socioeconomic indicators. Low income countries.
| Total Improved | Piped | Other Improved | |
|---|---|---|---|
| LogGNI | 2.318 ** (1.180) | 0.622 *** (0.141) | 0.620 (1.008) |
| Female | 0.104 *** (0.030) | 0.021 *** (0.004) | 0.082 *** (0.026) |
| Agriculture | −0.240 *** (0.037) | −0.032 *** (0.005) | −0.153 *** (0.031) |
| Rural Growth | −0.055 (0.469) | −0.306 *** (0.065) | 0.011 (0.250) |
| Development Aid | −0.683 (1.970) | −0.595 * (0.311) | 0.422 (1.582) |
| Weak Rule | 0.125 (0.240) | ||
| Very weak Rule | 0.325 (0.258) | ||
| Weak Voice | −0.174 (0.133) | ||
| Very weak Voice | 0.313 (0.196) | ||
| Weak Corruption | 0.402 (0.626) | ||
| Weak Effectiveness | 0.486 ** (0.199) | ||
| Very Weak Effectiveness | 0.338 (0.240) | ||
| Weak Regulatory | 1.065 | 0.100 | |
Very weak Regulatory | (2.192) 0.024 (2.289) | (0.120) −0.636 ** (0.305) | |
| N | 262 | 260 | 294 |
Robust Standard errors to heterokedasticity and autocorrelation in brackets. (***) 1%, (**) 5%, (*) 10%.
© 2019 by the authors. Licensee MDPI, Basel, Switzerland. This article is an open access article distributed under the terms and conditions of the Creative Commons Attribution (CC BY) license (http://creativecommons.org/licenses/by/4.0/).
Share and Cite
MDPI and ACS Style
Gomez, M.; Perdiguero, J.; Sanz, A. Socioeconomic Factors Affecting Water Access in Rural Areas of Low and Middle Income Countries. Water 2019, 11, 202. https://doi.org/10.3390/w11020202
AMA Style
Gomez M, Perdiguero J, Sanz A. Socioeconomic Factors Affecting Water Access in Rural Areas of Low and Middle Income Countries. Water. 2019; 11(2):202. https://doi.org/10.3390/w11020202
Chicago/Turabian StyleGomez, Mabel, Jordi Perdiguero, and Alex Sanz. 2019. "Socioeconomic Factors Affecting Water Access in Rural Areas of Low and Middle Income Countries" Water 11, no. 2: 202. https://doi.org/10.3390/w11020202
Note that from the first issue of 2016, this journal uses article numbers instead of page numbers. See further details here.