Effects of Ionic Components of Saline Water on Irrigated Sunflower Physiology


1
Shapotou Desert Research and Experimental Station, Northwest Institute of Eco-Environment and Resources, Chinese Academy of Sciences, Lanzhou 730000, China
2
University of Chinese Academy of Sciences, Beijing 100049, China
3
Plant Protection and Quarantine Station of Gansu Province, Lanzhou 730020, China
*
Author to whom correspondence should be addressed.
Water 2019, 11(2), 183; https://doi.org/10.3390/w11020183
Submission received: 5 December 2018
/
Revised: 31 December 2018
/
Accepted: 18 January 2019
/
Published: 22 January 2019
(This article belongs to the Section Water Use and Scarcity)
Abstract
:The characteristics of ions in saline water can be significantly different along the water salinity gradient. The physiologic processes of plants that are irrigated with this kind of water are remarkably influenced. Based on the field sampling data, the chemical components of irrigation water were studied, and their influence on sunflower nutrient uptake, water content, and dry weight were evaluated. The results demonstrated that irrigation water salinity was mainly controlled by Na, SO4, Mg, and Cl concentrations and the ionic characteristics changed as soon as water becomes saline. The concentrations of Na, Ca, Mg, and N in sunflower leaves changed slightly with increasing irrigation salinity, whereas the concentration of leaf C decreased steadily. The ions in irrigation water had significantly different effects on leaf nutrient uptake. The Ca and Cl concentrations in irrigation water significantly influenced the Ca-related ionic exchange and C- and N-assimilation processes in sunflower leaves. The water content in the stem rose positively with irrigation salinity, whereas we observed little response in the leaves, fruits, and roots, although they were all mainly affected by the concentrations of Ca, Cl, Na, NO3, and SO4 in irrigation water. The biomass in leaves, stems, flower discs, and seeds all significantly reduced with irrigation salinity increase, and a loss of about 25% in stem biomass was detected. The concentrations of Na, Ca, Mg, K, Cl, and SO4 in irrigation water influenced the dry weight of different organs. The results presented here demonstrate that the ionic effects of irrigation water on plant physiologic processes are complex, which is concerning in terms of improving plant salt tolerance and managing saline water resources.
1. Introduction
The worldwide freshwater shortage and the need for agricultural irrigation have motivated farmers to explore new water resources while compromising water quality. Therefore, saline water irrigation has become a well-established practice in both industrialized and developing countries [1]. However, the types of saline water vary with region and location. The chemical composition of saline water differs throughout the world [2]. Even under the same salinity levels, different ionic components are usually found. As such, the chemical interactions between the active components (e.g., Na, Ca, Mg, Cl and SO4) in saline water might change significantly, which affect the performance of plants that are irrigated. Thus, we need to understand the influence of the chemical composition of saline water on irrigated plant physiology, which may reveal the mechanism of salt tolerance in plant, and thus be useful in engineering plants that are more salt tolerant.
Numerous studies have examined the effects of salinity on various aspects of plant life. Alvarez and Sanchez-Blanco [3] discussed the effect of salinity on plant quality, water relationships, photosynthetic parameters, and ion distribution in Callistemon citrinus. Strogonov [4] reported the various responses of glycophytes and halophytes, emphasizing the different effects of various types of salinity. However, a large number of these studies examined NaCl as the sole salinizing agent [5,6]. Strogonov [4] discussed the changes in metabolic pathways and the production of toxic intermediates under various types of salinity. Boyko [7] found that a balance between the different species of ions may be less toxic than the equiosmolar concentrations of a single salt. Therefore, the simulation of saline water irrigation with a single salt may produce misleading results about the plant response to salinity [8]. Therefore, increased attention should be paid to the response of plant physiology to the chemical components of saline irrigation water.
Sunflower is an important agricultural crop planted worldwide. As it is a medium salt-tolerant crop and appears to be well adapted for growth under moderately saline conditions [9], the sunflower physiologic response to salinity has been a research priority [10,11]. Various studies have been conducted to find appropriate irrigation programs and suitable management measures [12]. However, our understanding of how sunflower physiologic processes are affected by the chemical composition of irrigation water has room for improvement. If we want to improve the sunflower tolerance to saline conditions, we need to understand the mechanism through which salinity affects nutrient uptake, water content, and dry weight. Knowing the threshold of the physiologic response under different ionic compositions of irrigation water would be a potentially useful supplement for saline water irrigation management and sunflower salinity tolerance control.
Thus, we conducted field samplings in a typical saline water irrigated oasis, investigated the ionic compositions of irrigation water, and analyzed their effects on the nutrient uptake, water content, and dry weight of different sunflower organs. The main objective of this study was determining the influence of the chemical components of water on irrigated sunflower physiologic processes. This research contributes to improving the understanding of how the chemical composition of irrigation water changes sunflower growth and yield, which is useful for managing saline water resources and improving sunflower production.
2. Materials and Methods
2.1. Site Description and Sampling
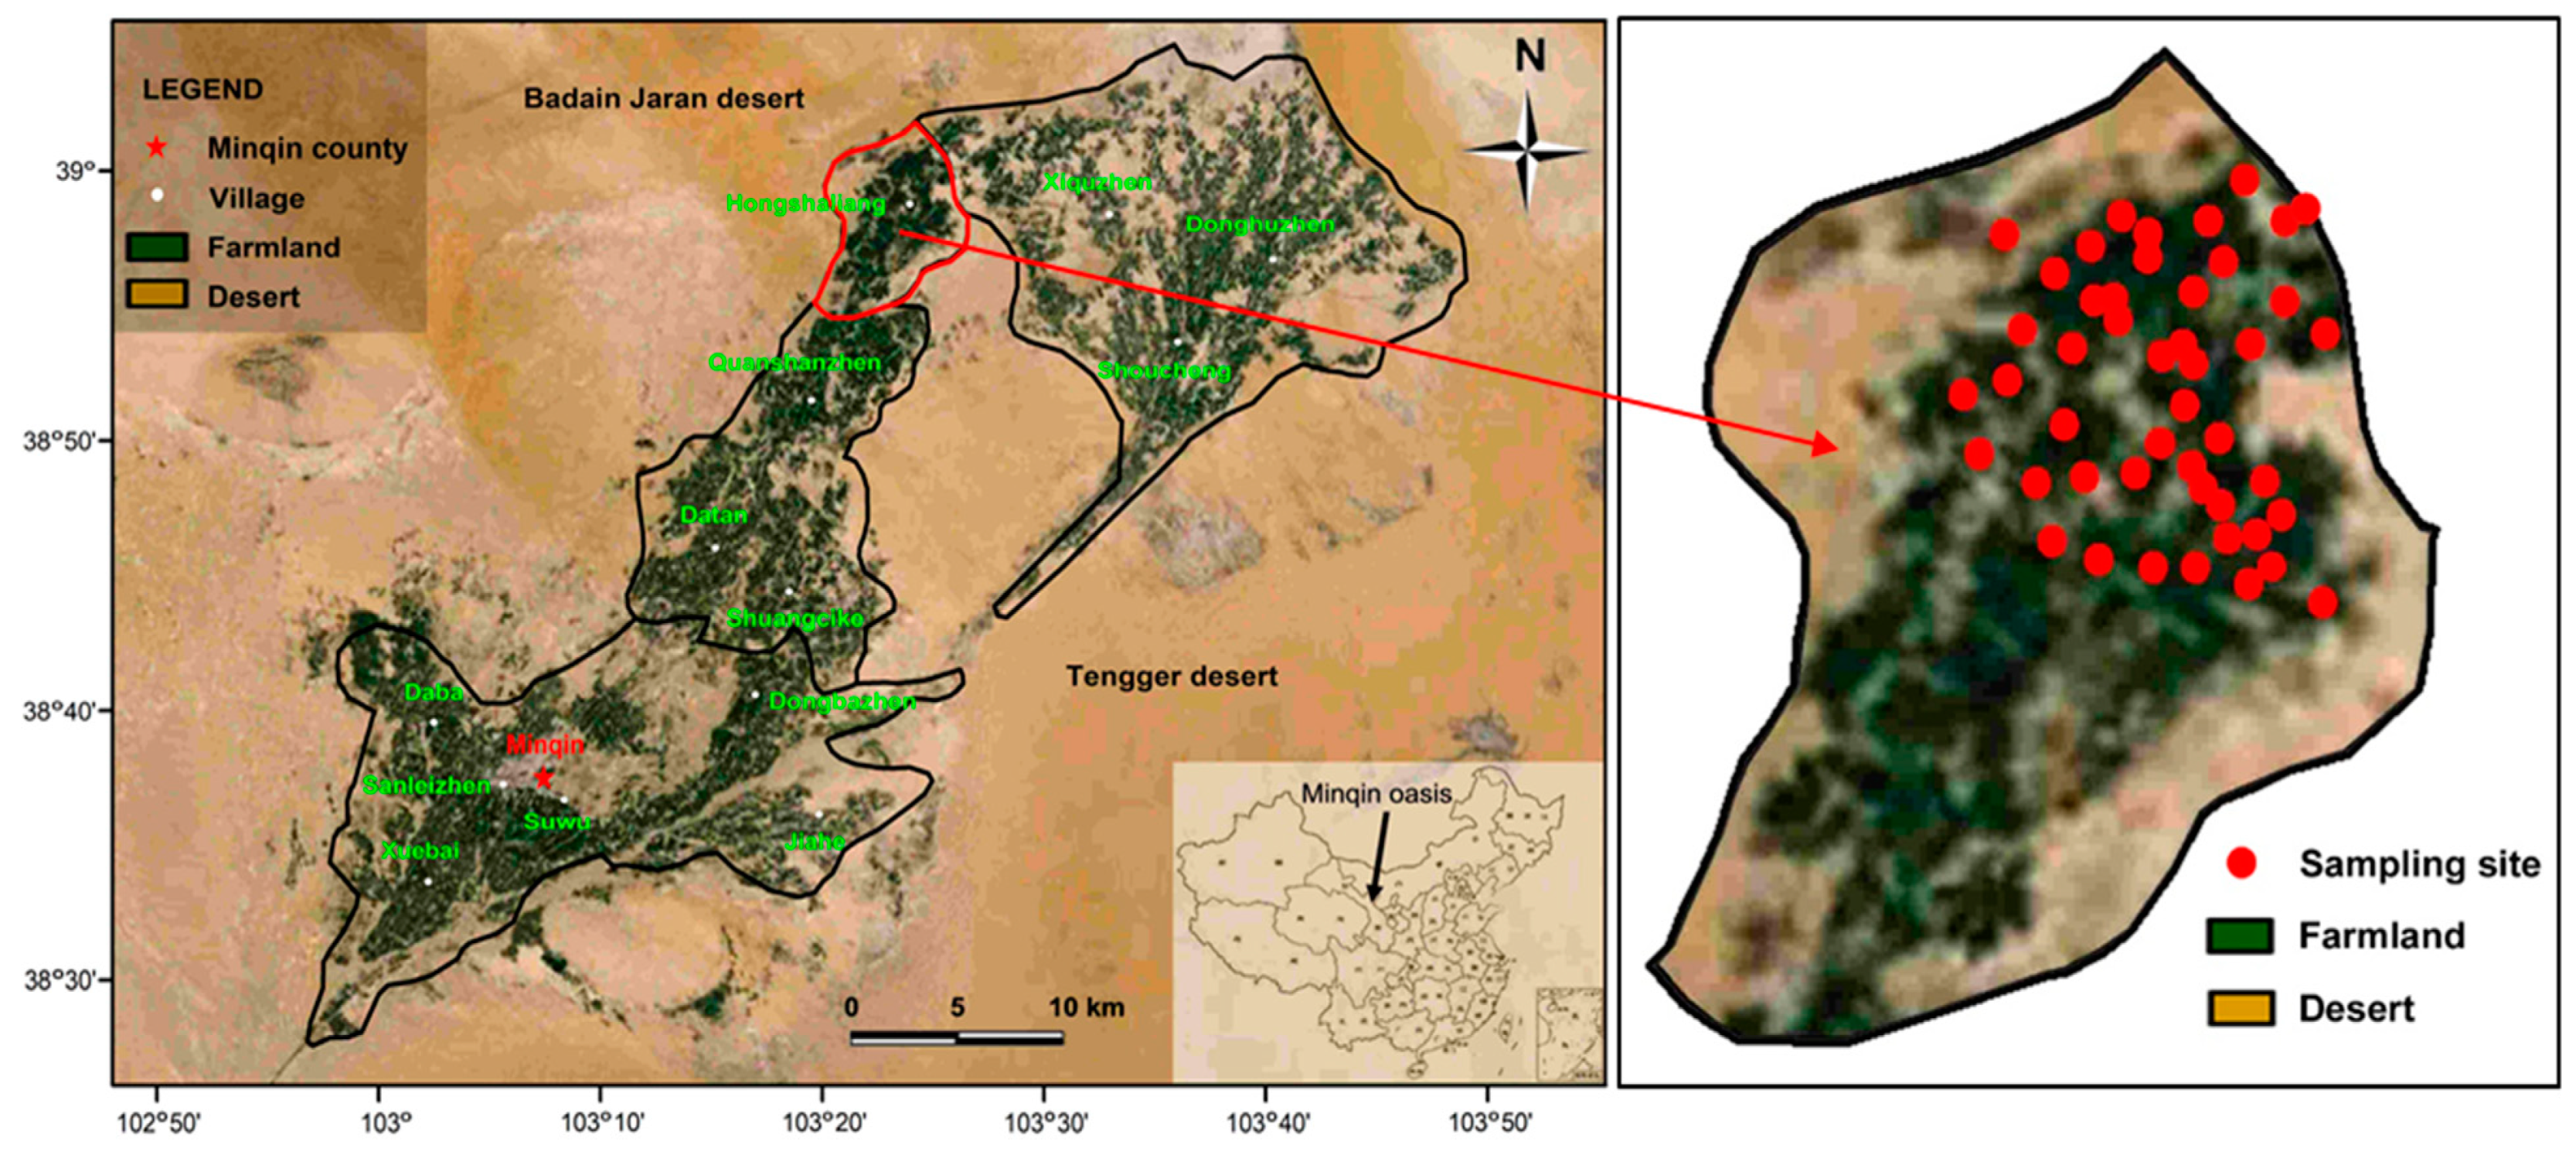
Minqin oasis, located between the Badain Jaran desert and Tengger desert in the lower reaches of the Shiyang River, Northwest China, is an ideal region for investigating the effects of long-term saline water irrigation on sunflower physiology. Irrigation water salinity here ranges from 0.02 to 1.51 S/m [13], resulting from 60 years of groundwater exploitation for irrigation [14]. As one of the driest regions in China, surface water used for irrigation is very limited. Therefore, more than 80% of the irrigation water comes from underground reserves [15]. In this study, Hongshaliang village of the Minqin oasis was chosen as a sampling region (Figure 1). Based on our previous research, this village applied variable salinity irrigation water and had similar patterns of agricultural management, such as sunflower variety, irrigation, and fertilization programs.
Water samples were collected on 2–3 August 2017. We selected 46 irrigation groundwater wells (Figure 1), spaced >250 m from one another, along an electrical conductivity of water (ECw) gradient ranging from 0.06 to 1.39 S/m. Each sample was taken after 30 mins of intensive pumping in order to avoid contamination. The ECw value was measured immediately using a DDS-308A conductivity meter (Shanghai Leici, Shanghai, China). We used a global positioning system (GPS) to determine the location of each well. Sealed samples were then taken to the Key Laboratory of Ecohydrology of the Inland River Basin (Lanzhou, China) for chemical analysis.
We chose 46 farmlands that were irrigated by the above sampling wells for collecting sunflower samples. The same variety of edible sunflower were planted in these farmlands. On 21–26 August 2017 (the mature stage of sunflower), five sunflower plants were chosen randomly from each farm area, excavated, and pooled as one sample. The leaves, stems (including petioles), roots, flower discs, and seeds of each sample were separated immediately and sealed in polyethylene bags. Then, they were weighed up and taken to the laboratory for physicochemical analysis.
2.2. Physicochemical Analysis
Chemical components (K, Na, Ca, Mg, NO3, Cl, and SO4) of irrigation water were analyzed using a Dionex ICS-5000 ion exchange chromatography system (Dionex Corporation, Sunnyvale, CA, USA).
Sunflower samples were clearly washed with distilled water, oven-dried at 80 °C until constant weight. Then, the dry weight of leaves, stems, roots, flower discs, and seeds were measured. The water content (WC) of each organ was calculated according to the formula:
where Wf is the sample fresh weight and Wd is the sample dry weight.
WC (%) = (Wf − Wd)/Wf × 100
The concentrations of carbon (C), nitrogen (N), sodium (Na), calcium (Ca), and magnesium (Mg) were determined in the leaves. The C and N concentration were determined by a Flash EA 1112 elemental analyzer (CE Instruments, Milan, Italy). The concentrations of Na, Ca, and Mg were determined by inductively coupled plasma-mass spectrometry (ICP-MS) (Thermo Fisher Scientific Inc., Waltham, MA, USA), as described by Rios et al. [16].
2.3. Data Analysis
Principal component analysis (PCA) was used to identify the different ions in the irrigation water. Linear regressions, which were performed using PASW Statistics 18.0 (SPSS Inc., Chicago, IL, USA), were used to test the relationships of sunflower physiology and irrigation salinity. Redundancy analysis (RDA) was performed to quantify the ionic effects of irrigation water on the variation of sunflower physiology. PCA and RDA were conducted using Canoco 5.0 (Microcomputer Power, Ithaca, NY, USA), Statistical tests were run using the Monte Carlo permutation procedure.
3. Results
3.1. Chemical Characteristics of Irrigation Water
The ordination of irrigation water samples, numbered from 1 to 46, was assigned according to the gradient of ECw as shown in Figure 2. Samples were distributed along the gradient from −0.6 to 1.0 on the PCA1 axis. Five polygons, with colors from blue to red representing the ECw ranges of 0.06–0.20 to 0.90–1.39 S/m, respectively, were also arranged in this order. As the concentration of Na, SO4, Mg, and Cl were more strongly positively correlated with the PCA1 axis, we concluded that these ions mainly decided the irrigation water salinity and the array of the samples along this axis. Na, SO4, Mg and Cl were the dominant ions in all irrigation water, accounting for, on average, 18.9%, 48.1%, 8.4%, and 20.0% of total dissolved solids, respectively. The NO3 concentration mainly resulted in the variation of chemical components along the PCA2 axis. As the number along this axis was not regularly arranged, and the concentration of NO3 had no statistical correlation with ECw value, this anion had no significant effect on irrigation water salinity.
The PCA result showed that the area of the blue polygon was the smallest, revealing that the irrigation water with an ECw range of 0.06 to 0.20 S/m had the most similar chemical components. The next three polygons, colored cyan, green, and yellow, exhibited similar areas and shapes, demonstrating that they had nearly the same variability in chemical components. They all extended along the PCA2 axis. As the NO3 concentration had a strong positive correlation with the PCA2 axis, we concluded that NO3 was the most labile ion in irrigation water with an ECw range of 0.20–0.90 S/m. For the last red polygon, however, the location was close to the PCA1 axis. Except for two samples, 42 and 44 (the variation of which were mainly induced by Ca concentration), others had similar chemical components, the variation of which was mainly controlled by Na, SO4, Mg, and Cl concentrations.
3.2. Changes in Sunflower Physiology Along Irrigation Salinity
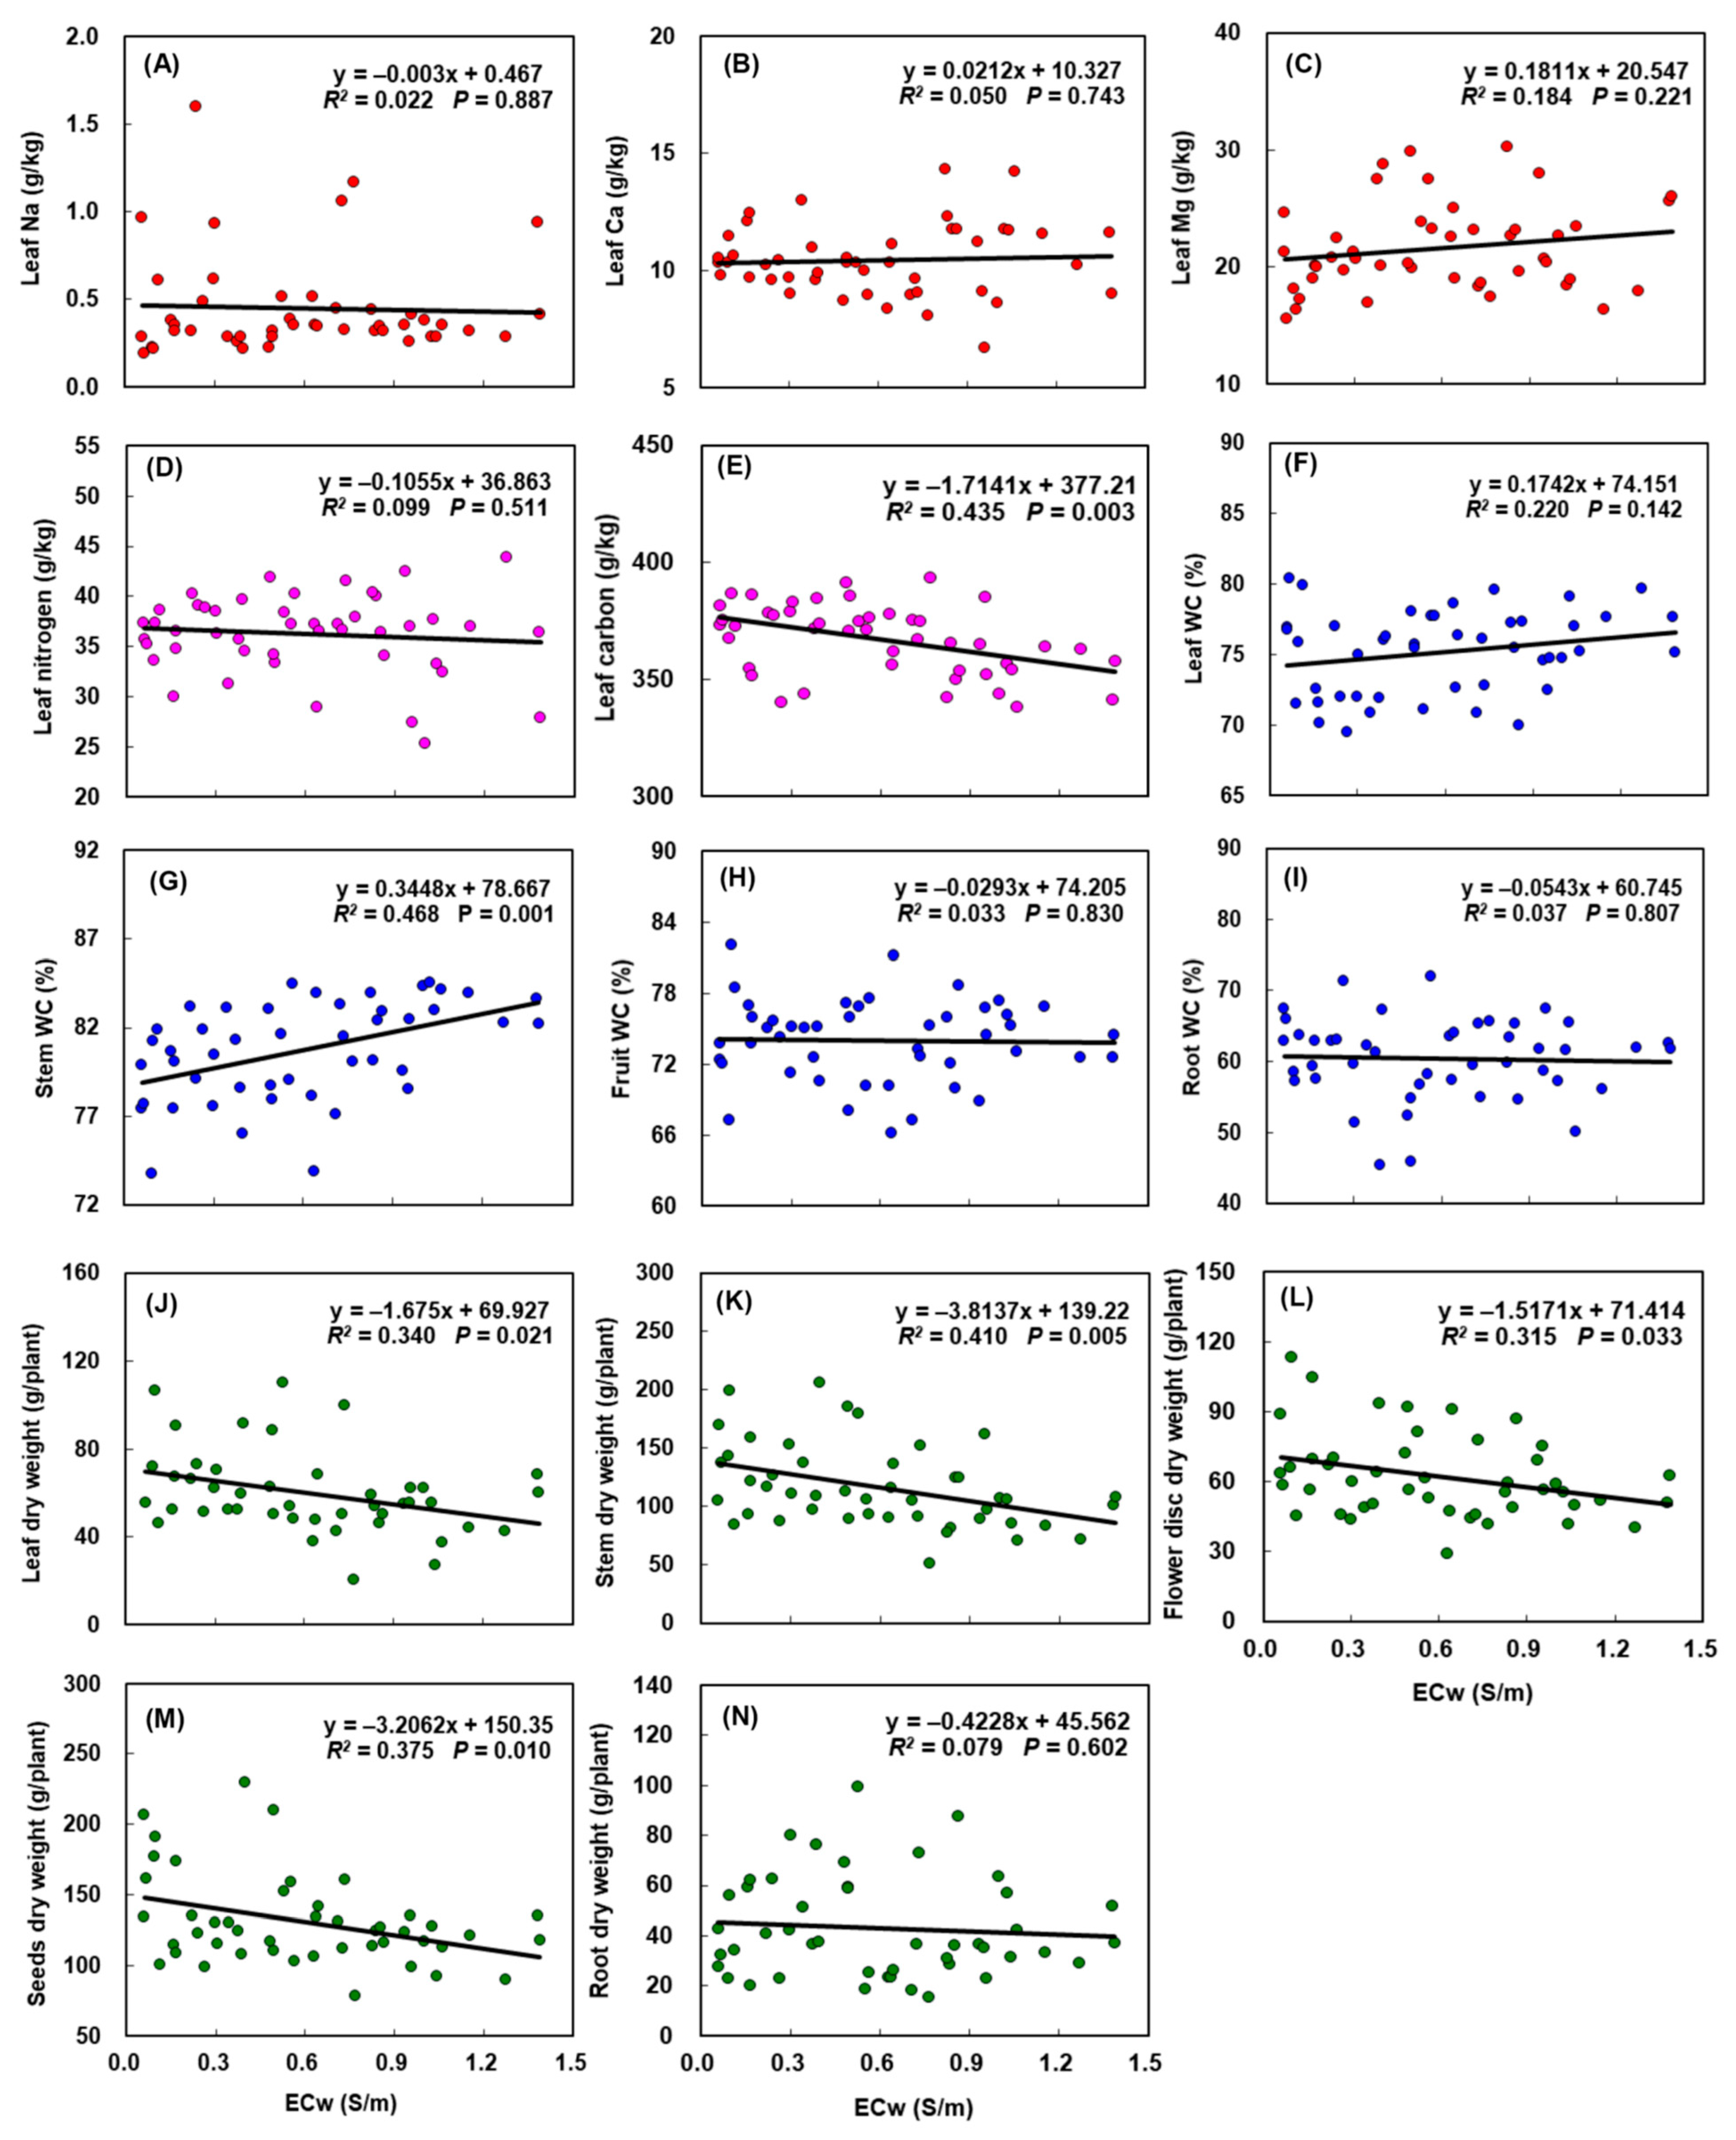
The concentrations of Na, Ca, and Mg in leaves did not show a consistent relationship with ECw across the gradient (Figure 3A–C), revealing that sunflower leaves could uniformly absorb these ions under saline water irrigation. Irrigation salinity did not significantly change the leaf N concentration either (Figure 3D), although the range varied with ECw increase. The only effect on leaf nutrients was C concentration, which decreased steadily with increasing ECw (Figure 3E, P < 0.01).
Although the effects of irrigation salinity on WC in leaves, fruits (flower discs and seeds), and roots (Figure 3F,H,I, respectively) were not statistically significant, we observed a trend where the leaf WC increased with ECw increase. Stem WC was positively related to salinity (Figure 3G), demonstrating that sunflower stem could retain more water under saline water irrigation.
The dry weight of different sunflower organs responded differently to irrigation salinity. The stem dry weight significantly decreased from low (0.06 S/m) to high (1.39 S/m) ECw with nearly a 25% loss (Figure 3K). At the P < 0.05 level, the dry weight of leaves, flower discs, and seeds were all negatively related with ECw (Figure 3J,L,M, respectively). These results indicated that irrigation salinity caused a significant reduction in the aboveground biomass of sunflower. The belowground biomass, however, showed a weak and insignificant relationship with irrigation salinity (Figure 3N): the root dry weight decreased marginally with increasing ECw.
3.3. Relationships between Irrigation Water Ions and Sunflower Physiology
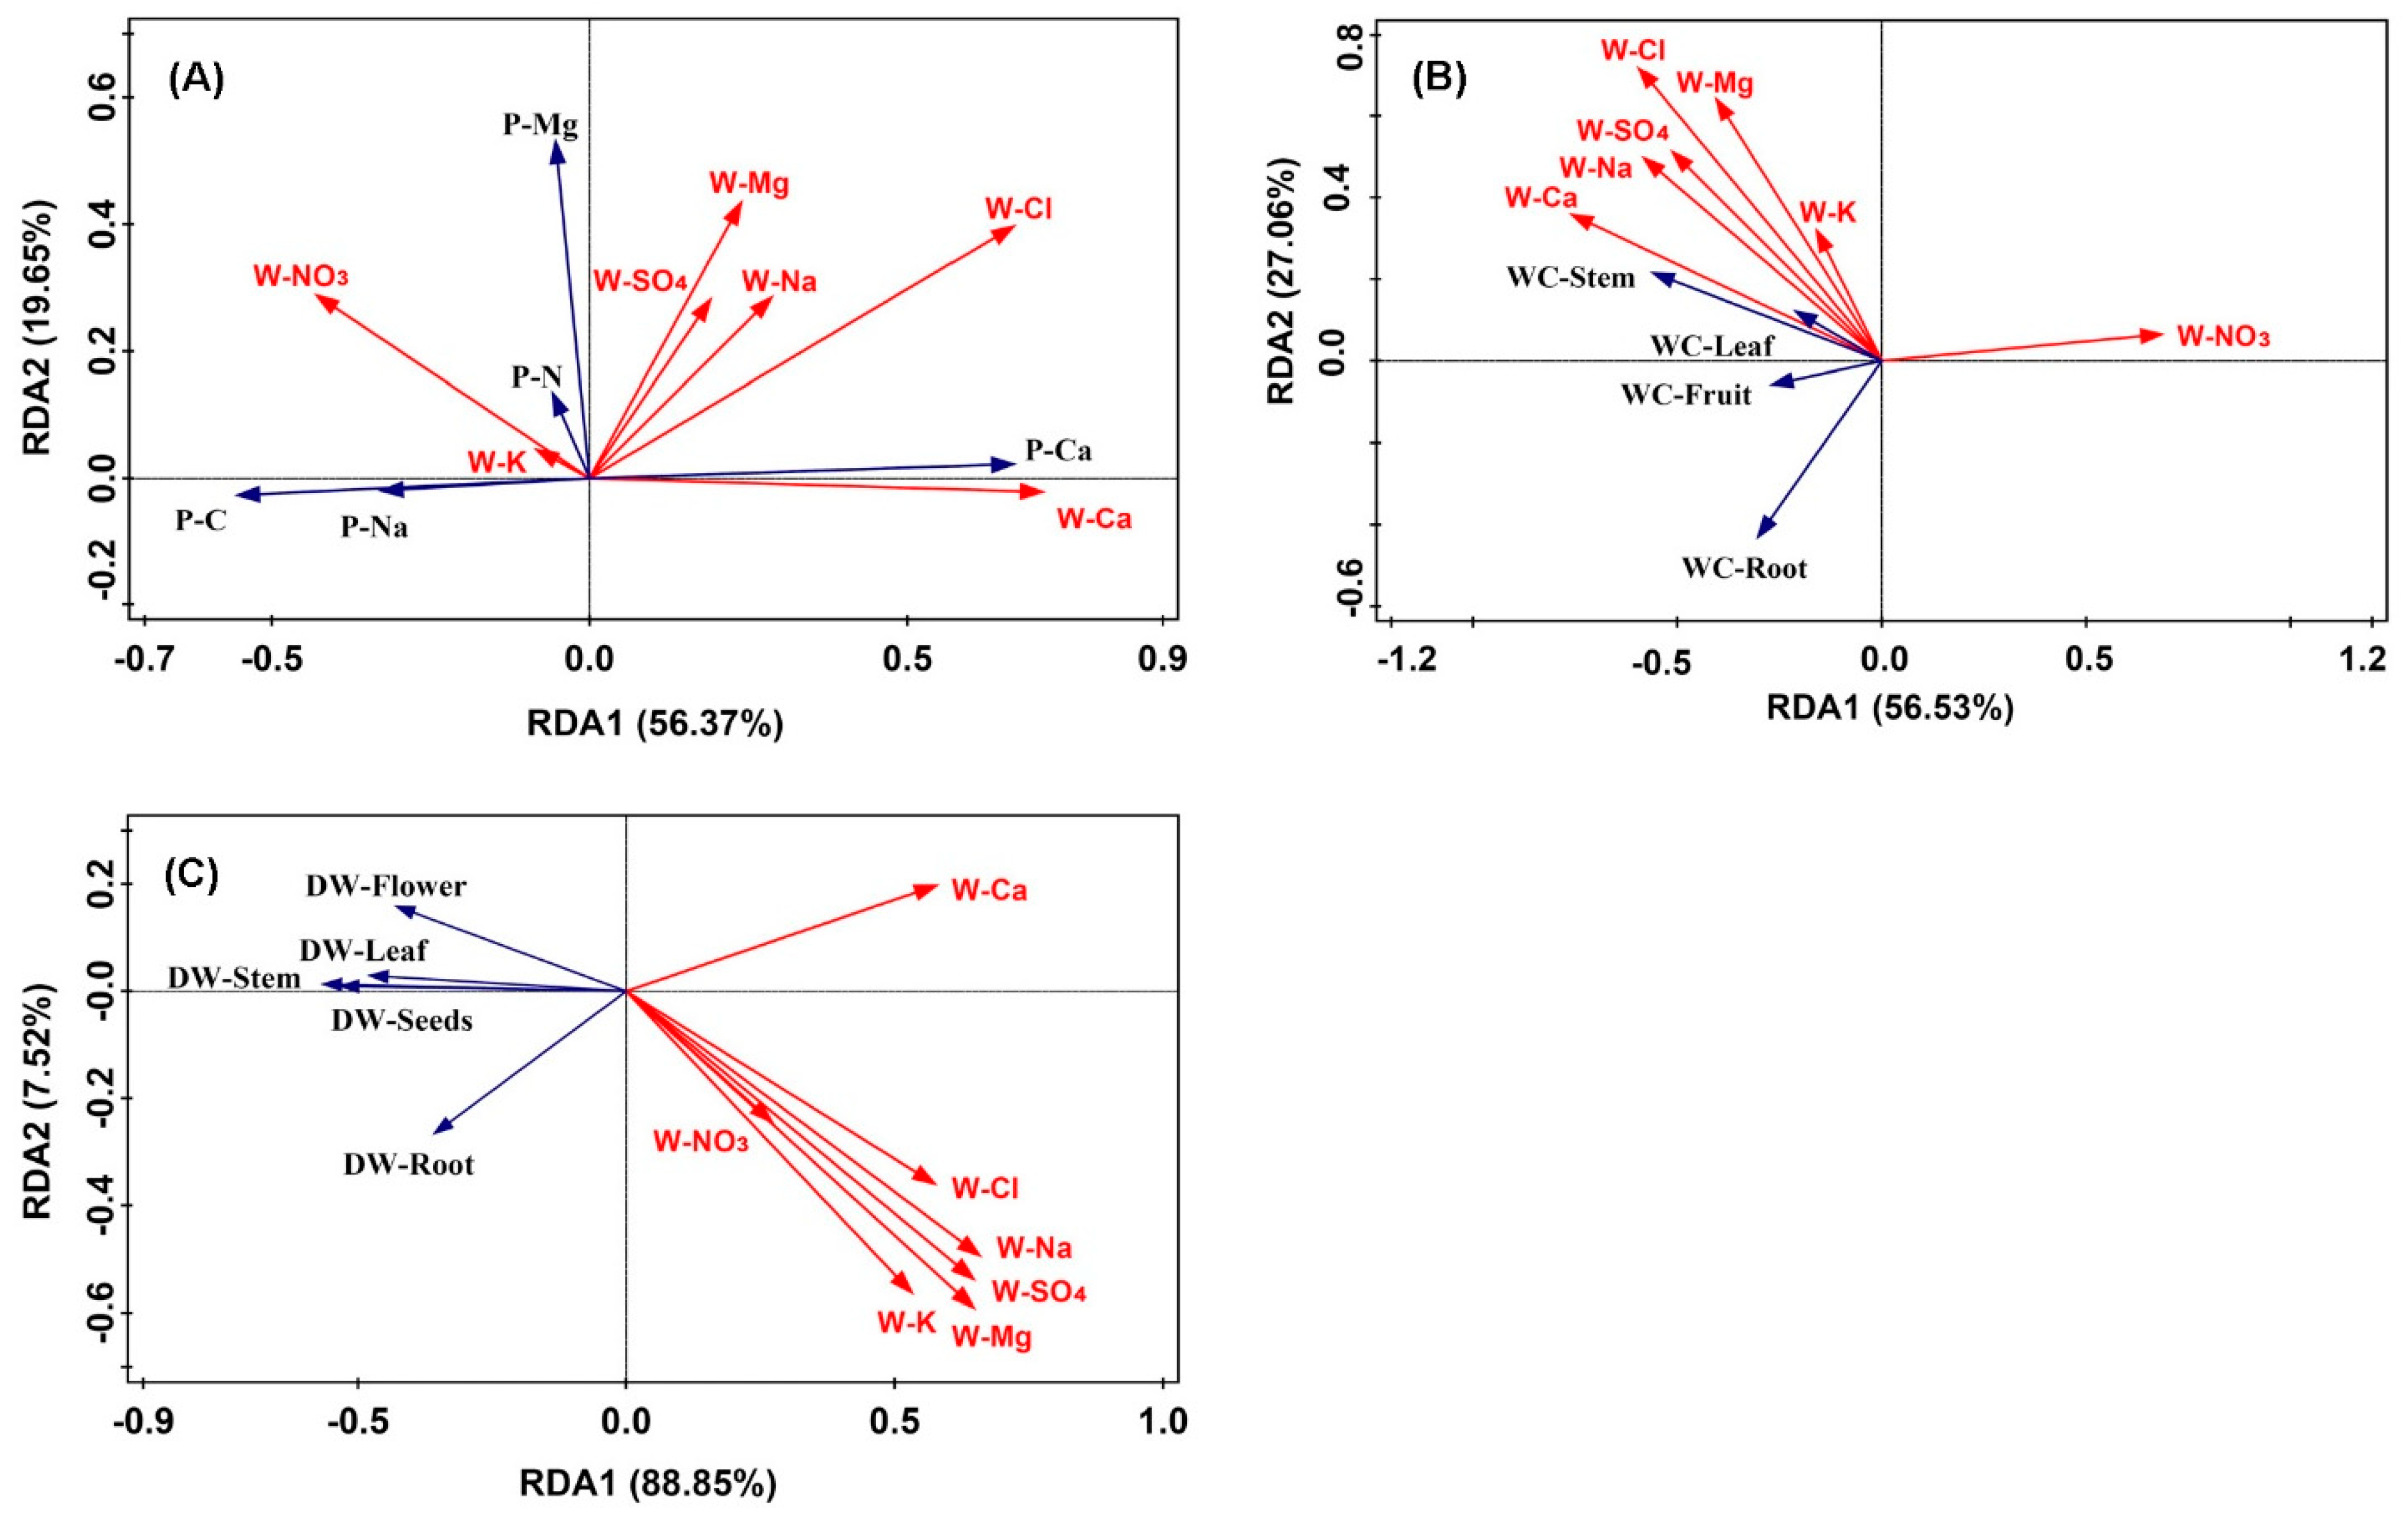
The concentrations of seven irrigation water ions (W-K, W-Na, W-Ca, W-Mg, W-NO3, W-Cl, and W-SO4) were correlated with those of leaf Na, Ca, Mg, N, and C by redundancy analysis (Figure 4A). The first two axes explained 76.0% of the variation. The first axis (Monte Carlo permutation test: F = 7.9, P = 0.002) showed a gradient of increasing W-Ca and W-Cl, and decreasing W-NO3 concentrations. W-Ca and W-Cl concentrations were positively related with leaf Ca concentration (R2 = 0.394, P = 0.007 and R2 = 0.328, P = 0.026, respectively), even though the leaf Ca concentration did not change significantly with increasing ECw value (Figure 3B). All irrigation water ions except W-K significantly influenced the leaf C concentration, with W-Na (R2 = −0.408, P = 0.005), W-SO4 (R2 = −0.394, P = 0.007), W-Mg (R2 = −0.377, P = 0.010), and W-Ca and W-Cl (both R2 = −0.559, P < 0.001) concentrations having a negative relationship and W-NO3 (R2 = 0.312, P = 0.007) concentration having a positive relationship. Although all seven ions explained 38.3% of the variation in the leaf elements, only W-Ca and W-Cl, which explained 9.7%, were significant in the Monte Carlo permutation test (F = 4.7, P = 0.002; and F = 4.7, P = 0.004, respectively).
As for the variation in WC in different sunflower organs, the first two axes explained 83.59% (Figure 4B). However, the two axes did not show a statistical significance with F = 5.7, P = 0.092 for the first axis and F = 2.9, P = 0.059 for the other. Five ions in irrigation water, which were significant in the Monte Carlo permutation test, explained the variation: W-Ca (8.3%, F = 4.0, P = 0.012), W-Cl (8.0%, F = 3.8, P = 0.012), W-Na (6.6%, F = 3.1, P = 0.012), W-NO3 (6.6%, F = 3.1, P = 0.028), and W-SO4 (5.7%, F = 2.7, P = 0.036 concentrations. Figure 4B shows that these ions mainly affected the stem WC, with W-NO3 concentration being negative and the others being positive.
The RDA1 and RDA2 axes explained 96.37% of the change in sunflower biomass (Figure 4C). The first axis (F = 11.2, P = 0.042) showed a gradient of increasing irrigation water ions, while the second axis (F = 1.0, P = 0.996) divided the irrigation water ions and dry weight of different organs. The dry weights of stems, seeds, leaves, and flower discs were negatively correlated with all irrigation water ions concentrations. The root dry weight was mainly negatively correlated with W-Ca concentration. However, the water ions mainly affecting the sunflower dry weight were W-Na (10.4%, F = 5.1, P = 0.014), W-Mg (10.2%, F = 5.0, P = 0.014), and W-SO4 (10.1%, F = 4.9, P = 0.024) concentrations, influencing the variation on both axes. The other three ions, W-Cl (7.9%, F = 3.8, P = 0.024), W-Ca (7.8%, F = 3.7, P = 0.028), and W-K (7.0%, F = 3.3, P = 0.046), explained a statistically significant amount of the variation.
4. Discussion
The chemical composition of irrigation water plays an important role in determining plant growth and nutrient uptake [17]. PCA results indicated that irrigation water chemistry was mainly controlled by Na, SO4, Mg, and Cl concentrations in this sampling region. This is consistent with our previous research, where we observed that these ions increased more prominently than others as water salinity increases [18]. These ions commonly dominate in saline irrigation water elsewhere [19]. Relationship analysis of the ions showed strong positive correlations among Na, Mg, SO4, Cl, and Ca concentrations, implying a proportionate hydrochemical behavior of these ions in irrigation water [20]. Except for NO3 concentration, the value of ECw was positively correlated with each ion concentration, demonstrating that the ionic behavior changed as soon as groundwater became saline. Based on the polygon areas analyzed, irrigation water within an ECw range of 0.06 to 0.20 S/m was detected as having the most similar chemical components. Water within this ECw range was generally classified as fresh (<0.15 S/m) or brackish (0.15–0.30 S/m). This means that the chemical composition of fresh and slightly brackish water was more stable than saline water (>0.30 S/m). The irrigation water in the ECw range of 0.20 to 0.90 S/m showed the strongest variability, which was mainly influenced by NO3 concentration. As the natural concentration of NO3 in rainfall is small [21], the concentration variation in groundwater is mainly derived from irrigation returns, which are common in agricultural areas [14]. These results showed that the behavior of saline water ions significantly changes, even within a similar water salinity range.
Generally, higher water salinity could significantly increase leaf Na concentration in a number of plants [22,23]. However, we found that sunflower is able to express the high potential of inhibiting Na increase even under irrigation water salinity of 1.39 S/m: the concentration of Na in leaves was the same as under 0.06 S/m. Based on the relationship analysis (Figure 4A), we found no statistically significant correlation between the concentrations of leaf Na and any other ions or nutrients in irrigation water and sunflower leaves. These results indicate that sunflowers can adjust the Na balance to withdraw such ions from the leaves under high saline conditions, using a similar mechanism reported for halophytes [24]. Francois [9] reported that Na is largely excluded from sunflower tissues and its concentration only increases slightly even with increases in salinity levels, indicating that sunflower is a Na excluder. This may also the main strategy that operates in the sunflower leaves to avoid the toxic effects of harmful ions [25], which reflects the specific adaptability of sunflower under long-term salinity stress.
The same trend continued in leaf Ca and Mg uptake, which showed little variation across the ECw gradient. Based on the relationship analysis (Figure 4A), we observed that irrigation water Ca and Cl (which all increased with increasing ECw) had significantly positive relationships with leaf Ca concentration. As Ca appears to be easy displaced from its membrane binding sites by other elements [26], the reason for the little variation in Ca concentration, therefore, may be somewhat correlated with the leaf ion exchange, which plays an important role in maintaining ionic equilibrium in leaves. As a structural element in leaves, Ca tends to be less absorbed during senescence than most other elements [27], which is possibly the main reason contributing to the smaller change in concentration. From these results, we simultaneously confirmed that ions in irrigation water exhibit significantly different behaviors in leaf nutrient uptake compared with water salinity, i.e., although leaf ion concentration did not increase with increasing water salinity, the ions contained in water (which had significant correlations with water salinity) could still significantly affect leaf ion balance. As for the effects on leaf Mg uptake, Rivelli et al. [22] observed no large differences between leaf Mg concentration in both saline and non-saline treatments; Bernstein et al. [28] reported that increases in salinity only reduced leaf Mg concentration in beet and had little or no influence on the leaves of several other vegetable crops. Ruiz et al. [29] found that salinity reduced leaf Mg concentration in citrus. Variable results may be produced by the compounds in saline water and their concentrations, the duration of irrigation, and the species and varieties of crops irrigated [30,31].
Until now, information on the effects of irrigation salinity on leaf N uptake has been controversial. The competition between ion concentration and nitrogen under saline conditions alters plant vital physiological processes, such as photosynthesis, since a large fraction of leaf N (about 60–80%) is invested in the photosynthetic machinery. In our study, irrigation salinity did not significantly affect the leaf N. However, leaf C had a positive relationship with leaf N concentration. This clearly indicates that sunflower can effectively regulate nitrogen partitioning for carbon assimilation machinery to optimize photosynthetic capacity and, hence, growth and development over a large range of saline conditions. Salt-induced decreasing leaf C with elevating irrigation salinity reflects a depressed carbon flux toward the synthesis of sugars at the cost of N assimilation. Together, our findings reveal that sunflower could maintain C- and N-assimilation processes in equilibrium through well-coordinated regulatory mechanisms to enable optimal sunflower growth and development under saline conditions [23].
RDA results showed that Ca and Cl concentrations in irrigation water play a primary role in the variation in leaf Na, Ca, Mg, N, and C uptake. These two ions mainly had significant relationships with leaf Ca and leaf C. Combined with the above analysis, we conclude that Ca and Cl concentrations in irrigation water mainly affected the Ca-related ion exchange and C- and N-assimilation processes in sunflower leaves. There is much evidence indicating that external calcium is important in regulating ion relationships in plants and influencing C-N interactions [32]. Gardestrom et al. [33] found both the external NADH and NADPH dehydrogenases and the internal NADPH dehydrogenase are stimulated by Ca. As reported, a possible effect of Cl on plant physiology has been suggested by the sensitivity of leaf ribulose-l,5-bisphosphate carboxylase levels, and therefore the rate of assimilation of CO2 to leaf Cl level and photosynthesis of the plant. If these effects were combined with those generated by the loss of K and Ca homeostasis, a drastic loss in plant viability could readily ensue [34].
The results of this study show that the WC of sunflower stem increases gradually and became more positive as the irrigation salinity increases. This indicates that sunflower stems are able to absorb, even under high saline conditions, a sufficient amount of water. This might be due to a dilution effect due to salt-induced enhanced succulence, which is an important adaptive strategy that might contribute to the regulation of internal ion concentration [35]. Similar results have been reported for Atriplex griffithii [36] and Atriplex nummularia [37]. Lack of significant difference in leaf WC along irrigation the salinity gradient can be related to their uniform uptake of different ions detected in this study. The result is in agreement with the earlier findings of Ashraf and Naqvi [38], who did not find any positive relationship between these osmotic and salt tolerance of four Brassica species under varying growth medium Na:Ca ratios. The same mechanism may also occur for the WC of fruits and roots. Five ions (Ca, Cl, Na, NO3, and SO4) in irrigation water were found to mainly affect the sunflower WC of different organs, which could be explained by these ions’ promotive effect on organs hydraulic conductivity or by changes in the osmotic pressure gradient between the organs and the surrounding medium [39].
The opposing effects of salinity on plant biomass are a serious problem that has been reported by many researchers [40,41]. Salinity imposes its effects through two mechanisms: ion excess and water deficit [42]. Every plant species has a different mechanism to cope with these effects [24]. In our study, although the significant uses in aboveground biomass of sunflower was detected, the decline in stem biomass was the most remarkable response of sunflower to irrigation salinity. However, the 25% loss in stem biomass suggests that salt tolerance for our tested variety of sunflower is much lower than reported by Ashraf and Tufail [43]. Except for NO3 in irrigation water, the other six ions all significantly influence the dry weight of different sunflower organs. Na concentration explained the most variation, which is consistent with that reported. Although plant growth is primarily limited by the salinity (ECw) level of the irrigation water, the application of water with a sodium imbalance can further reduce yields [44]. Reductions in water infiltration can occur when irrigation water contains higher sodium than calcium and magnesium, which further aggravates the negative effects on plant productivity.
5. Conclusions
Irrigation water components in our study was mainly controlled by Na, SO4, Mg, and Cl concentrations. The ionic characteristics changed as soon as groundwater became saline, as fresh water shared the most similar chemical components whereas saline water showed the strongest variability in chemistry.
Irrigation water salinity had no significant effect on the concentrations of Na, Ca, Mg, and N in leaves, although Ca and Cl concentrations in irrigation water significantly increased leaf Ca concentration. The concentrations of Ca and Cl in irrigation water mainly affected ionic exchange and C- and N-assimilation processes in sunflower leaves, as leaf C concentration decreased steadily with salinity increase.
The water content in stems increased significantly with irrigation water salinity increase. However, no significant relationship was found between water salinity and WC in leaves, fruits, and roots. The results were mainly caused by Ca, Cl, Na, NO3, and SO4 concentrations in irrigation water.
The dry weight in leaves, flower discs, and seeds were all significantly reduced from low to high salinity, while exhibiting a nearly 25% loss in stems and no influence was observed in roots. The concentrations of Na, Ca, Mg, K, Cl, and SO4 in irrigation water mainly influence the dry weight of different organs.
Author Contributions
C.L. and Z.Z. designed this research. C.L. took part in the implementation, analysis, and writing process. Z.Z. revised the analysis and the paper.
Funding
This research was funded by the National Key Research and Development Plan of China (2017YFC0504301) and the National Natural Science Foundation of China (41501113).
Acknowledgments
The authors are thankful to C.P. for the technical support in completing the field work.
Conflicts of Interest
The authors declare no conflict of interest.
References
- Rozema, J.; Flowers, T. Crops for a salinized world. Science 2008, 322, 1478–1480. [Google Scholar] [CrossRef] [PubMed]
- Piper, A.M. A graphic procedure in the geochemical interpretation of water analyses. EOS Trans. Am. Geophys. Union 1944, 25, 914–928. [Google Scholar] [CrossRef]
- Álvarez, S.; Sánchez-Blanco, M.J. Long-term effect of salinity on plant quality, water relations, photosynthetic parameters and ion distribution in Callistemon citrinus. Plant Biol. 2014, 16, 757–764. [Google Scholar] [CrossRef]
- Strogonov, B.P. Physiological Basis of Salt Tolerance of Plants (as Affected by Various Types of Salinity); Israel Program for Scientific Translations: Jerusalem, Israel, 1964. [Google Scholar]
- Eom, S.H.; Setter, T.L.; DiTommaso, A.; Weston, L.A. Differential growth response to salt stress among selected ornamentals. J. Plant Nutr. 2007, 30, 1109–1126. [Google Scholar] [CrossRef]
- Cassaniti, C.; Leonardi, C.; Flowers, T.J. The effects of sodium chloride on ornamental shrubs. Sci. Hortic. 2009, 122, 586–593. [Google Scholar] [CrossRef]
- Boyko, H. Salinity and Aridity New Approaches to Old Problems; Springer: Dordrecht, The Netherlands, 1966; pp. 3–22. [Google Scholar]
- Carter, C.T.; Grieve, C.M. Salt tolerance of floriculture crops. In Ecophysiology of High Salinity Tolerant Plants; Khan, M.A., Weber, D.J., Eds.; Springer: Dordrecht, The Netherlands, 2008; pp. 279–287. [Google Scholar]
- Francois, L.E. Salinity effects on four sunflower hybrids. Agron. J. 1996, 88, 215–219. [Google Scholar] [CrossRef]
- Sadak, M.S.; Rady, M.M.; Badr, N.M.; Gaballah, M.S. Increasing sunflower salt tolerance using nicotinamide and α-tocopherol. Int. J. Acad. Res. 2010, 2, 263–270. [Google Scholar]
- Shahbaz, M.; Ashraf, M.; Akram, N.A.; Hanif, A.; Hameed, S.; Joham, S.; Rehman, R. Salt-induced modulation in growth, photosynthetic capacity, proline content and ion accumulation in sunflower (Helianthus annuus L.). Acta Physiol. Plant. 2011, 33, 1113–1122. [Google Scholar] [CrossRef]
- Chen, M.; Kang, Y.; Wan, S.; Liu, S.P. Drip irrigation with saline water for oleic sunflower (Helianthus annuus L.). Agric. Water Manag. 2009, 96, 1766–1772. [Google Scholar] [CrossRef]
- Chen, L.J.; Feng, Q.; Li, C.S.; Song, Y.X.; Liu, W.; Si, J.H.; Zhang, B.G. Spatial variations of soil microbial activities in saline groundwater-irrigated soil ecosystem. Environ. Manag. 2016, 57, 1054–1061. [Google Scholar] [CrossRef]
- Edmunds, W.M.; Ma, J.; Aeschbach-Hertig, W.; Kipfer, R.; Darbyshire, D.P.F. Groundwater recharge history and hydrogeochemical evolution in the Minqin Basin, North West China. Appl. Geochem. 2006, 21, 2148–2170. [Google Scholar] [CrossRef]
- You, Q.G.; Xue, X.; Huang, C.H. Preliminary study on the effects of saline water irrigation on soil salinization in deep groundwater area: A case study of Minqin oasis. J. Desert Res. 2011, 31, 302–308, (In Chinese with English Abstract). [Google Scholar]
- Rios, J.J.; Lochlainn, S.Ó.; Devonshire, J.; Graham, N.S.; Hammond, J.P.; King, G.J.; White, P.G.; Kurup, S.; Broadley, M.R. Distribution of calcium (Ca) and magnesium (Mg) in the leaves of Brassica rapa under varying exogenous Ca and Mg supply. Ann. Bot. 2012, 109, 1081–1089. [Google Scholar] [CrossRef] [PubMed]
- Niu, G.; Cabrera, R.I. Growth and physiological responses of landscape plants to saline water irrigation: A review. HortScience 2010, 45, 1605–1609. [Google Scholar]
- Chen, L.; Feng, Q. Geostatistical analysis of temporal and spatial variations in groundwater levels and quality in the Minqin oasis, Northwest China. Environ. Earth Sci. 2013, 70, 1367–1378. [Google Scholar] [CrossRef]
- Aghazadeh, N.; Mogaddam, A.A. Assessment of groundwater quality and its suitability for drinking and agricultural uses in the Oshnavieh area, Northwest of Iran. J. Environ. Prot. 2010, 1, 30–40. [Google Scholar] [CrossRef]
- Mondal, N.C.; Singh, V.S.; Saxena, V.K.; Prasad, R.K. Improvement of groundwater quality due to fresh water ingress in Potharlanka Island, Krishna delta, India. Environ. Geol. 2008, 55, 595–603. [Google Scholar] [CrossRef]
- McArthur, J.M.; Sikdar, P.K.; Hoque, M.A.; Ghosal, U. Waste-water impacts on groundwater: Cl/Br ratios and implications for arsenic pollution of groundwater in the Bengal Basin and Red River Basin, Vietnam. Sci. Total Environ. 2012, 437, 390–402. [Google Scholar] [CrossRef] [Green Version]
- Rivelli, A.R.; De Maria, S.; Pizza, S.; Gherbin, P. Growth and physiological response of hydroponically grown sunflower as affected by salinity and magnesium levels. J. Plant Nutr. 2010, 33, 1307–1323. [Google Scholar] [CrossRef]
- Hussin, S.; Geissler, N.; Koyro, H.W. Effect of NaCl salinity on Atriplex nummularia (L.) with special emphasis on carbon and nitrogen metabolism. Acta Physiol. Plant. 2013, 35, 1025–1038. [Google Scholar] [CrossRef]
- Munns, R. Comparative physiology of salt and water stress. Plant Cell Environ. 2002, 25, 239–250. [Google Scholar] [CrossRef] [PubMed] [Green Version]
- Debez, A.; Saadaoui, D.; Ramani, B.; Ouerghi, Z.; Koyro, H.W.; Huchzermeyer, B.; Abdelly, C. Leaf H+-ATPase activity and photosynthetic capacity of Cakile maritima under increasing salinity. Environ. Exp. Bot. 2006, 57, 285–295. [Google Scholar] [CrossRef]
- Tuna, A.L.; Kaya, C.; Ashraf, M.; Altunlu, H.; Yokas, I.; Yagmur, B. The effects of calcium sulphate on growth, membrane stability and nutrient uptake of tomato plants grown under salt stress. Environ. Exp. Bot. 2007, 59, 173–178. [Google Scholar] [CrossRef]
- Kazakou, E.; Garnier, E.; Navas, M.L.; Roumet, C.; Collin, C.; Laurent, G. Components of nutrient residence time and the leaf economics spectrum in species from Mediterranean old-fields differing in successional status. Funct. Ecol. 2007, 21, 235–245. [Google Scholar] [CrossRef] [Green Version]
- Bernstein, L.; Francois, L.E.; Clark, R.A. Interactive effects of salinity and fertility on yields of grains and vegetables. Agron. J. 1974, 66, 412–421. [Google Scholar] [CrossRef]
- Ruiz, D.; Martínez, V.; Cerdá, A. Citrus response to salinity: Growth and nutrient uptake. Tree Physiol. 1997, 17, 141–150. [Google Scholar] [CrossRef] [PubMed]
- Elifantz, H.; Kautsky, L.; Mor-Yosef, M.; Tarchitzky, J.; Bar-Tal, A.; Chen, Y.; Minz, D. Microbial activity and organic matter dynamics during 4 years of irrigation with treated wastewater. Microb. Ecol. 2011, 62, 973–981. [Google Scholar] [CrossRef]
- Lopes, A.R.; Becerra-Castro, C.; Vaz-Moreira, I.; Silva, M.E.F.; Nunes, O.C.; Manaia, C.M. Irrigation with treated wastewater: Potential impacts on microbial function and diversity in agricultural soils. In Wastewater Reuse and Current Challenges; Fatta-Kassinos, D., Dionysiou, D.D., Kummerer, K., Eds.; Springer International Publishing: Basel, Switzerland, 2015; pp. 105–128. [Google Scholar]
- Wu, G.Q.; Wang, S.M. Calcium regulates K+/Na+ homeostasis in rice (Oryza sativa L.) under saline conditions. Plant Soil Environ. 2012, 58, 121–127. [Google Scholar] [CrossRef]
- Gardeström, P.; Igamberdiev, A.U.; Raghavendra, A.S. Mitochondrial functions in the light and significance to carbon-nitrogen interactions. In Photosynthetic Nitrogen Assimilation and Associated Carbon and Respiratory Metabolism; Noctor, G., Foyer, C., Eds.; Springer: Dordrecht, The Netherlands, 2002; pp. 151–172. [Google Scholar]
- Tavakkoli, E.; Rengasamy, P.; McDonald, G.K. High concentrations of Na+ and Cl− ions in soil solution have simultaneous detrimental effects on growth of faba bean under salinity stress. J. Exp. Bot. 2010, 61, 4449–4459. [Google Scholar] [CrossRef]
- Koyro, H.W.; Geissler, N.; Hussin, S.; Debez, A.; Huchzermeyer, B. Strategies of halophytes to survive in a salty environment. In Abiotic Stress and Plant Responses; Khan, N.A., Singh, S., Eds.; IK International Publishing House Pvt. Ltd.: New Delhi, India, 2008; pp. 79–101. [Google Scholar]
- Khan, M.A.; Ungar, I.A.; Showalter, A.M. Effects of salinity on growth, water relations and ion accumulation of the subtropical perennial halophyte, Atriplex griffithii var. stocksii. Ann. Bot. 2000, 85, 225–232. [Google Scholar] [CrossRef]
- Silveira, J.A.G.; Araújo, S.A.M.; Lima, J.P.M.S.; Viégas, R.A. Roots and leaves display contrasting osmotic adjustment mechanisms in response to NaCl-salinity in Atriplex nummularia. Environ. Exp. Bot. 2009, 66, 1–8. [Google Scholar] [CrossRef]
- Ashraf, M.; Naqvi, M.I. Growth and ion uptake of four Brassica species as affected by Na/Ca ratio in saline sand culture. J. Plant Nutr. Soil Sci. 1992, 155, 101–108. [Google Scholar]
- Quintero, J.M.; Fournier, J.M.; Benlloch, M. Water transport in sunflower root systems: Effects of ABA, Ca2+ status and HgCl2. J. Exp. Bot. 1999, 50, 1607–1612. [Google Scholar] [CrossRef]
- Greenway, H.; Munns, R. Mechanisms of salt tolerance in nonhalophytes. Annu. Rev. Plant Physiol. 1980, 31, 149–190. [Google Scholar] [CrossRef]
- Tester, M.; Davenport, R. Na+ tolerance and Na+ transport in higher plants. Ann. Bot. 2003, 91, 503–527. [Google Scholar] [CrossRef]
- Munns, R.; James, R.A.; Läuchli, A. Approaches to increasing the salt tolerance of wheat and other cereals. J. Exp. Bot. 2006, 57, 1025–1043. [Google Scholar] [CrossRef] [PubMed] [Green Version]
- Ashraf, M.; Tufail, M. Variation in salinity tolerance in sunflower (Helianthus annum L.). J. Agron. Crop Sci. 1995, 174, 351–362. [Google Scholar] [CrossRef]
- Bauder, T.A.; Waskom, R.M.; Davis, J.G.; Sutherland, P.L. Irrigation Water Quality Criteria; Colorado State University, Extension: Fort Collins, CO, USA, 2011. [Google Scholar]
Figure 1.
Location of sampling sites in Minqin oasis.

Figure 2.
Principal component analysis (PCA) of the chemical compositions of saline water and samples’ distribution. Sample numbers are ordered from the value of water electrical conductivity (ECw). Different shapes demonstrate a certain range of ECw (S/m): cross, 0.06 to 0.20; square, 0.20 to 0.40; rhombus, 0.40 to 0.70; star, 0.70 to 0.90; and circle, 0.90 to 1.39. Each type of shape is presented in the same colored polygon. W-K means K concentration in irrigation water, and W-Na means Na concentration, W-Ca means Ca concentration, W-Mg means Mg concentration, W-Cl means Cl concentration, W-SO4 means SO4 concentration, and W-NO3 means NO3 concentration in irrigation water.

Figure 3.
Effects of increasing irrigation water salinity on: (A) Na, (B) Ca, (C) Mg, and (D) N, (E) C concentrations of leaf; water content (WC) of (F) leaf, (G) stem, (H) seeds, and (I) root; and dry weight of (J) leaf, (K) stem, (L) flower discs, (M) seeds, and (N) roots. ECw is the electrical conductivity of irrigation water.

Figure 4.
Bi-plot from the redundancy analysis (RDA) that shows the relationships between the irrigation water ions and the Na, Ca, Mg, nitrogen (N), and carbon (C) concentrations in (A) leaf, (B) water content (WC), and (C) dry weight (DW) of different organs. P-Na means leaf Na concentration, P-Ca means leaf Ca concentration, P-Mg means leaf Mg concentration, P-C means leaf carbon concentration, P-N means leaf nitrogen concentration. W-K means K concentration in irrigation water, and W-Na means Na concentration, W-Ca means Ca concentration, W-Mg means Mg concentration, W-Cl means Cl concentration, W-SO4 means SO4 concentration, and W-NO3 means NO3 concentration in irrigation water.

© 2019 by the authors. Licensee MDPI, Basel, Switzerland. This article is an open access article distributed under the terms and conditions of the Creative Commons Attribution (CC BY) license (http://creativecommons.org/licenses/by/4.0/).
Share and Cite
MDPI and ACS Style
Li, C.; Zhang, Z. Effects of Ionic Components of Saline Water on Irrigated Sunflower Physiology. Water 2019, 11, 183. https://doi.org/10.3390/w11020183
AMA Style
Li C, Zhang Z. Effects of Ionic Components of Saline Water on Irrigated Sunflower Physiology. Water. 2019; 11(2):183. https://doi.org/10.3390/w11020183
Chicago/Turabian StyleLi, Changsheng, and Zhishan Zhang. 2019. "Effects of Ionic Components of Saline Water on Irrigated Sunflower Physiology" Water 11, no. 2: 183. https://doi.org/10.3390/w11020183
Note that from the first issue of 2016, this journal uses article numbers instead of page numbers. See further details here.