Comprehensive Evaluation of Water Resource Security: Case Study from Luoyang City, China


Business School, Hohai University, Nanjing 211100, China
*
Author to whom correspondence should be addressed.
Water 2018, 10(8), 1106; https://doi.org/10.3390/w10081106
Submission received: 9 July 2018
/
Revised: 13 August 2018
/
Accepted: 18 August 2018
/
Published: 19 August 2018
(This article belongs to the Section Water Use and Scarcity)
Abstract
:The security of water resources is the core content and ultimate goal of urban water resource management agencies. The management of water resources is directly related to the needs of urban residents’ lives and the area’s socio-economic development. How to determine the effective evaluation indicators and methods is an important prerequisite to solving the water resource security problem. This study took Luoyang City as the research area and constructed a water resource security evaluation index system based on pressure-state-response framework. An analytic hierarchy process and entropy weight method were used to determine the index weight. A set pair analysis model was then introduced to evaluate the security of water resources in Luoyang from 2006 to 2016. The results of this study show that the standard of water resource security generally improved in Luoyang in the latter years of the study period. From 2006 to 2008, Luoyang was graded at the Insecurity Level. This compares to a slightly improved grading of Critical Security Level from 2009 to 2016 (except for 2013). However, the overall grade is still low. The pressure on the Luoyang water resource system mainly comes from the development of the urban socio-economy, which in turn has caused problems for both the quantity and quality of water resources. Therefore, a series of countermeasures have been introduced as a means of improving the water resource security of Luoyang, and these measures have achieved certain results. However, further improvements to the efficiency of water resource utilization and strengthening the management and protection of water resources remain necessary.
1. Introduction
Water security is an important component of regional economic development and sustainable development. Water security is also a natural component of comprehensive water resource management [1,2]. Water is widely regarded as the most essential natural resource and a valuable strategic resource. However, water shortages and pollution have exerted a significant negative impact on food security, ecological environmental security and the economic security of various countries around the world [3]. Over the past decade, more than 80 percent of the world’s population has been seriously threatened by a lack of water resources [4]. With population growth, urbanization and public demand for higher living standards, sustainable development around the world is continuously under threat [5]. In this context, research into the issue of water security has gradually become a focal point for governments and non-governmental organizations around the world [6].
Water resource security is an important component of water security [7]. The concept of water resource security was first proposed in the late 20th century. The term generally refers to the harmful contradiction between water supply and demand and the negative impact on social and economic development and human living environment [8]. Water resource security risks mainly arise from the characteristics of regional water resources, such as finiteness, time-space heterogeneity, vulnerability and irreplaceability [9]. In addition, evidence exists that the problems related to water quality are increasing, mainly due to sewage treatment emissions and industrial outfalls [10]. Improving water management is an effective way to solve this problem [11]. Therefore, a timely adjustment of water use strategies is needed to accommodate the increasing complexities in the water resources management system [12]. Researchers commonly believe that it is necessary to ensure both the quality and quantity of water resources. This must be done to meet the needs of human survival and social development, particularly at a certain stage of social and economic development. This means that water resource security is not only an ecological and environmental issue, but also an issue involving social and economic factors [13,14].
At present, academic research of water resource security assessments mainly involves the vulnerability of water resources [15], water poverty indexes [16,17], and water resource carrying capacity [8]. The construction of evaluation indexes has gradually changed from the traditional viewpoint of “water shortages” to the more comprehensive evaluation of water resource security [18,19]. For example, Lautze and Manthrithilake considered five dimensionalities (i.e., basic demand, agricultural production, environment, risk management and independence) in the evaluation of water security in the Asia-Pacific region [20]. Vörösmarty proposed 23 assessment indexes, including watershed disturbance, water resource development, pollution and biotic factors [4]. Wang constructed an evaluation index system from two aspects, namely water resource subsystems and socio-economic subsystems [21]. As for the methods used to evaluate water resource security, the most common evaluation models include the fuzzy multi-attribute decision analysis approach [22], the cluster analysis method [23], the water security status indicators assessment method [24], and the system dynamics model [25].
Existing research provides a certain reference for the evaluation of urban water resource security, but there are also several problems and shortcomings to take into account. Some studies tend to confuse the concepts of water resource security and water security. The evaluation methods are too subjective, and the evaluation indicators ignore the coupling of people, the economy and the environment. In order to solve these problems, we propose a practical method to evaluate water resource security. The main contributions of this paper are as follows: Firstly, based on the pressure-state-response (PSR) model, a water resource security evaluation index system is constructed. Secondly, an analytic hierarchy process (AHP) and an entropy weight method are used to determine the index comprehensive weight. Finally, the water resource security of Luoyang City, from 2006 to 2016, was evaluated by using the principle of set pair analysis (SPA). The advantages of this method are: (1) the structural relationship of the system can be clearly explained; (2) The method is suitable for complex systems with more than three characteristics; (3) The method can effectively analyze and process uncertain information [26]. The SPA method regards an evaluation index and evaluation standard as a set pair and analyzes the “identity, discrepancy and contrary” features of both. The method converts the multi-index evaluation problem of water resource security into an overall measure of water resource security level in a comprehensive index, which in turn is used to evaluate the water security level in Luoyang City.
2. Materials and Methods
The PSR framework was used to establish the “pressure-state-response” water resource security evaluation index system, which covers 21 indicators to reflect the condition of water resource security in Luoyang City from 2006 to 2016.
2.1. The PSR Framework
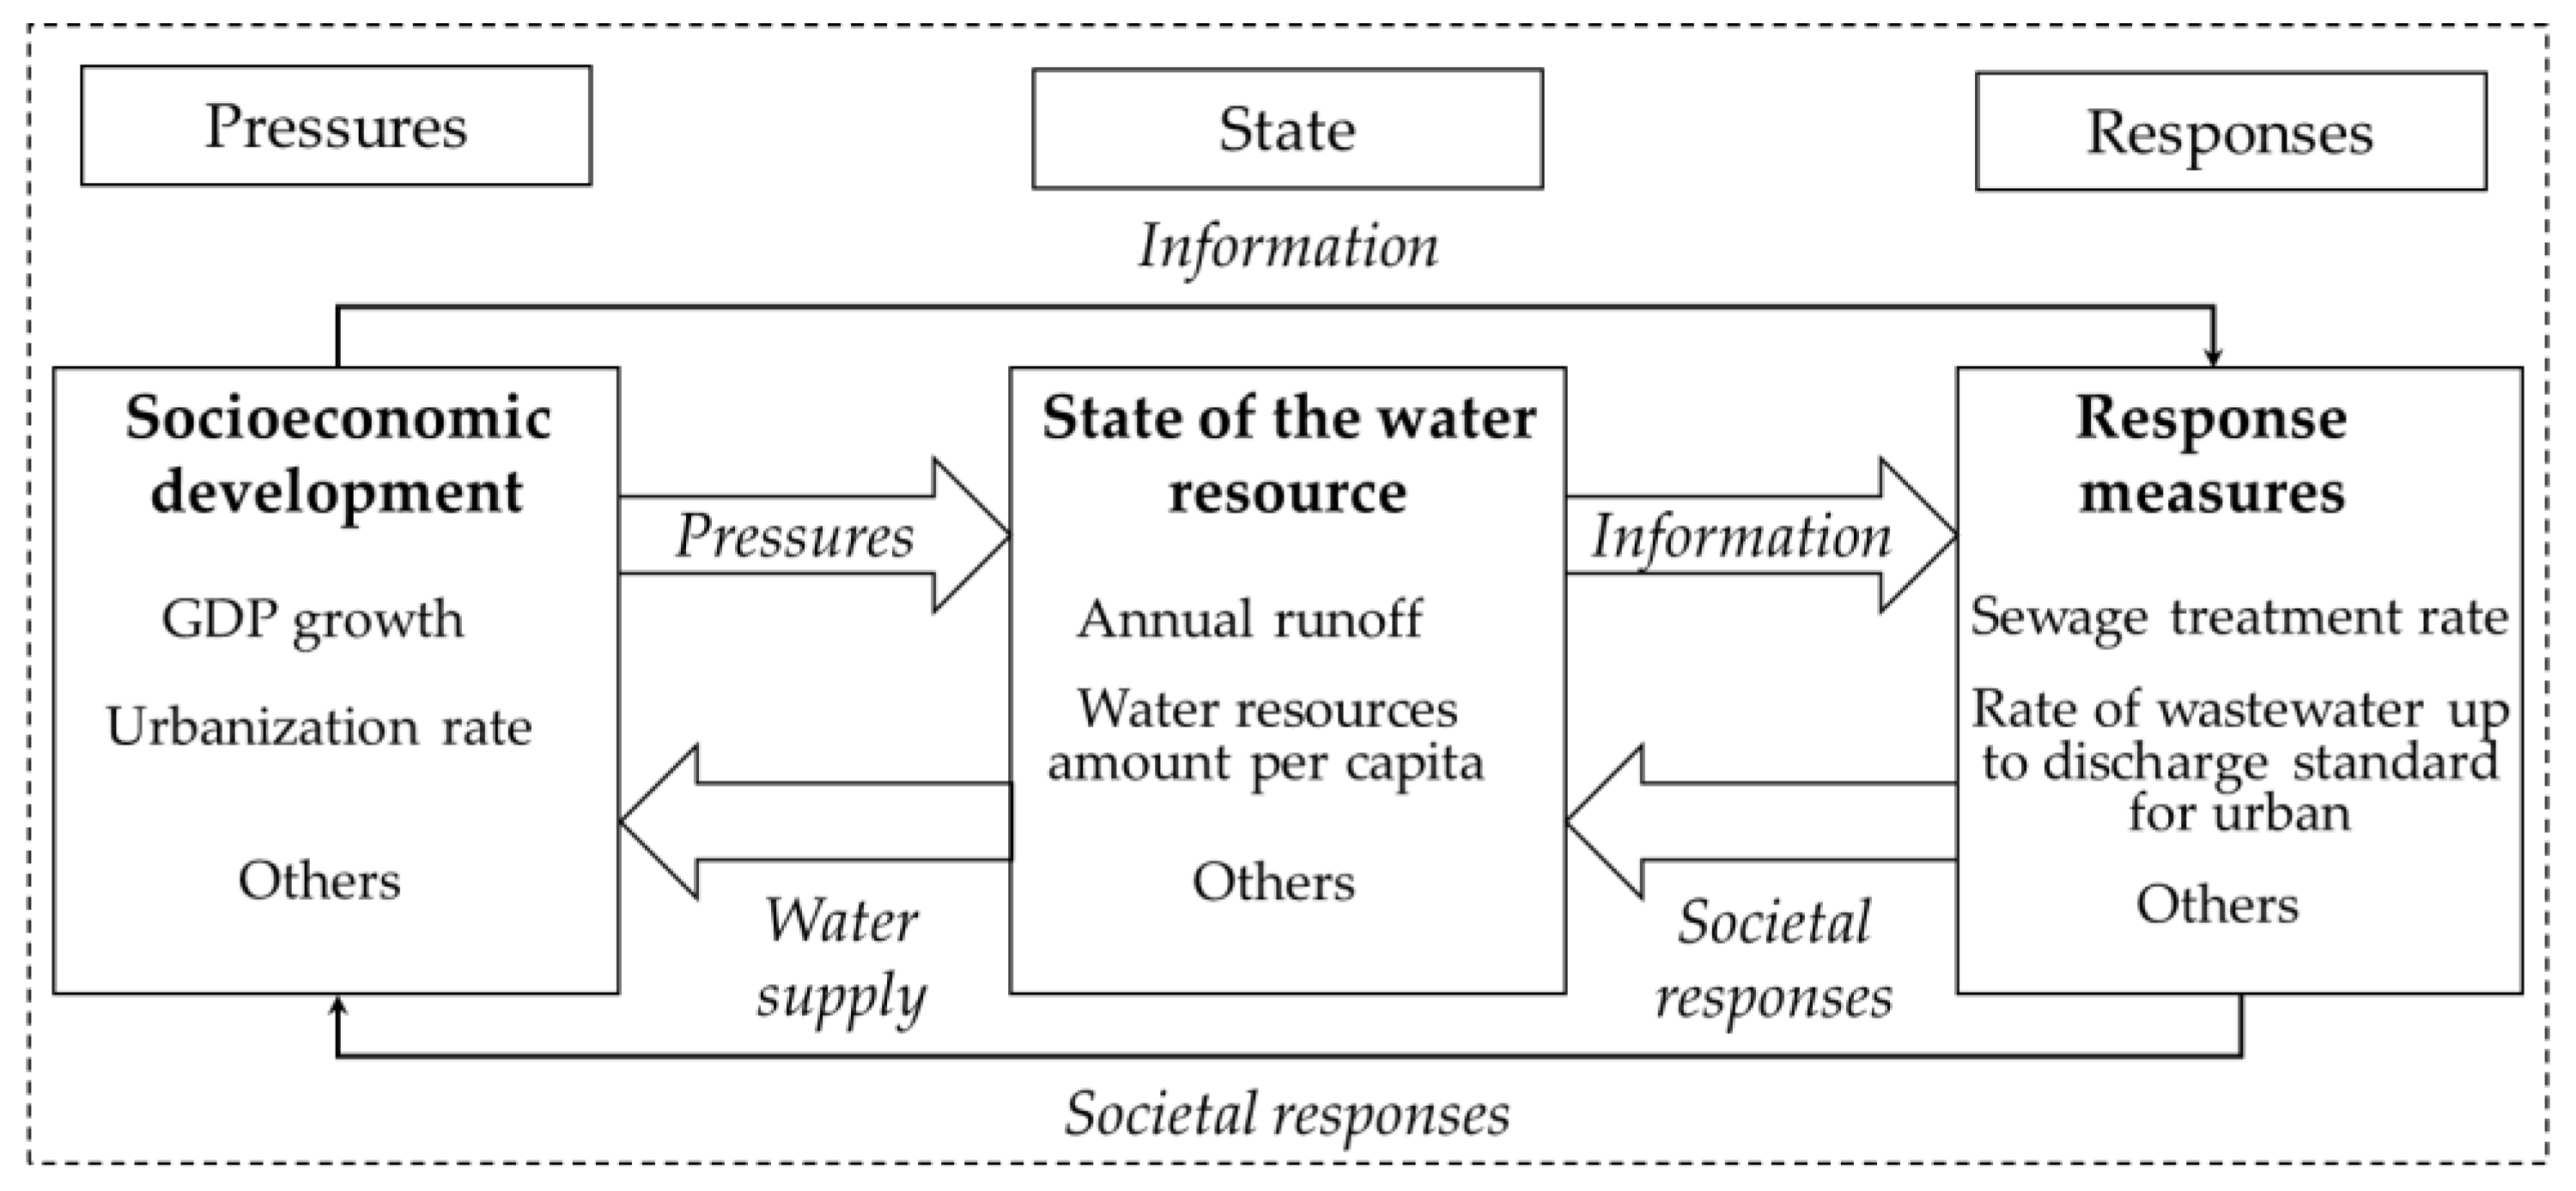
The PSR framework was first proposed by the Organization for Economic Co-operation and Development (OECD) and United Nations Environment Programme (UNEP) at the end of the last century and has been widely applied in research of environmental sustainable development [27,28]. The PSR model considers the interactions and constraints of three aspects that include pressure, state and response [29]. It adequately illustrates the pressures on water resources caused by socioeconomic development, the maintained state of the water resources system, the dynamic response of human society, and the effects on the relationship between the structure and dimensions of the water resource security system [30]. Here, the water resource security pressure subsystem reflects the pressure and negative influence caused by growth in both the economy and the population, as well as the resource consumption and environmental damage to a water system in a certain period of time. The state subsystem is a comprehensive reflection of the overall situation of water resources under the pressure imposed by human activities. The response subsystem mainly refers to a series of protection and management measures taken by human society against water resources pressure, in order to promote the sustainable utilization of water resources. From this point of view, pressure, state and response are three subsystems which are independent and interrelated to each other. The PSR water resource security evaluation framework structure is shown in Figure 1.
The selection of evaluation indicators should be based on the same criteria and principles. Indicators should also have certain connectivity and relevance, so as to divide indicators into a unified framework. The water resource security evaluation index system of Luoyang City is shown in Table 1. The factor layer is mainly composed of pressure subsystem (B1), state subsystem (B2) and response subsystem (B3). The indicators (C1 to C21) were determined after full consideration of the current socio-economic situation and the status of the water resources system in Luoyang. Moreover, the determination of the security standard for the evaluation index was an essential step in creating the full water resource security assessment system. In this work, the threshold value of water resource security was determined by historical reference data, along with related research results [31,32,33], as shown in Table 2.
2.2. Description of Study Area
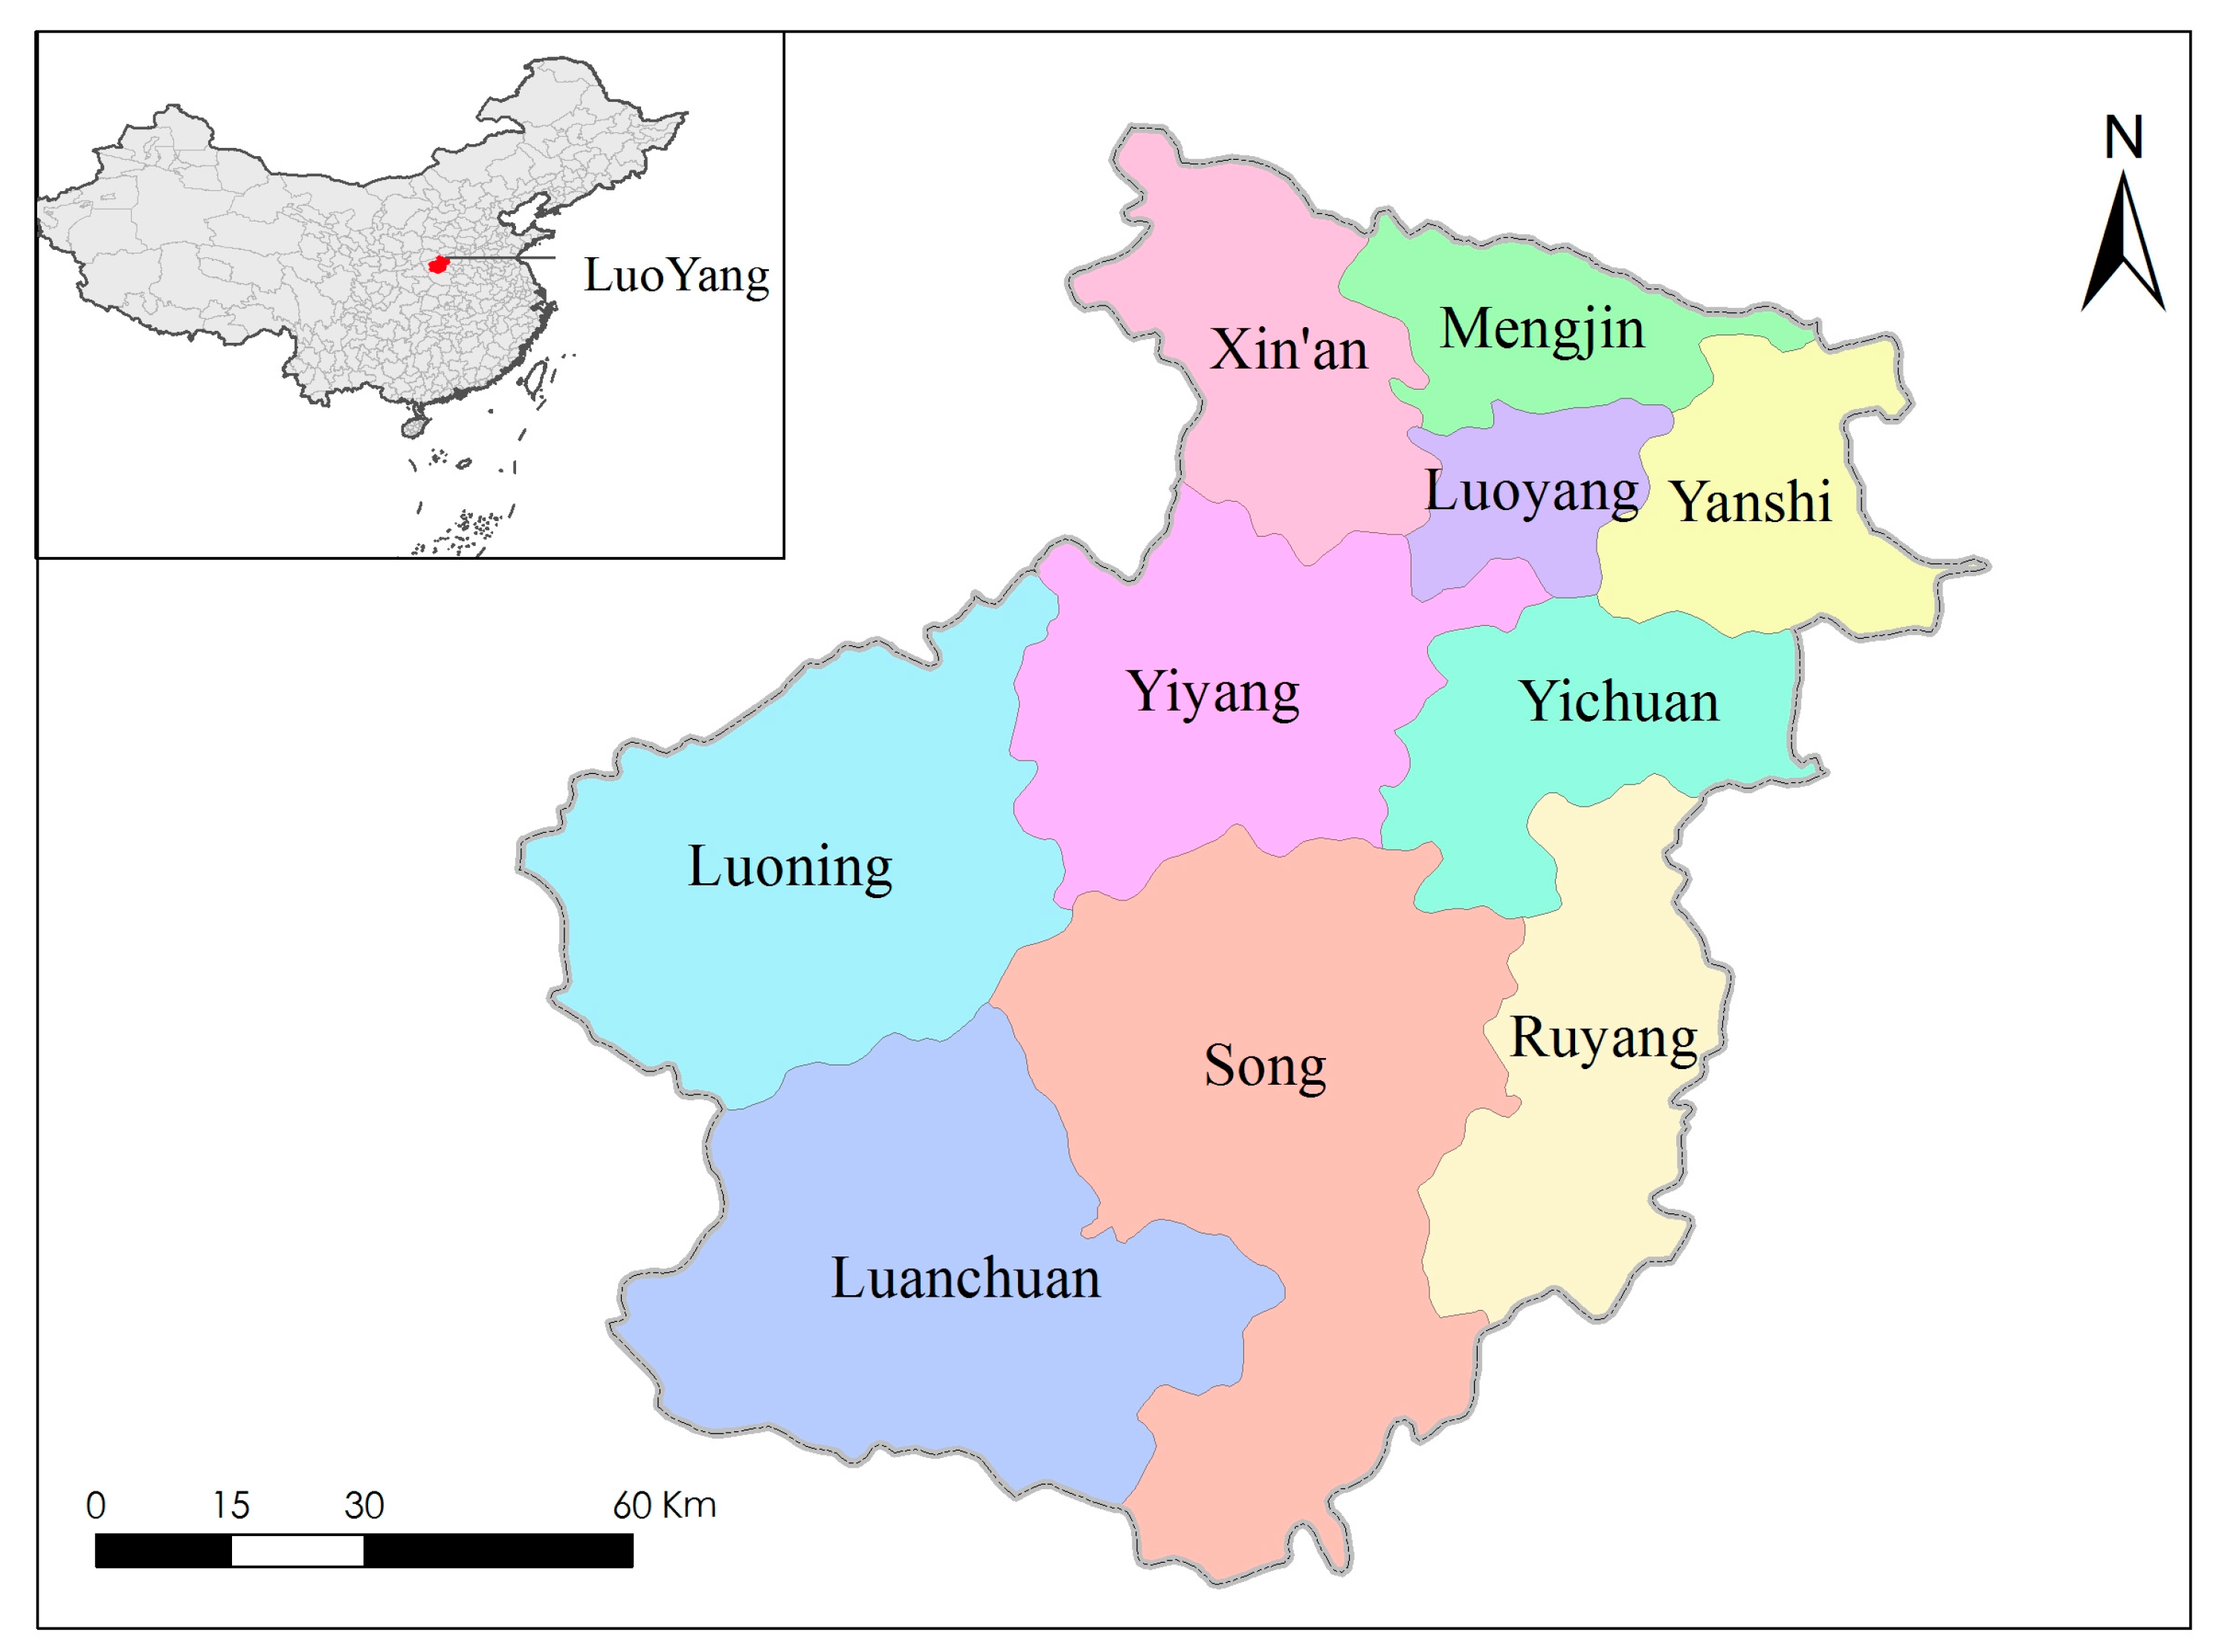
Luoyang is located in middle reaches of the Yellow River, in Henan province. It covers a total area of 15,230 square kilometers and lies between E 112°16′–112°37′ and N 34°32′–34°45′ (Figure 2). Luoyang had a total population of 7.05 million, an urbanization rate of 54.35%and a forest coverage rate of 49.20% in 2016 [34]. The annual average water resources totaled 2.809 billion m3, with less than 450 m3 per capita, roughly the same as the provincial average, is about 1/5 of the national average [35]. Especially in recent years, the water resources in Luoyang City have been greatly reduced. Therefore, the security problem of water resources, especially the gap between water supply and demand, has seriously affected eco-development and economic-social development in Luoyang City.
2.3. Data Source
Considering the data availability, the research period we selected was from 2006 to 2016. The data used in this paper are all from the Luoyang Statistical Yearbook (2007–2017) published by the Luoyang Statistics Bureau [34], the Henan Water Resources Bulletin (2006–2016) published by the Water Resources Department of Henan Province [35].
2.4. Methods
A comprehensive weights method was used to determine the weight of each indicator, and a SPA model was used to determine the security grade of water resources in Luoyang City. The modeling procedure is described in the following section.
2.4.1. Comprehensive Weights
Currently, there are many methods that can be used to evaluate the weight of indicators. According to the different sources of original data and the calculation process, these methods can be roughly divided into two categories. One category is the subjective assignment method, and the other is the objective assignment method.
The subjective assignment method is a method whereby decision analysts or experts assign values representing their assessment of the state of each attribute. The most widely used version of this method is the AHP method [36]. To a certain extent, this method can effectively determine the order of the weight coefficient given by each index according to the degree of importance. However, this method has much discretionary subjectivity. In view of the fact that AHP is widely used in weight determination (as is significantly detailed in many studies), we do not list the specific calculation formulae in this paper. It is assumed that in the assessment of water resource security, the weight of each evaluation index is by using AHP.
The objective assignment method refers to the method of determining the weight simply by using the objective information of the attributes. Here, the entropy weight method is more useful [37,38]. The results of this method are objective, but they cannot reflect the knowledge and experience of experts or the opinions of decision makers. Entropy can be used to measure the information contained in the index data and determine the weight of each index. It is assumed that in the evaluation of water resource security, the weight of each evaluation index is when using the entropy weight method. The main steps are as follows:
- (1)
- Construct the judgment matrix. With n evaluation objects of sample set x, each sample has r indexes, which are composed of the original data matrix. The expression is:
- (2)
- Standardize the original data matrix. Due to the fact that the contestant indexes have different properties and dimensions, before evaluation, the dimensionless treatment of the positive index (Equation (2)) and negative index (Equation (3)) is carried out, in order to ensure that the actual value of each index becomes the standard value on the interval [0, 1].where is the survey maximum value, is the survey minimum value.
- (3)
- Calculate the entropy and weight of the indicator. When the system is in r different states, the probability of each state is , and the entropy of the system is E (Equation (4)). When is equal, the conditional entropy is the largest (extremum property), namely , then, the entropy (Equation (5)) and weight (Equation (6)) of the evaluation index to the evaluation object can be determined.where , = 1, , , and . Simultaneously assume that when , .We combine the advantages of the AHP and entropy weight methods and compute the comprehensive weights (the average of the AHP and entropy weights) as:
2.4.2. SPA Model
The SPA theory was first proposed in 1989. After nearly 30 years of development, this theory has been combined with other theories and widely used in the field of hydrology and water resources [39,40,41,42]. The central idea of the theory is to analyze and deal with the relationship between the certainty and uncertainty of objective things as a certain and uncertain system. Let Set A and relative Set B be a set pair H = (A, B) which has N properties, where S features are common to A and B in set pair H, and P features are opposites. The other features of F = N − S − P are neither opposites nor common. The ratios of S/N, F/N and P/N are the identity degree (a), the discrepancy degree (b) and the contrary degree (c) of these two sets, respectively, and the connection degree is defined as:
where is the connection degree that meets , is the difference grade value, and are the mark and coefficient of the discrepancy degree and the contrary degree. Where , the value of depends on different conditions, and generally takes the value of −1 [43]. The application steps are as follows.
- (1)
- The construction of the set pair: When the SPA method is applied to the evaluation of water resource security, it is to form a set pair (H) comprised of urban water resource security evaluation index set (A) and evaluation standard set (B). By comparing the value of each index in set A with the evaluation standard value in set B, we can evaluate regional water resource security. As a whole system, the water resources system is divided into the following security levels: Security (Grade 1), Moderate Security (Grade 2), Critical Security (Grade 3), Insecurity (Grade 4), and Absolute Insecurity (Grade 5).
- (2)
- Calculate the connection degree. Since the standard boundary has fuzziness, the connection degree () is calculated using the fuzzy analysis method. The expression is:For the positive index, the connection degree between and its first-grade standard is:where .For the negative index, the connection degree between and its first-grade standard is:where .
- (3)
- Calculate the total connection degree and determine the security grade.
Since we divide water resource security into five grades, the total connection degree of set pair H(A, B) can be determined.
where ; ; ; ; .
In order to avoid the problem of the value of the difference uncertainty coefficient , the confidence criterion was adopted to evaluate the water resource security level. The expression is:
where, is the cumulative connection degree, is the confidence degree. In general, the value of ranges from 0.5 to 0.7. [33]. The higher the value of , the more conservative is the evaluation result. This study takes the value of as 0.6. The evaluation grade of regional water resource security can be determined by Formula (13), which means that the sample belongs to , corresponding to .
3. Results and Discussion
We collected evaluation index data from 2006 to 2016, for Luoyang. After analysis and arrangement, we used the comprehensive weights and SPA methods to evaluate the security status of water resources in Luoyang. The specific results are detailed in the following section.
3.1. Results of Comprehensive Weights
According to the relative importance of the index from C1 to C21, the weight value of each index as determined by AHP is obtained. The results are shown in the part of Table 3. In Equations (1)–(6), the weight of each index is calculated using the entropy weight method, and the results are shown in the part of Table 3. In Equation (7), the comprehensive weight of each index is obtained, as shown in the part of Table 3. Also, the weights of the pressure, state, and response subsystems are shown in the factor part of Table 3.
The results show that the response subsystem has the largest weight, reaching 0.4112. This indicates that the response subsystem is a key influencing factor in water resource security and a direct and effective measure that can be used to improve the level of urban water resource security. The weight of the pressure subsystem is 0.3519, which is a direct cause of the hidden dangers in the water resource system. The state subsystem has the smallest weight, which is 0.2368. This subsystem is the basis for improving the security grade of urban water resources, and therefore, we should also pay attention to this subsystem.
3.2. Comprehensive Evaluation of Water Resource Security in Luoyang
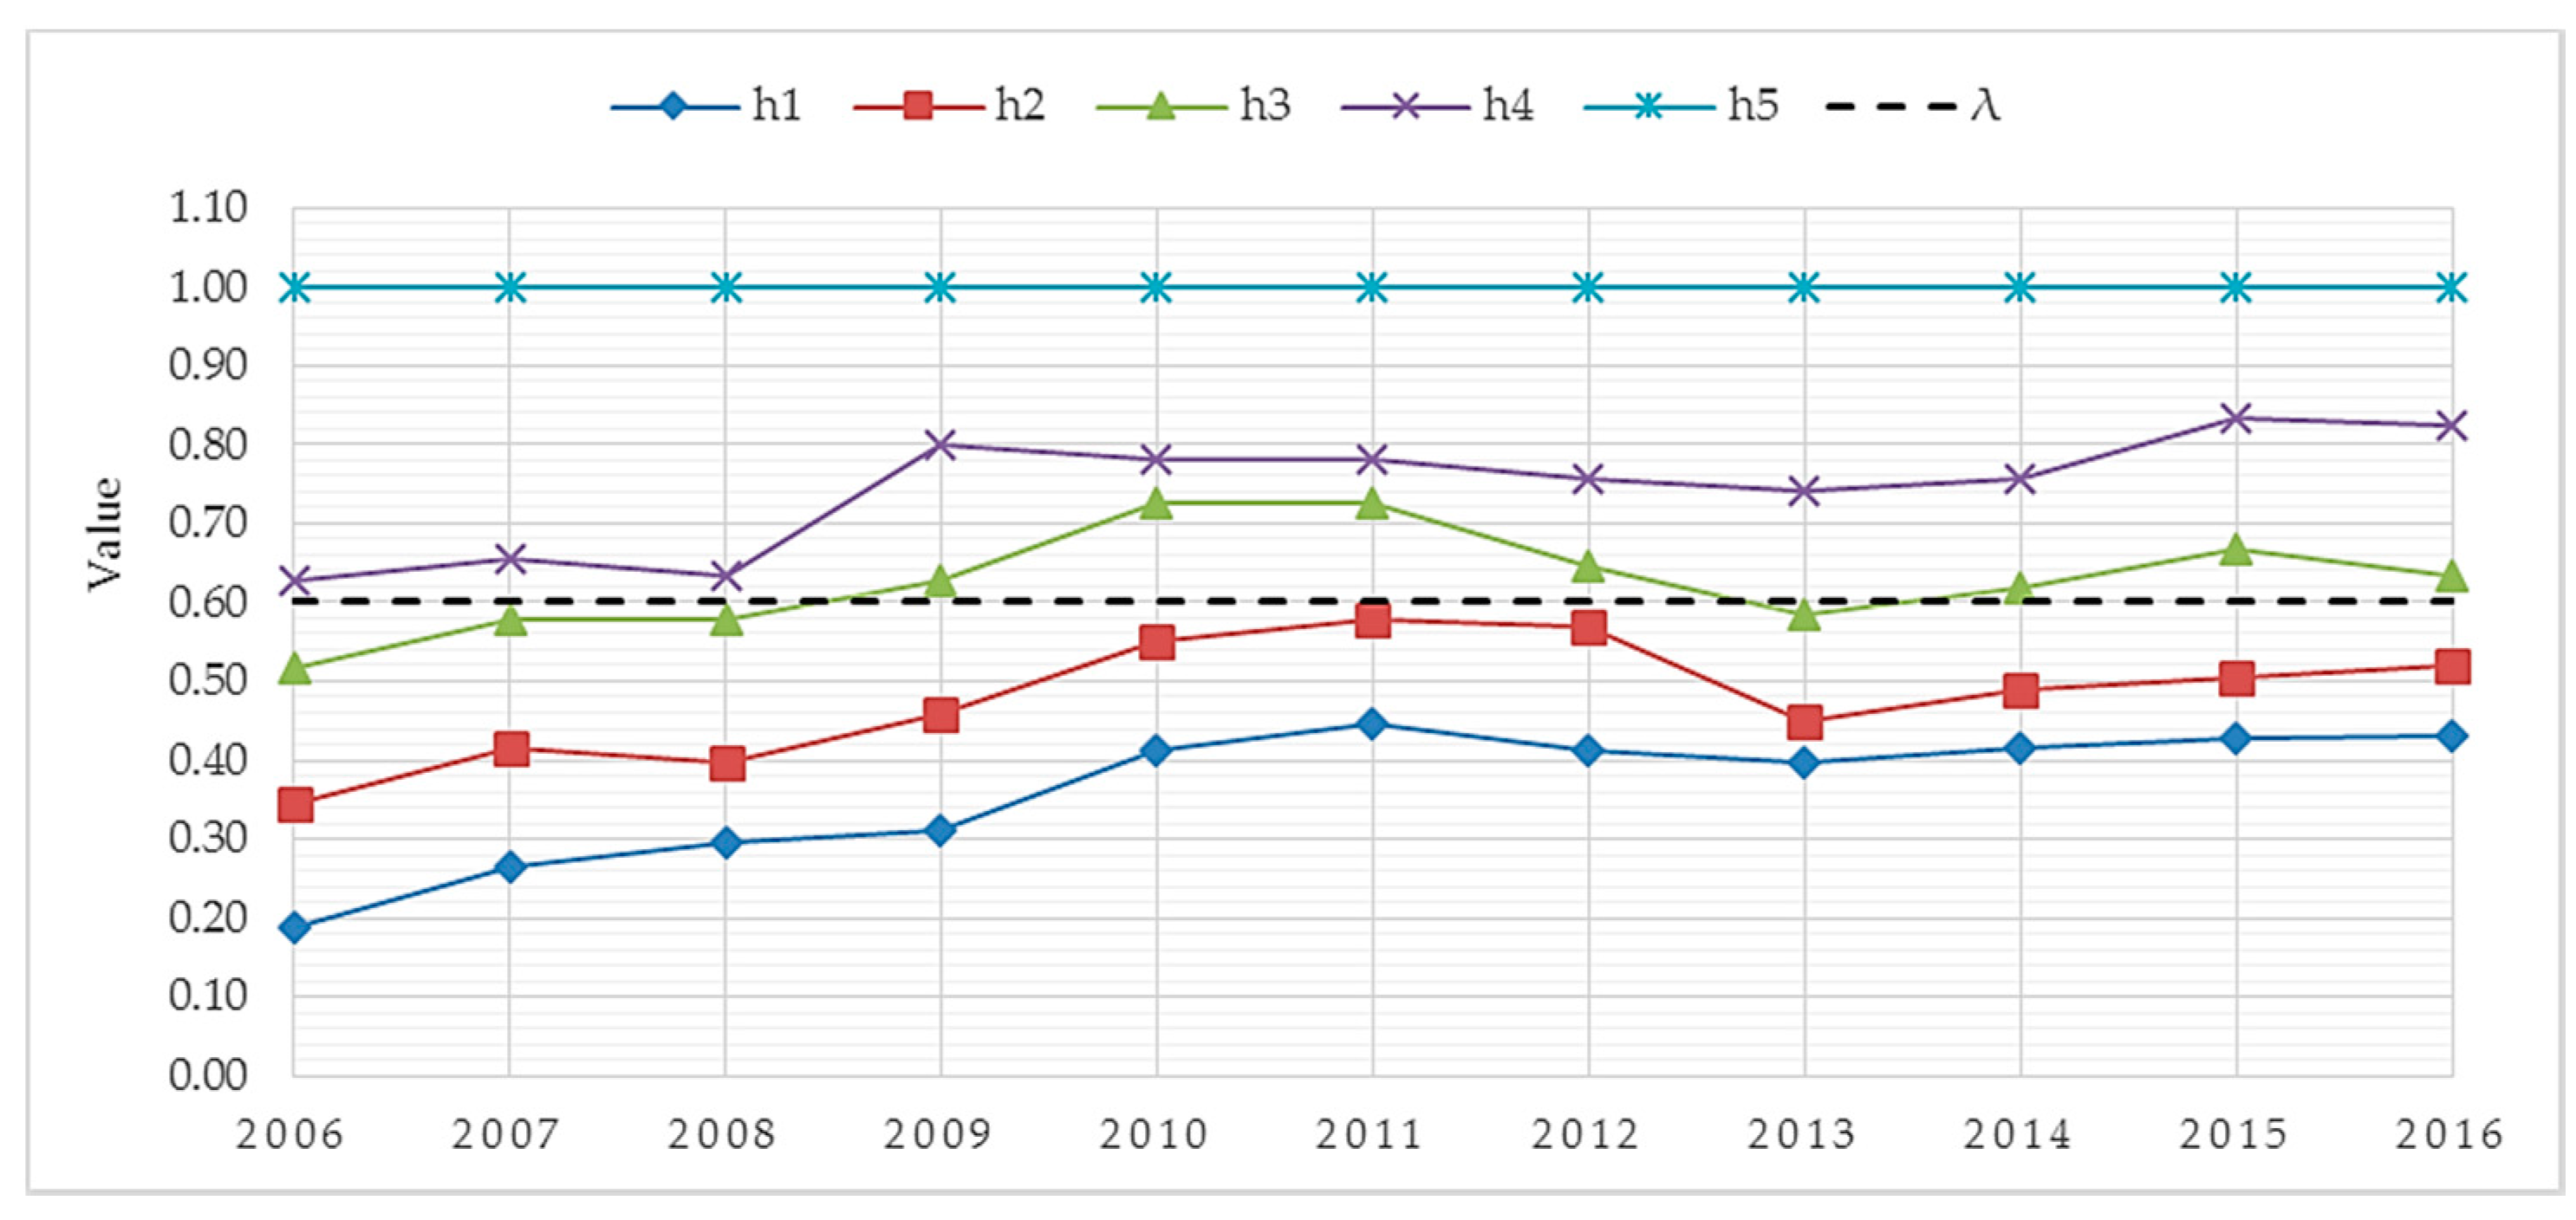
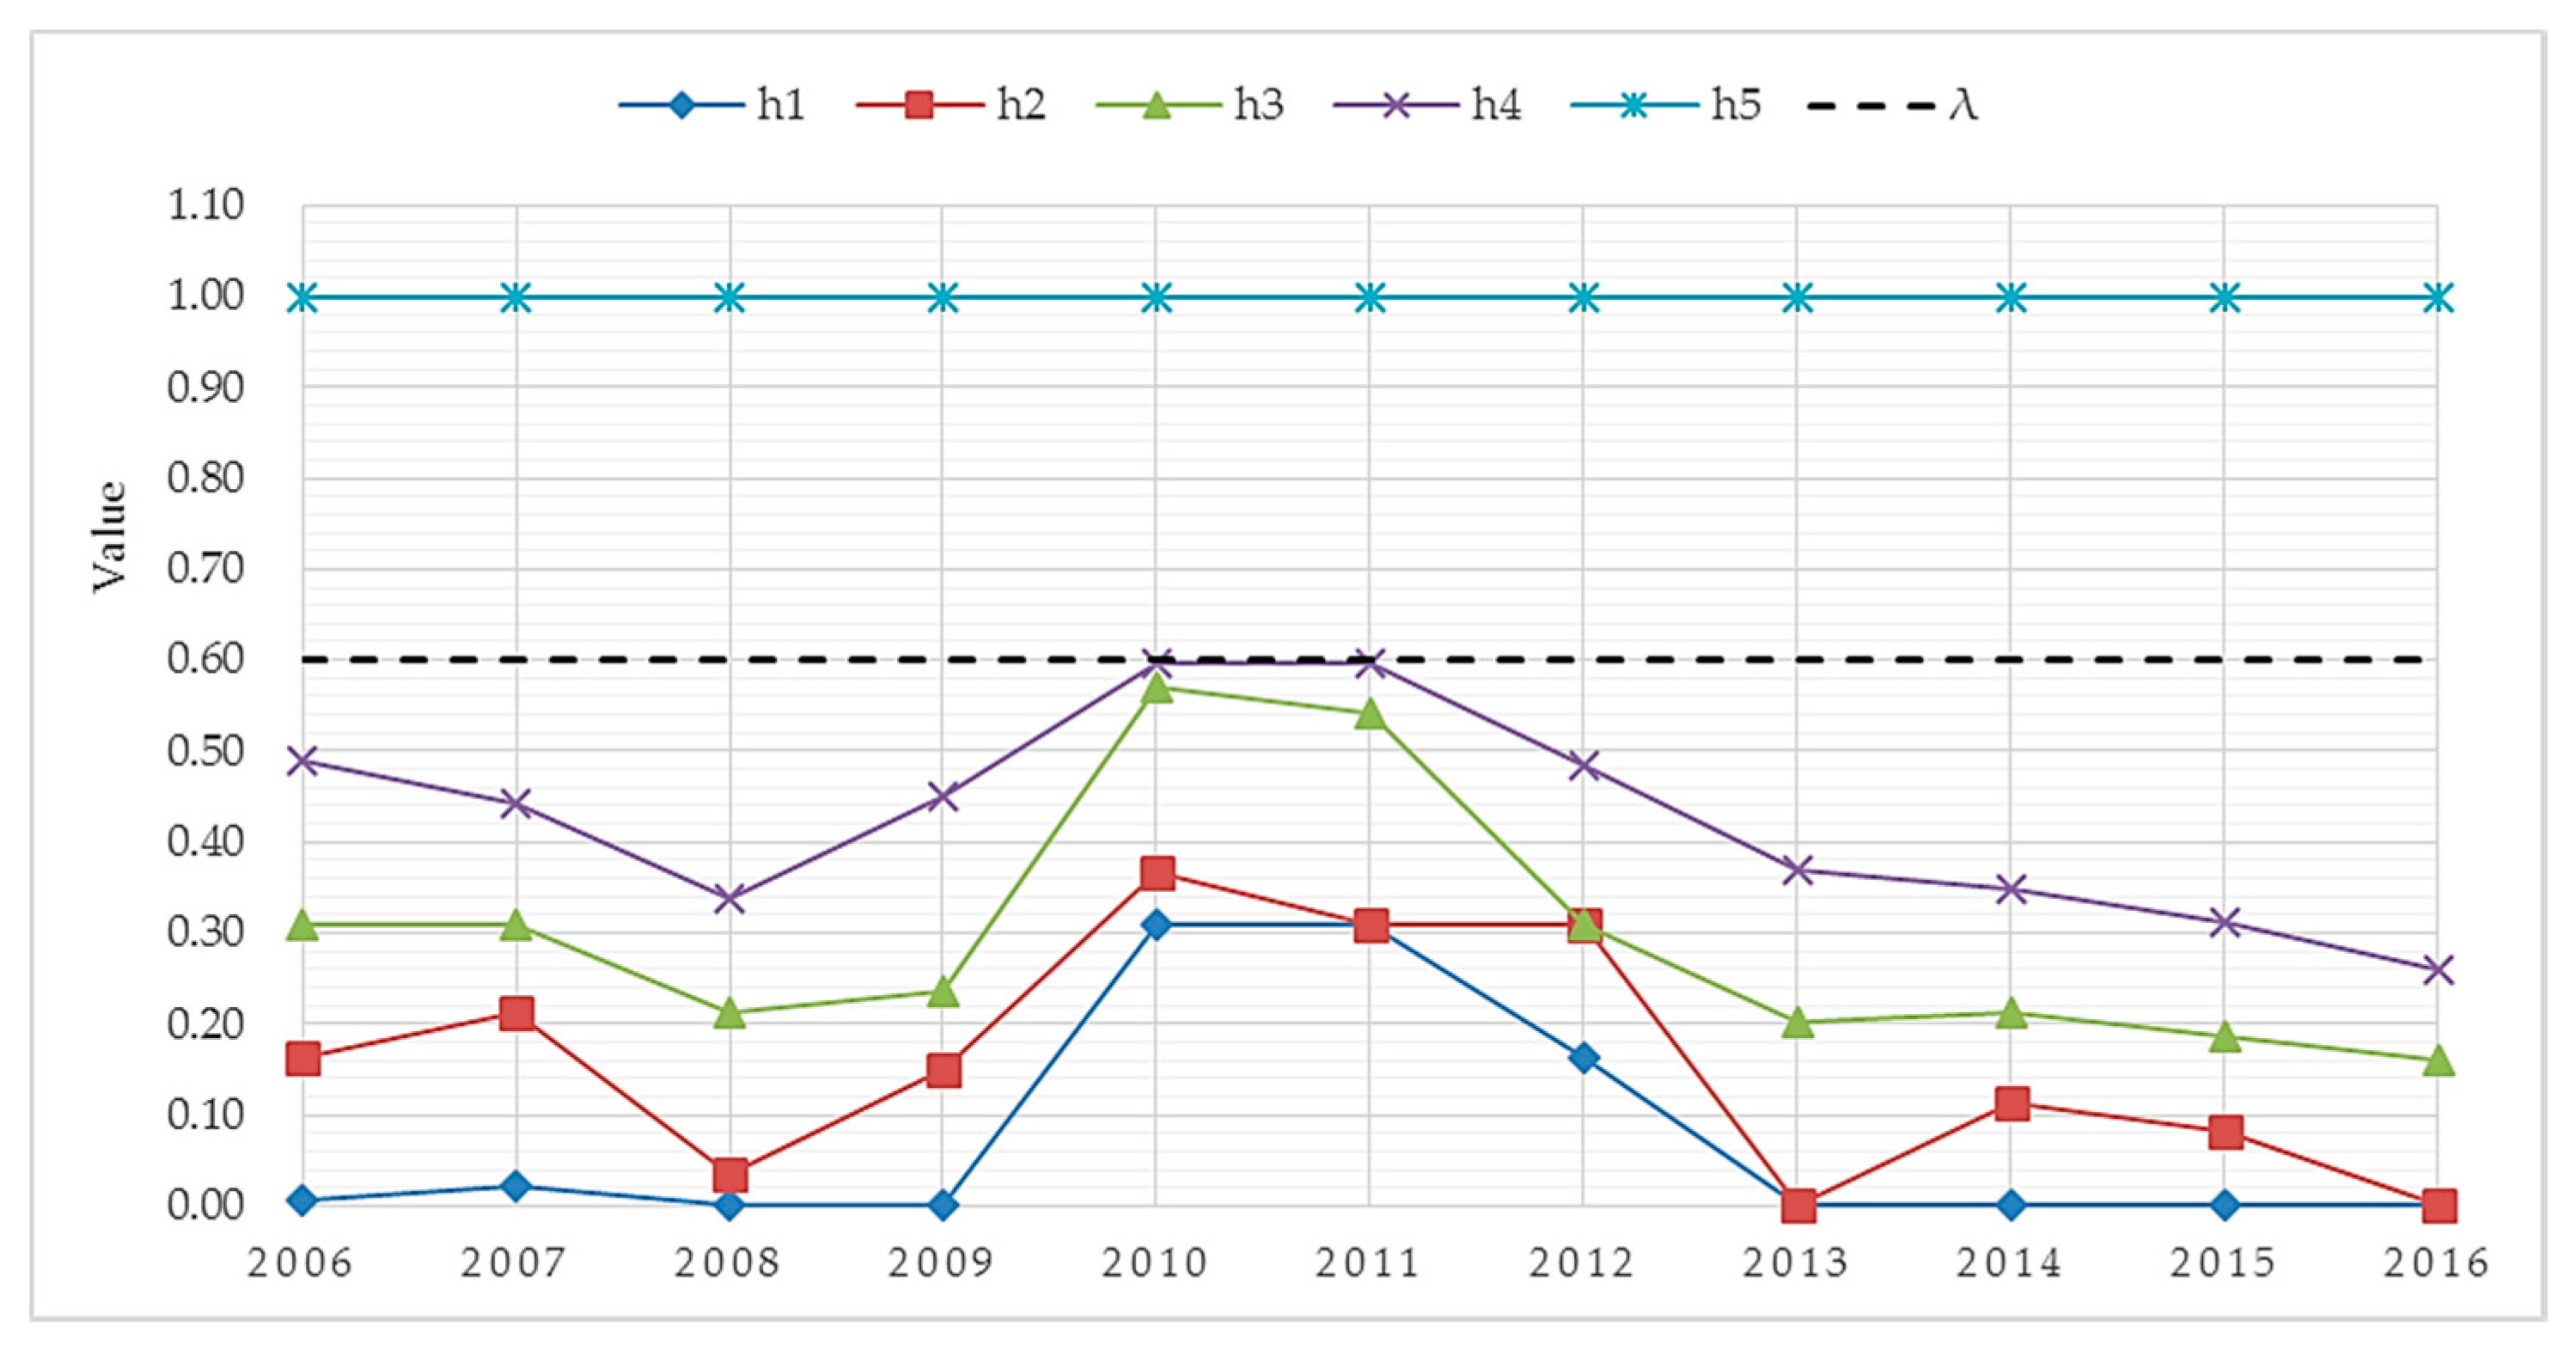
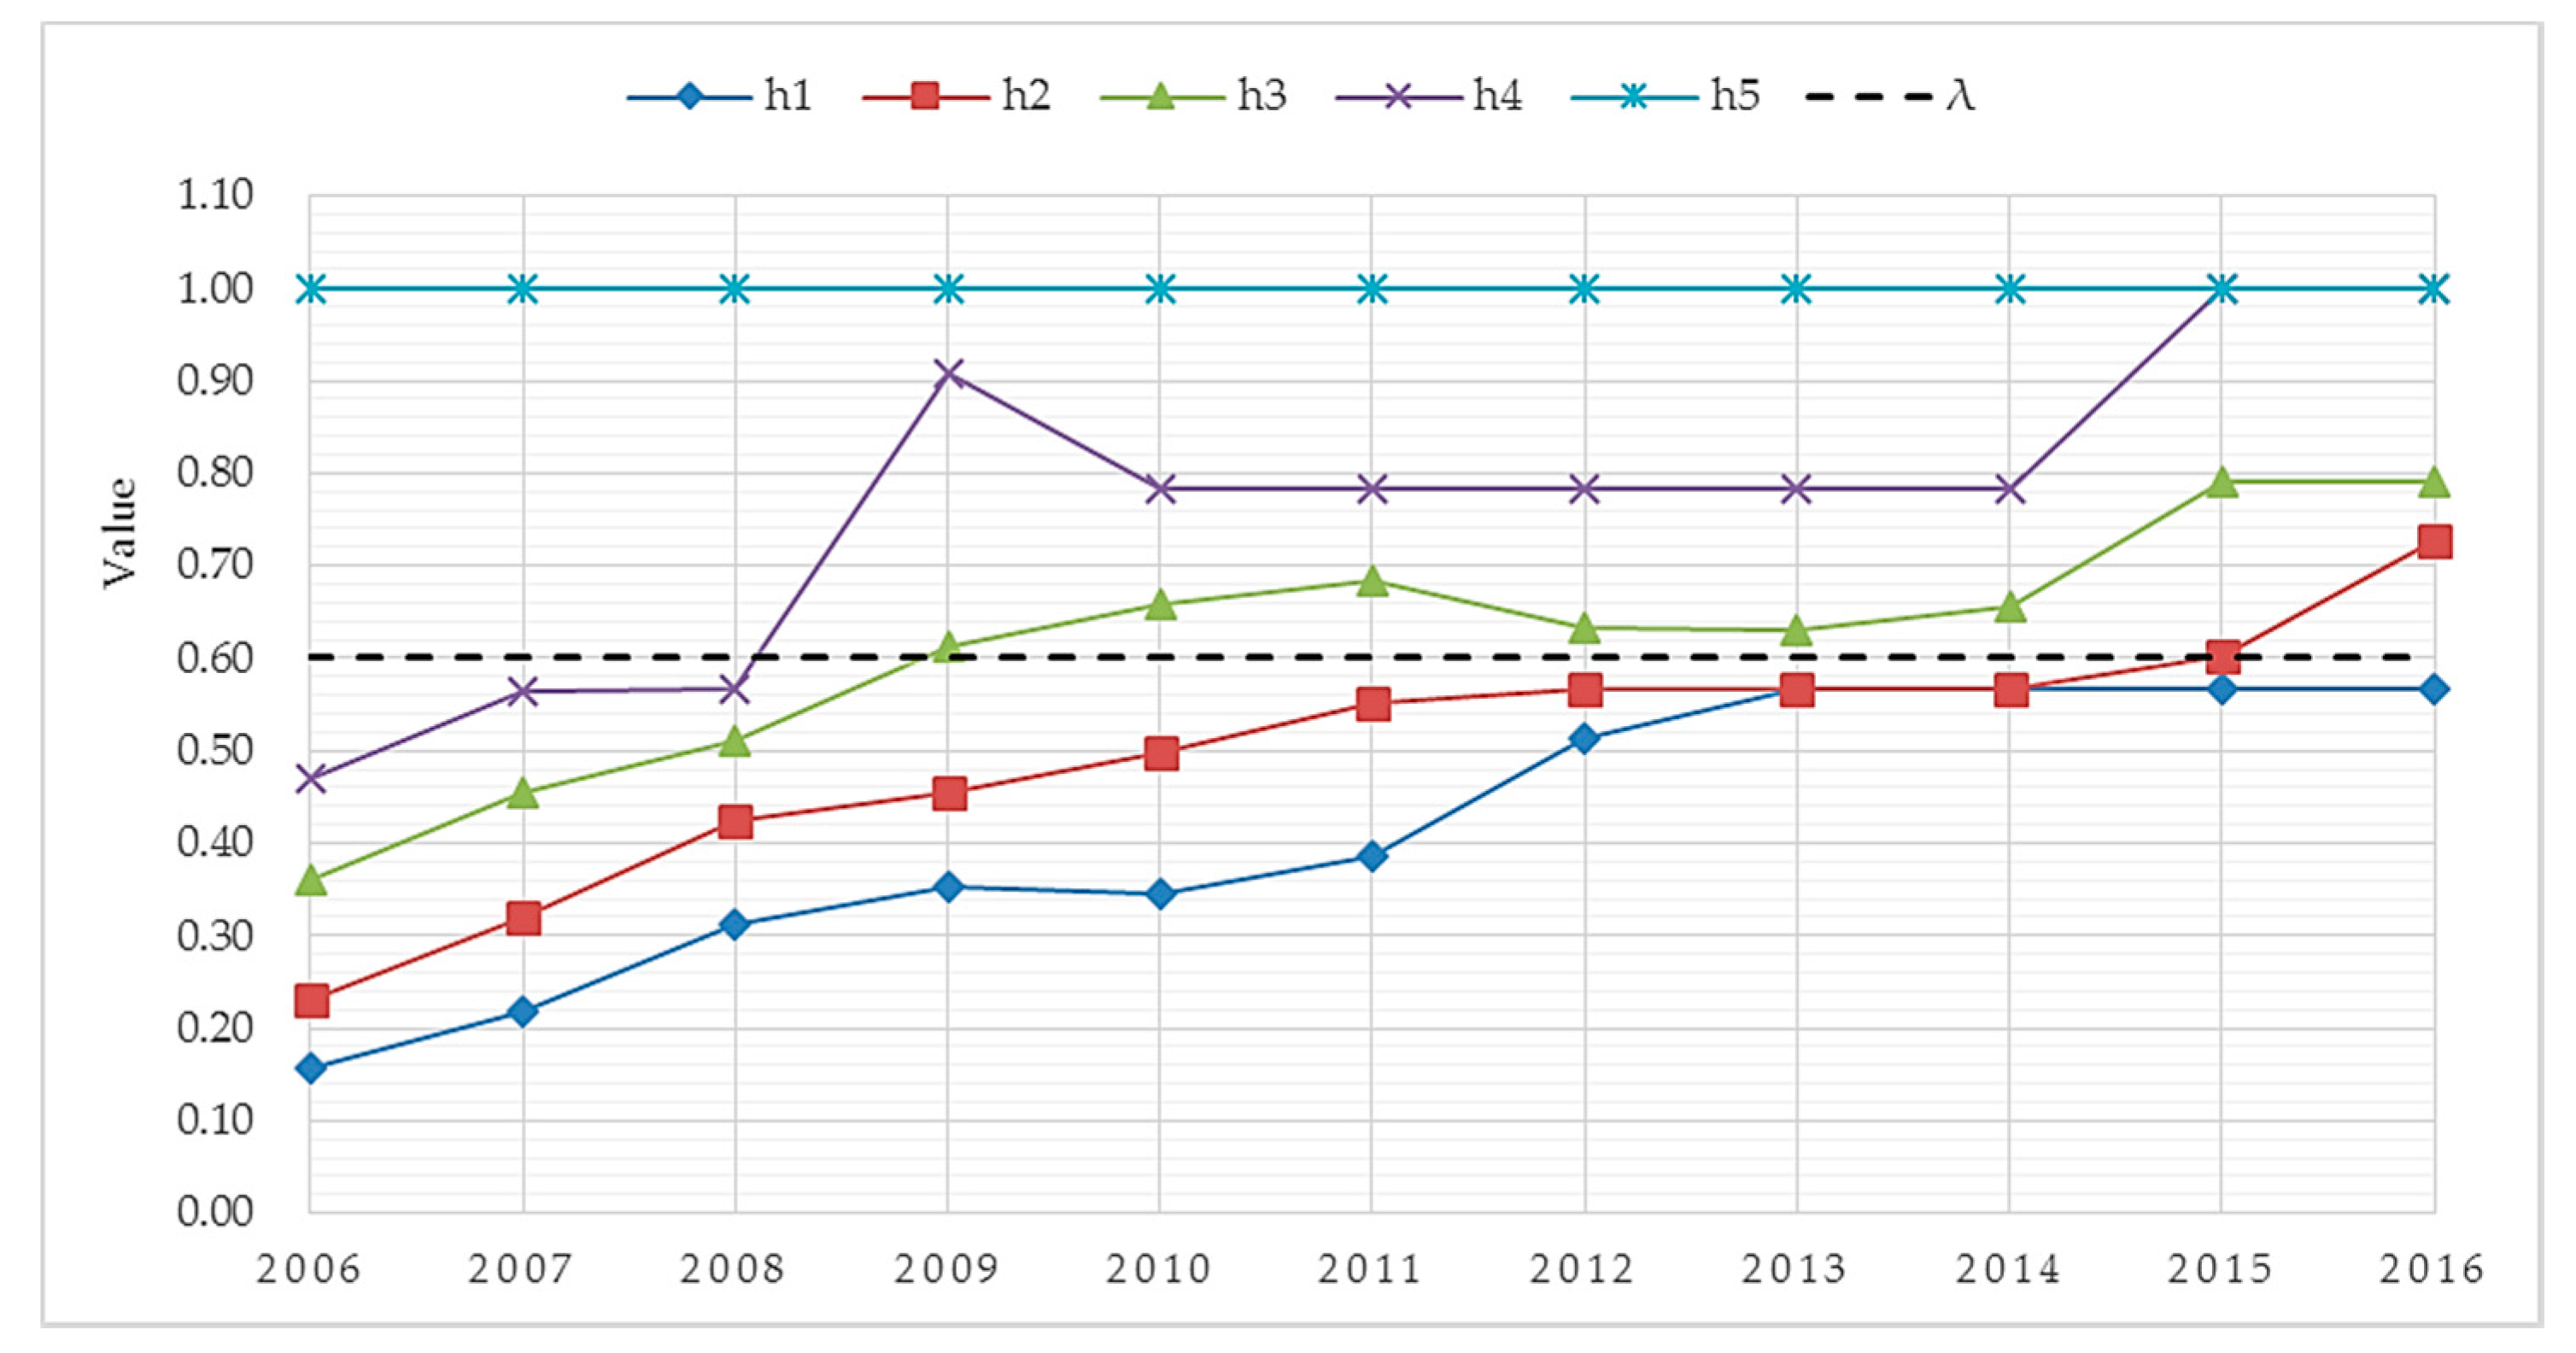
According to Equations (8)–(12), the total connection degree can be obtained. On this basis, according to Equation (13), the cumulative connection degree can be obtained. Also, the security grade is determined by the index that is greater than the specified lambda (in this case 0.6), as shown in Table 4 and Figure 3. We can see that the security grade in Luoyang from 2006 to 2008 was Grade 4, and that this increased to Grade 3 between 2009 and 2016 (except in 2013).
3.3. Evaluation of Every Subsystem
Consistent with the calculation process of a comprehensive assessment of water resources security, the total connection and security grade values of PSR subsystems are shown in Table 5.
3.3.1. Evaluation of Pressure Subsystem
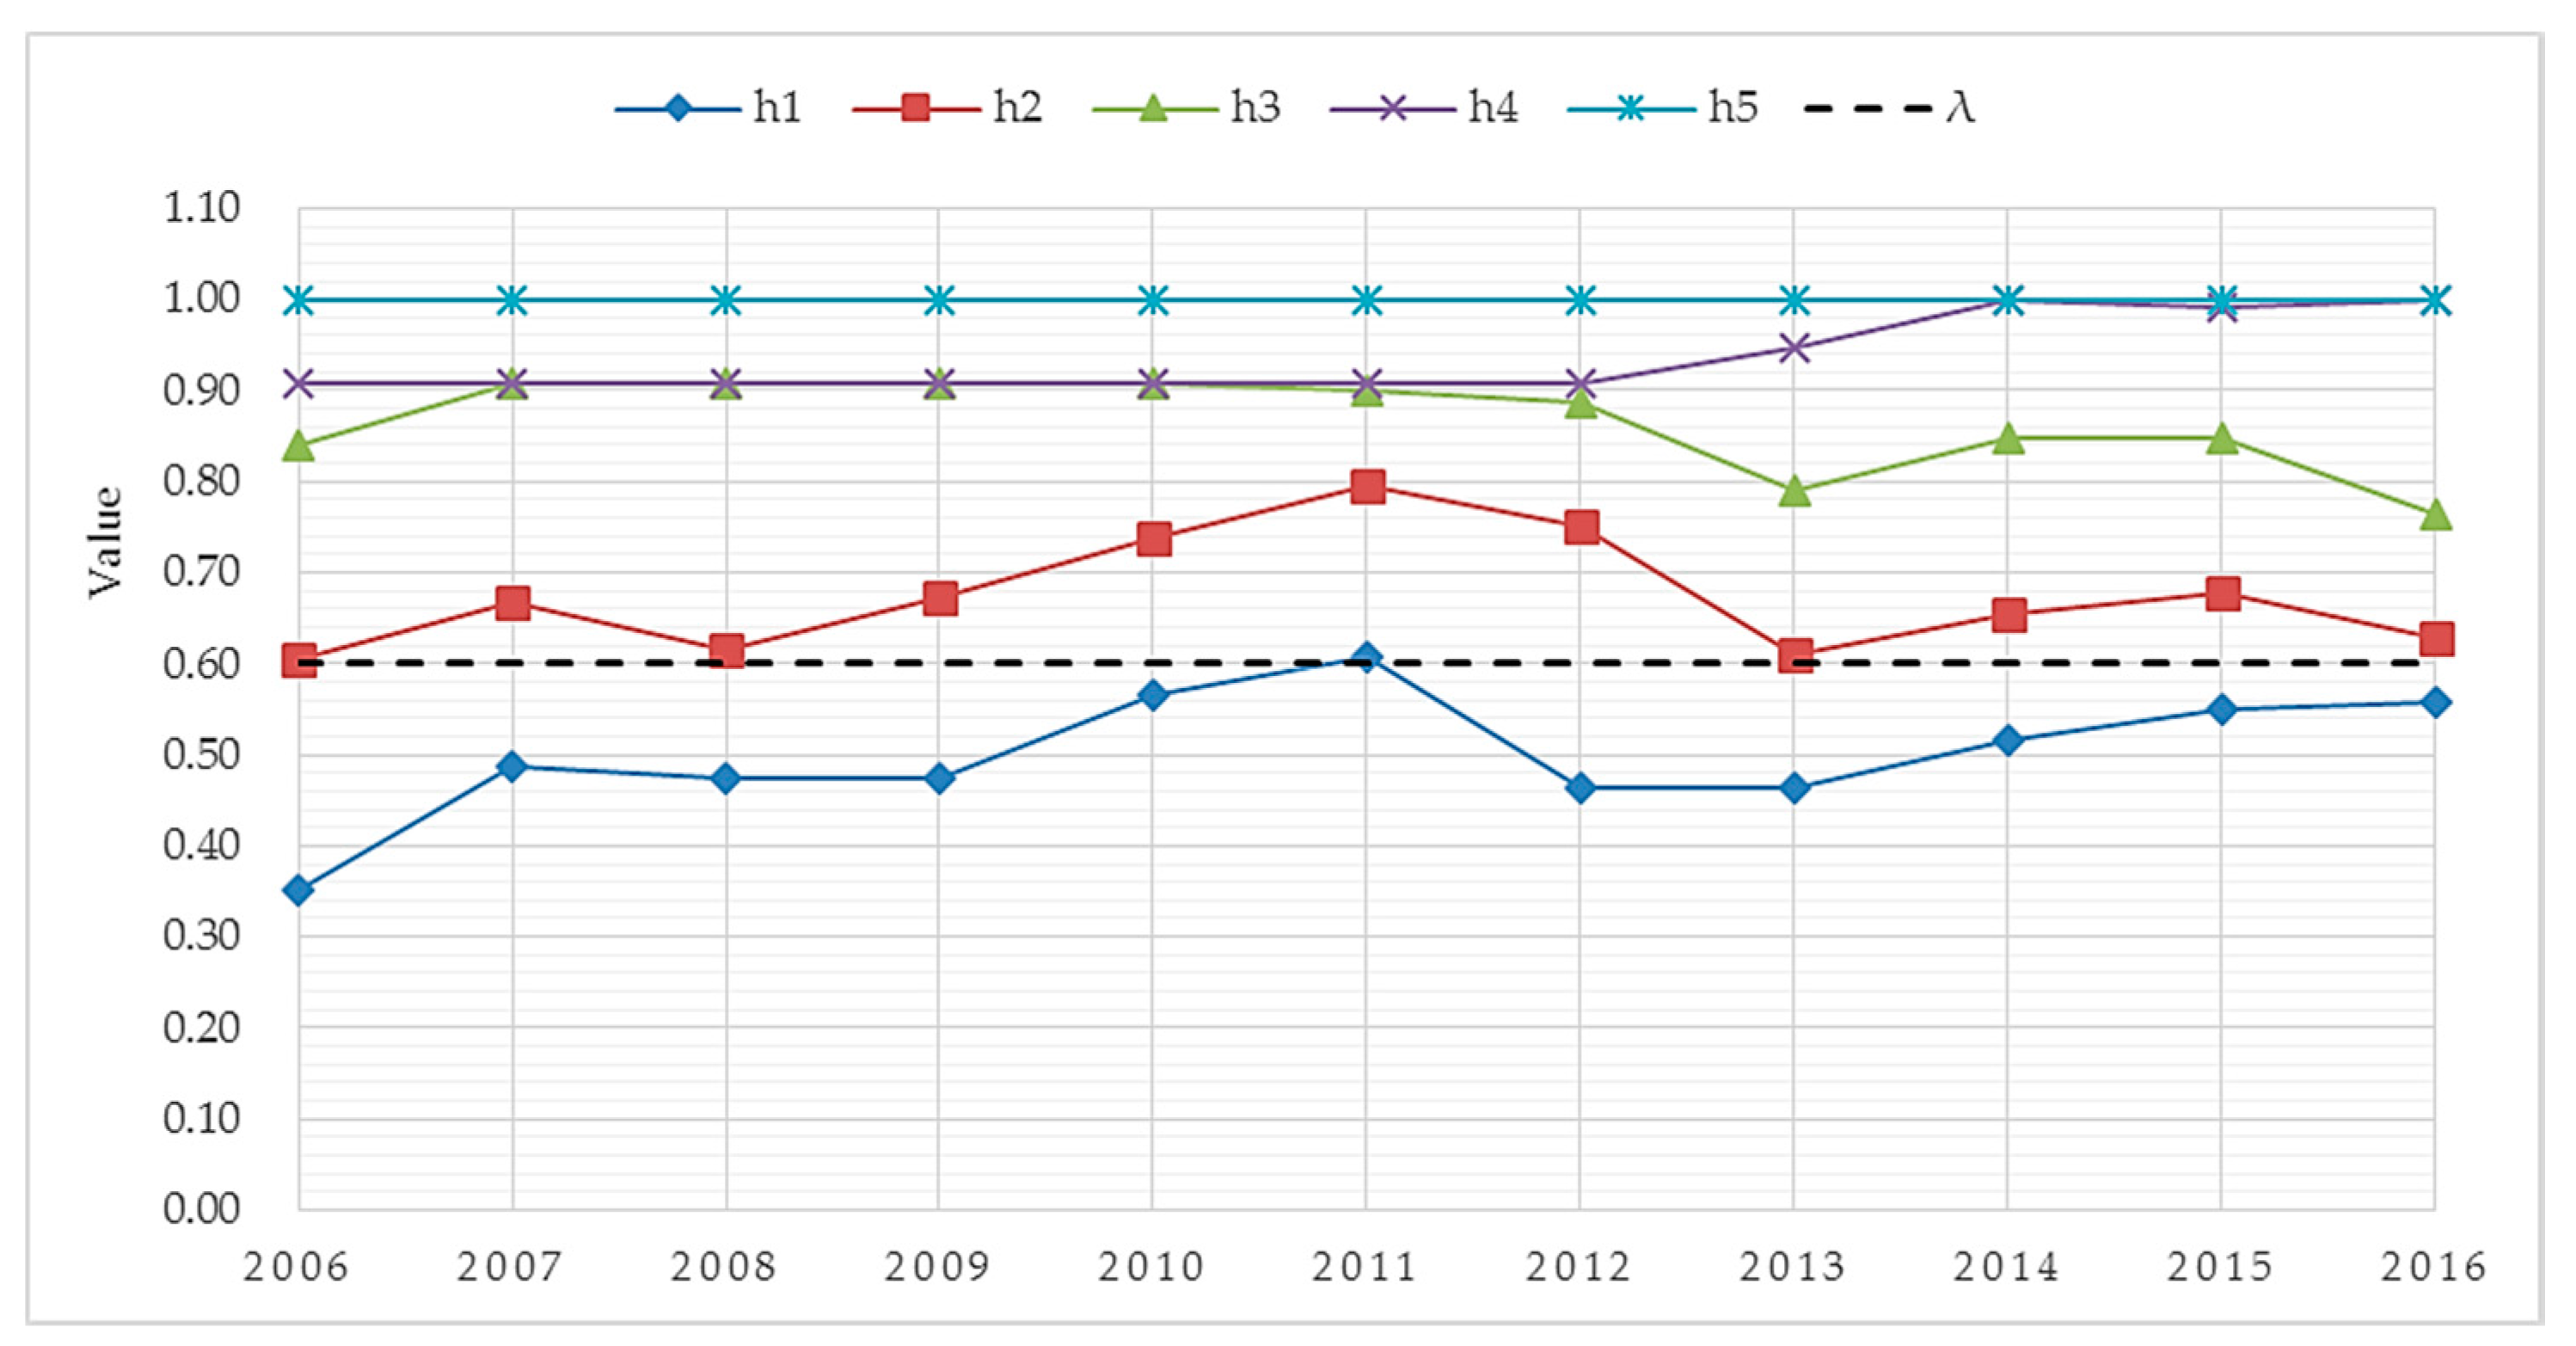
The trends of the cumulative connection degree in the pressure subsystem of water resource security evaluation are shown in Figure 4. As can be seen, the security rating remained at Grade 2 before 2011, and reached its optimum value in 2011, when the security state changed from Grade 2 to Grade 1. However, after this, the security state of this subsystem reverted back to Grade 2 again, and then reduced to the thresholds of Security and Moderate Security in 2013 and 2016, respectively. As a whole, the security state of the pressure subsystem is good, but a downward trend has been evident since 2011. This means that the pressure on water resource security in Luoyang will likely increase in the near future.
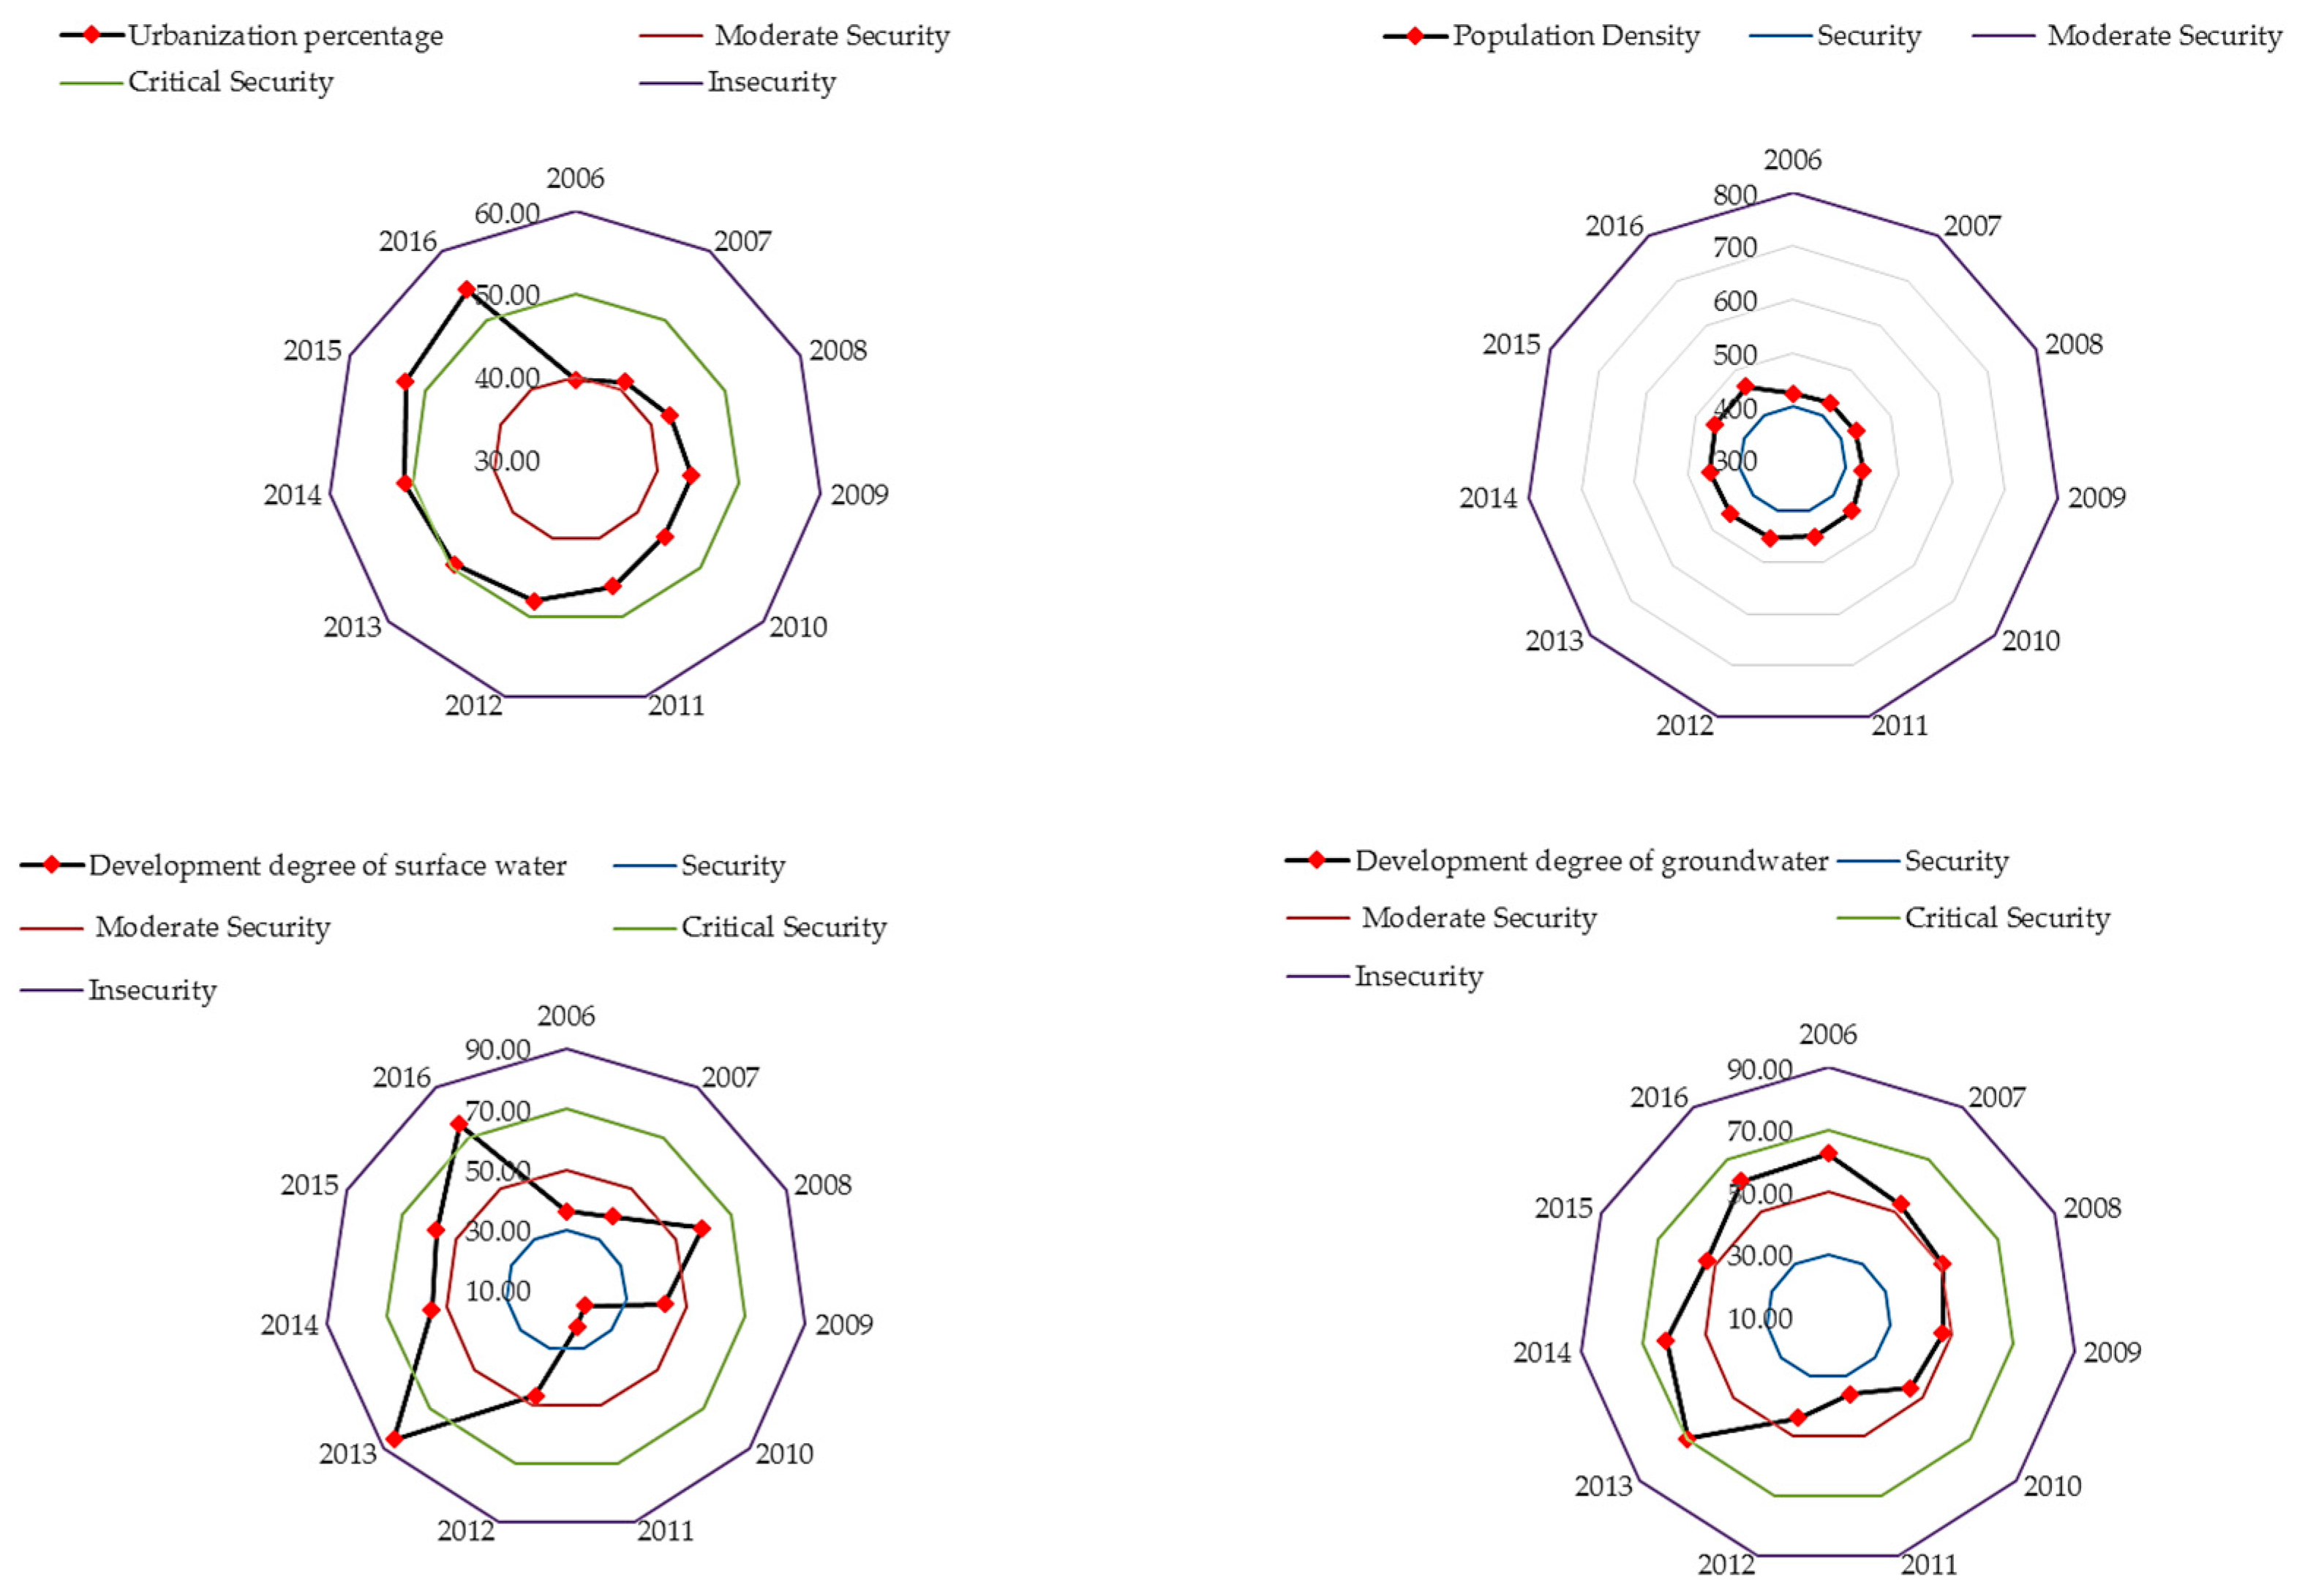
The negative changes of indicators in the pressure subsystem are shown in Figure 5. The main reason for this is that the urbanization percentage in the area, one of the indicators in the pressure subsystem, increased to 54.4% from 2006 to 2016, and that increase is beyond the scope of Critical Security. Meanwhile, the population density increased from 424.16 in 2006, to 462.97 in 2016, showing a trend of continuous growth. In the same period, the changes in the development degree of surface water have been volatile, but they show an overall increasing trend. The lowest rate was 17.92% in 2010, and the highest rate was 85.42% in 2013, or 4.8 times the former rate. The index value in 2016 was 2.1 times higher than the value in 2006, thereby far exceeding water security standards. Although the degree of the development of groundwater has fluctuated very little in the last decade, the index values in 2006 and 2016 are basically identical. However, the values are still in the critical state of water resource security. This is consistent with previous research related to water security in China, which found that the increases in urbanization, population and the development degree of water resource are the main reasons for the increase in water resource pressure [44]. Furthermore, by 2040, the urban area of Northern China will be 1.5 times that of the current level [45], and the up to 90% utilization of water resources in northern China may increase the negative impact on the environment [46]. Therefore, in the urbanization development process in Luoyang City, more effective water management measures are needed, in order to alleviate the pressure on water resources.
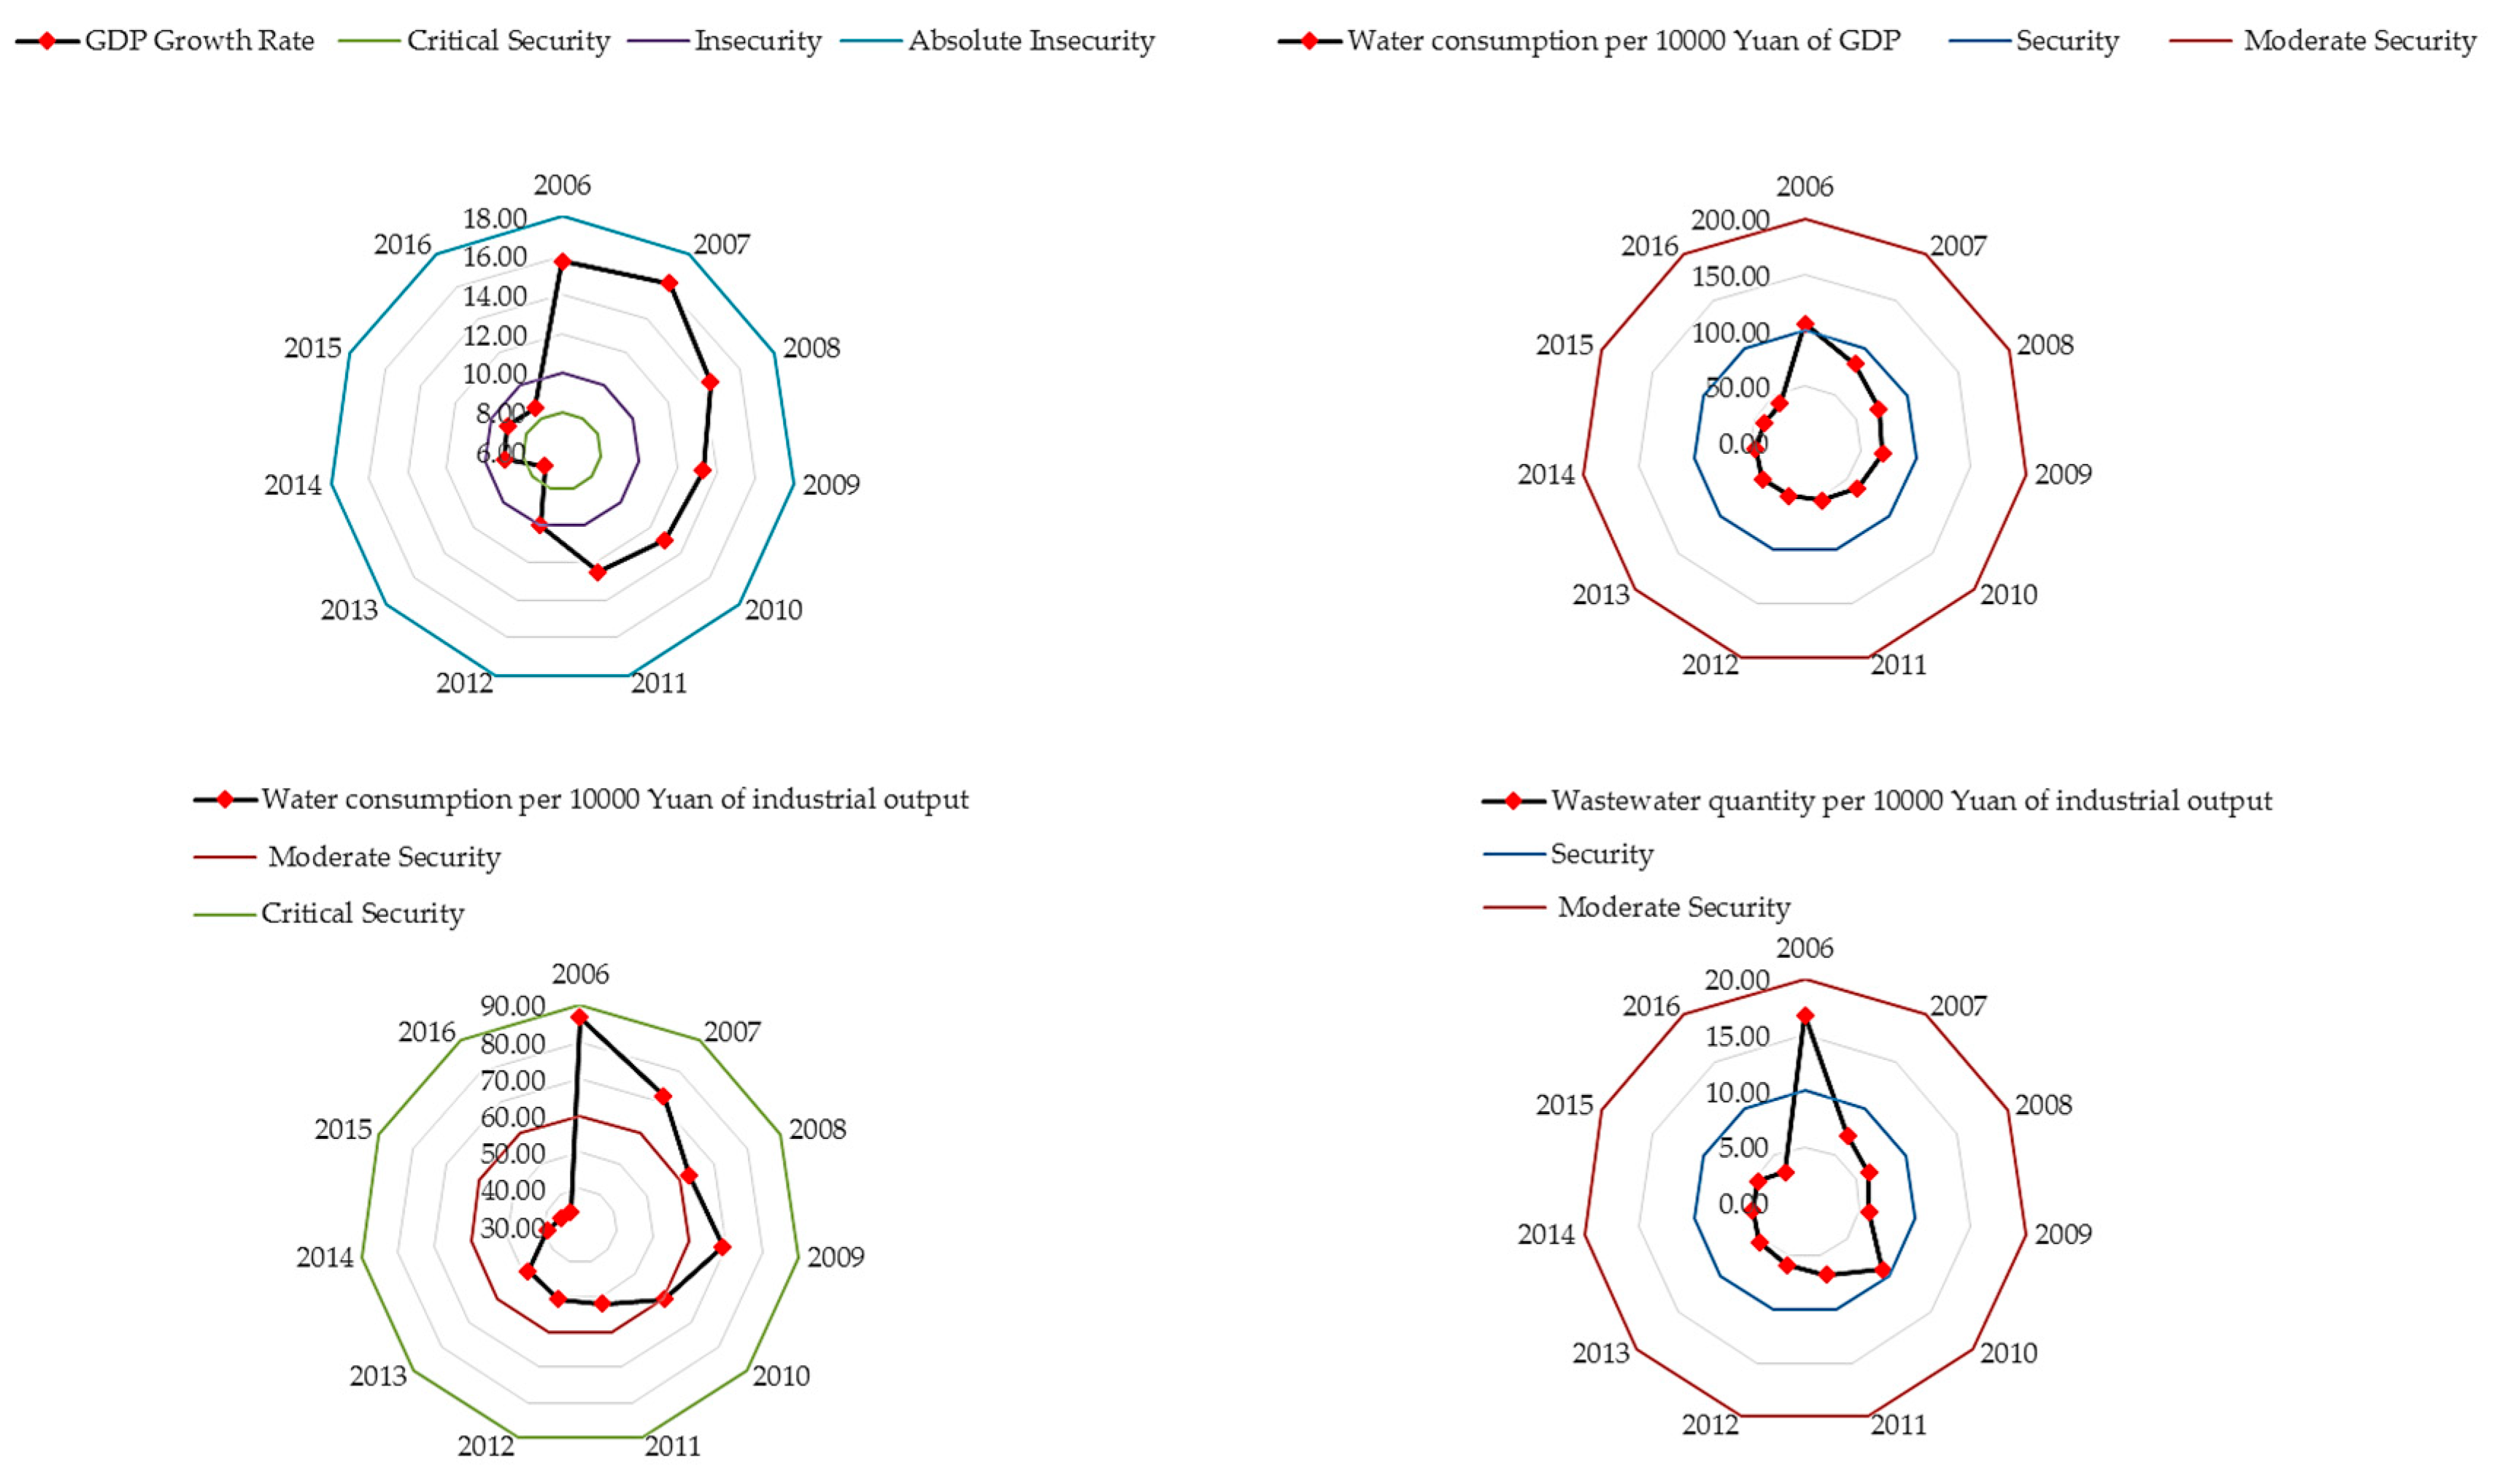
The positive changes of indicators in the pressure subsystem are shown in Figure 6. The indicators for GDP growth rate, water consumption per 10,000 Yuan of GDP, water consumption per 10,000 Yuan of industrial output and wastewater quantity per 10,000 Yuan of industrial output have shown a significant and continued rate of reduction. The GDP growth rate dropped from 15.7% in 2006 to 8.6% in 2016, while the security grade changed from Absolute Insecurity to Insecurity during the same period. The water consumption per 10,000 Yuan of industrial output dropped from 86.66 cubic meters in 2006 to 34.55 cubic meters in 2016, and the security grade changed from Critical Security to Moderate Security. In the same period, the water consumption per 10,000 Yuan of GDP reduced by 62%, and the wastewater quantity per 10,000 Yuan of industrial output reduced by 81%. These two indicators have been in Security grade since 2007. In addition, another indicator of water consumption per 10,000 Yuan of agricultural output, remained at a grade of Security from 2006 to 2016. These indicators reflect the relationship between economic development and water use. Economic development is an important factor affecting water resource security, so we need to ensure the coordinated and sustainable development of urban water resources and economic growth [47,48]. Min and Cheng believe that if water use efficiency is not improved, China’s water resources cannot meet the needs of economic development [49]. Fortunately, over the past decade, the negative impact of Luoyang’s economic development on water consumption and water environment has eased, and the city’s water resource security level may continue to increase.
3.3.2. Evaluation of State Subsystem
The trends of the cumulative connection degree in the state subsystem of water resource security evaluation are shown in Figure 7. As can be seen, the state subsystem was ranked as having a grade of Absolute Insecurity in all years. From the perspective of the connection degree of each security grade (Table 5), the proportion of Grade 1’s connection degree continued to decrease and remained at 0 from 2013 to 2016, the proportion of Grade 5’s connection degree continued to increase, exceeding 50% in 2012. The trend of showed that the water resource security state continued to decline after 2010. This means that the water resource security state in Luoyang may become worse in the next few years.
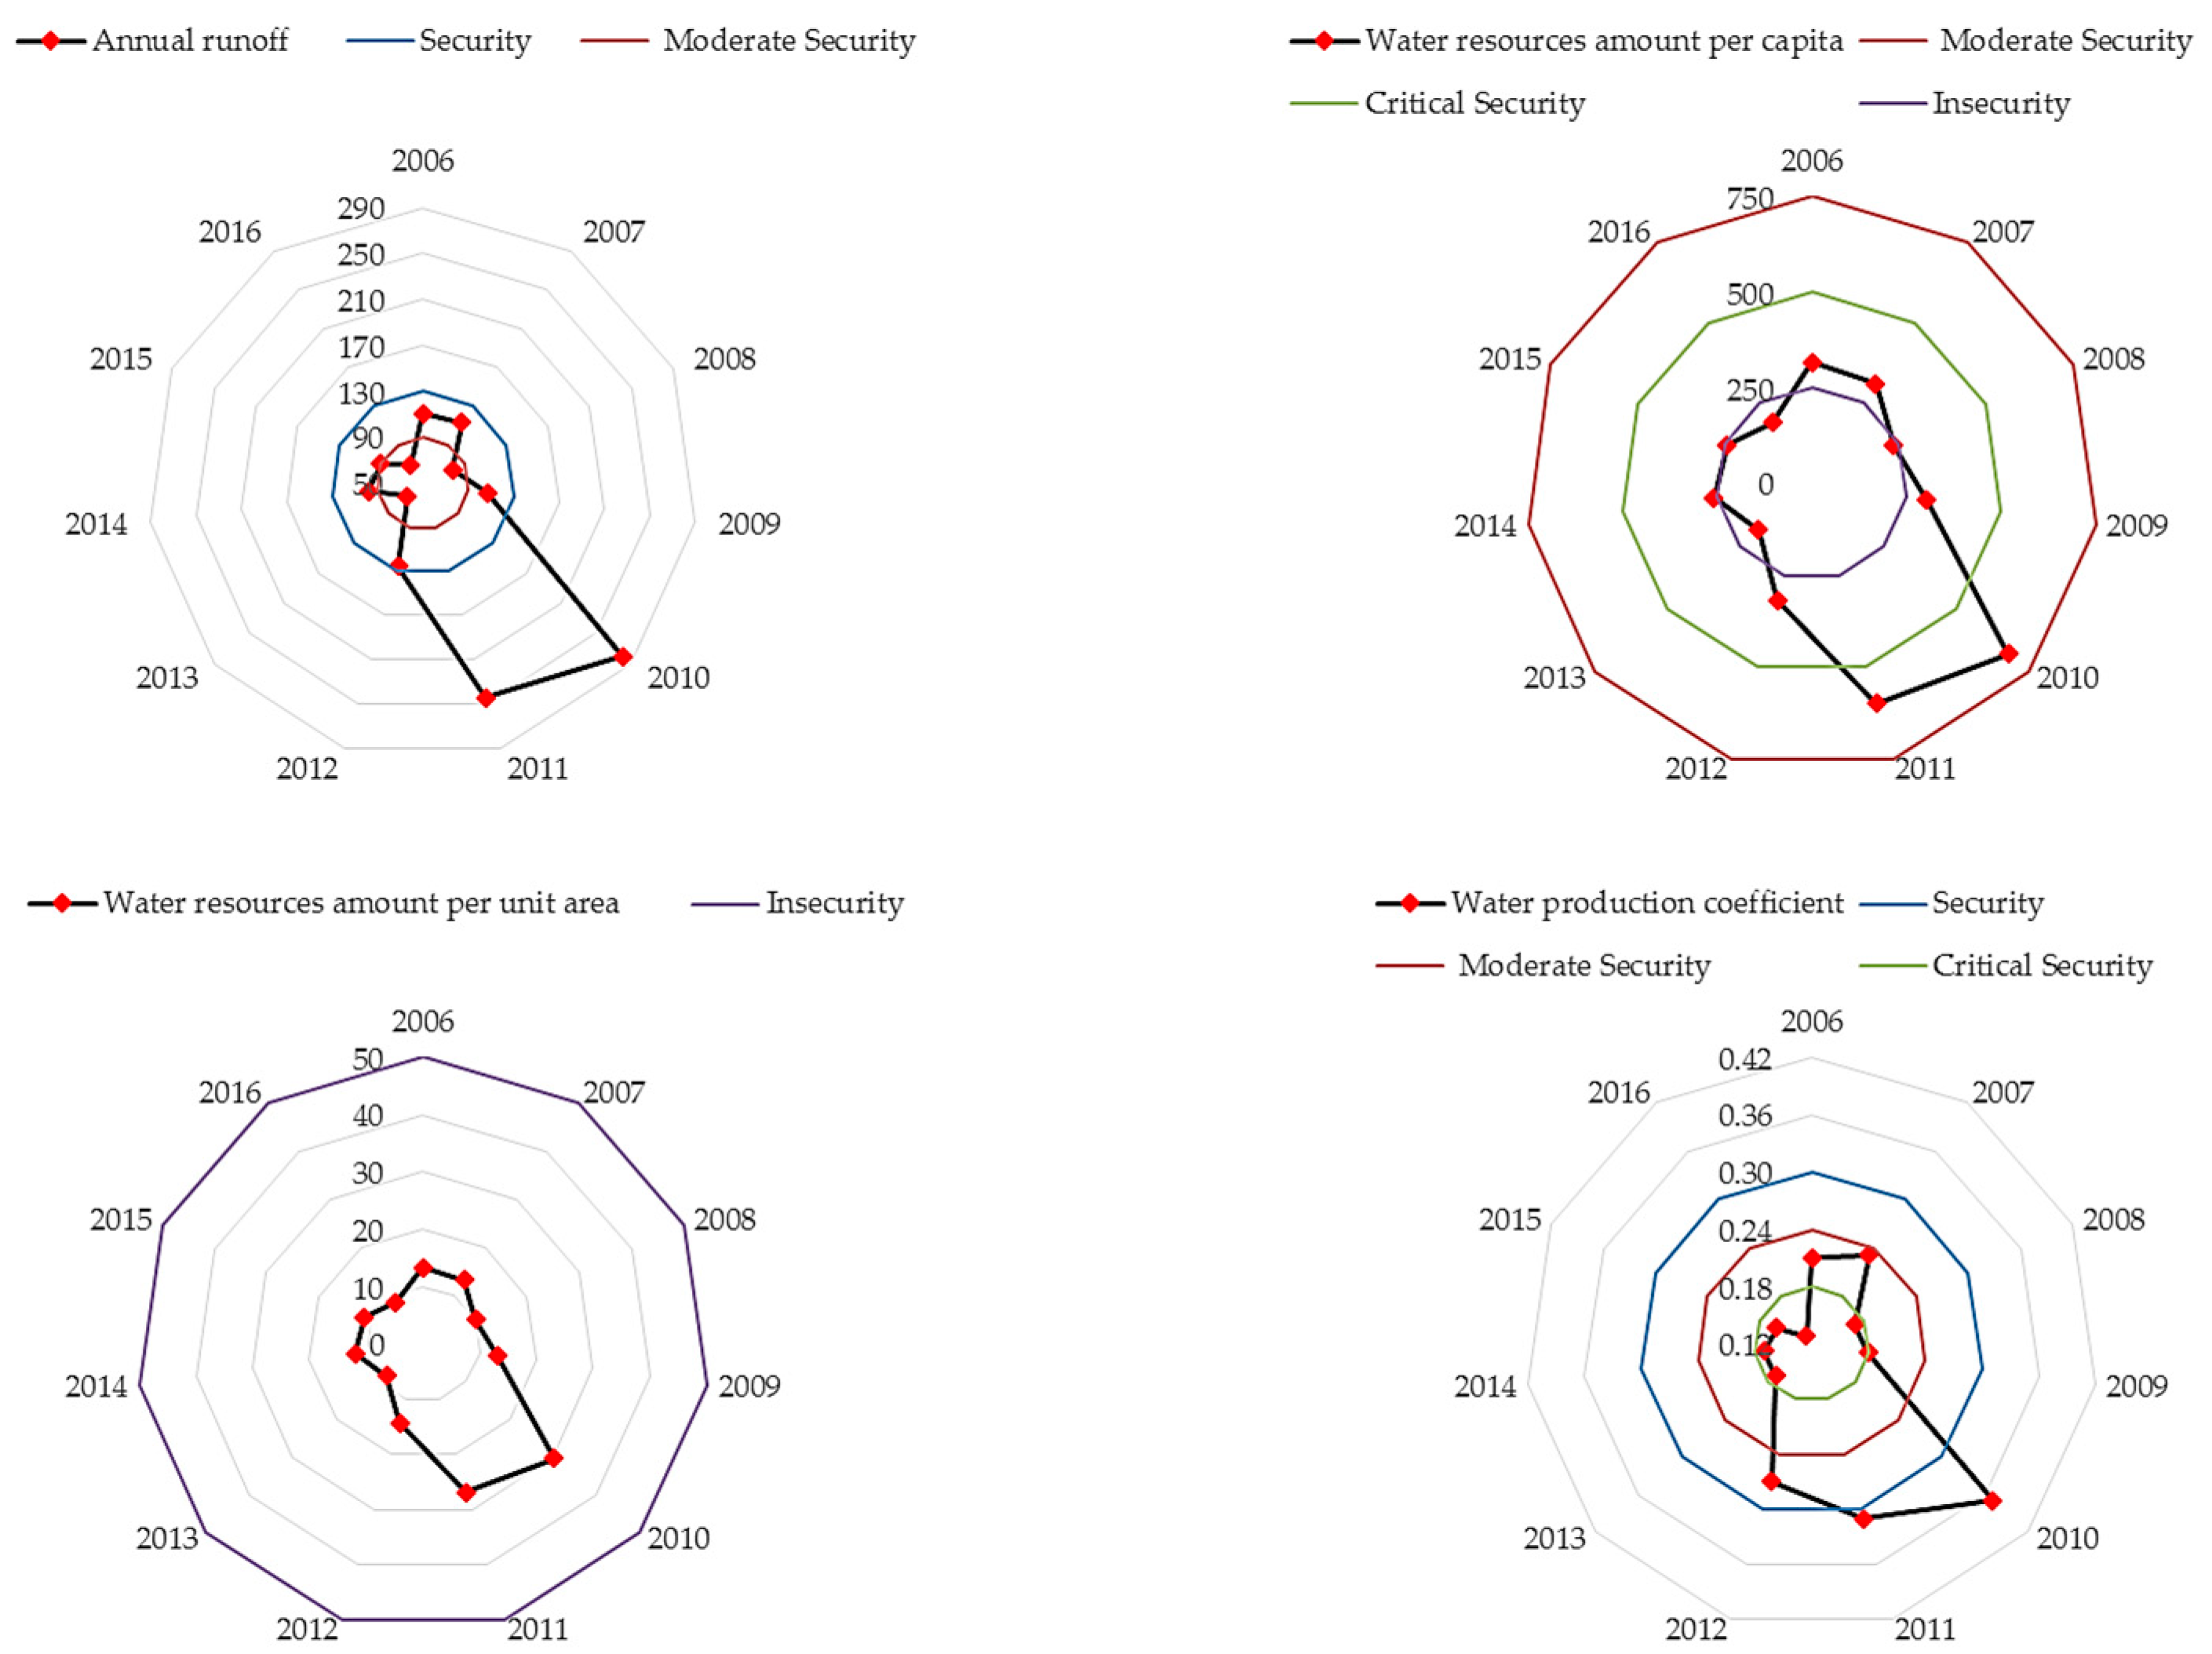
The main reasons for the deterioration in the state subsystem of water resource security in Luoyang City are shown in Figure 8. The indicators for annual runoff, water resources amount per capita, water resources amount per unit area, and water production coefficient showed a consistent trend and large fluctuations. All of these indicators are directly affected by the total amount of surface water resources and groundwater resources, and indirectly affected by rainfall. Their value reached the maximum level in 2011, due to the fact that 2011 was a high-flow year in Luoyang. These indicators also experienced an obvious change because of the abundant rainfall. After that, annual runoff, water resources amount per capita, and water resources amount per unit area reached their minimum values in 2013. This is also the main reason that the water resource security of Luoyang City was ranked at Grade 4 in 2013. The water production coefficient reached the minimum value in 2016, which was one-third the maximum value. During the same stage, the change in water supply amount per capita fluctuated less and was relatively stable. It can be seen that water shortage is an important factor the healthy development of the water resources system in Luoyang City, and the water challenge is primarily driven by the climate and pollution [50]. Unfortunately, unless measures are taken to reduce demand and augment supply, the total water shortage for the Yellow-Hai-Huai area in northern China is projected to reach 56.5 billion m3 by 2050 [46]. Therefore, in order to cope with the increasingly serious water shortage in Luoyang City, it is necessary to raise awareness of the importance of water conservation.
3.3.3. Evaluation of Response Subsystem
The trends of the cumulative connection degree in the response subsystem of water resource security evaluation are shown in Figure 9. As can be seen, the security grade of the response subsystem varied greatly, ranked as being at Absolute Insecurity from 2006 to 2008, before rising to Critical Security from 2009 to 2014, and finally maintaining a state of Moderate Security from 2015 onwards. As can be seen from the connection degree of each security grade (Table 5), the proportion of Grade 1’s connection degree was generally on the rise before 2013, eventually exceeding 50% in 2012. The proportion of Grade 5’s connection degree continued to decrease and then remained at 0 from 2015 onwards. This indicates that the response subsystem is trending in a more secure direction.
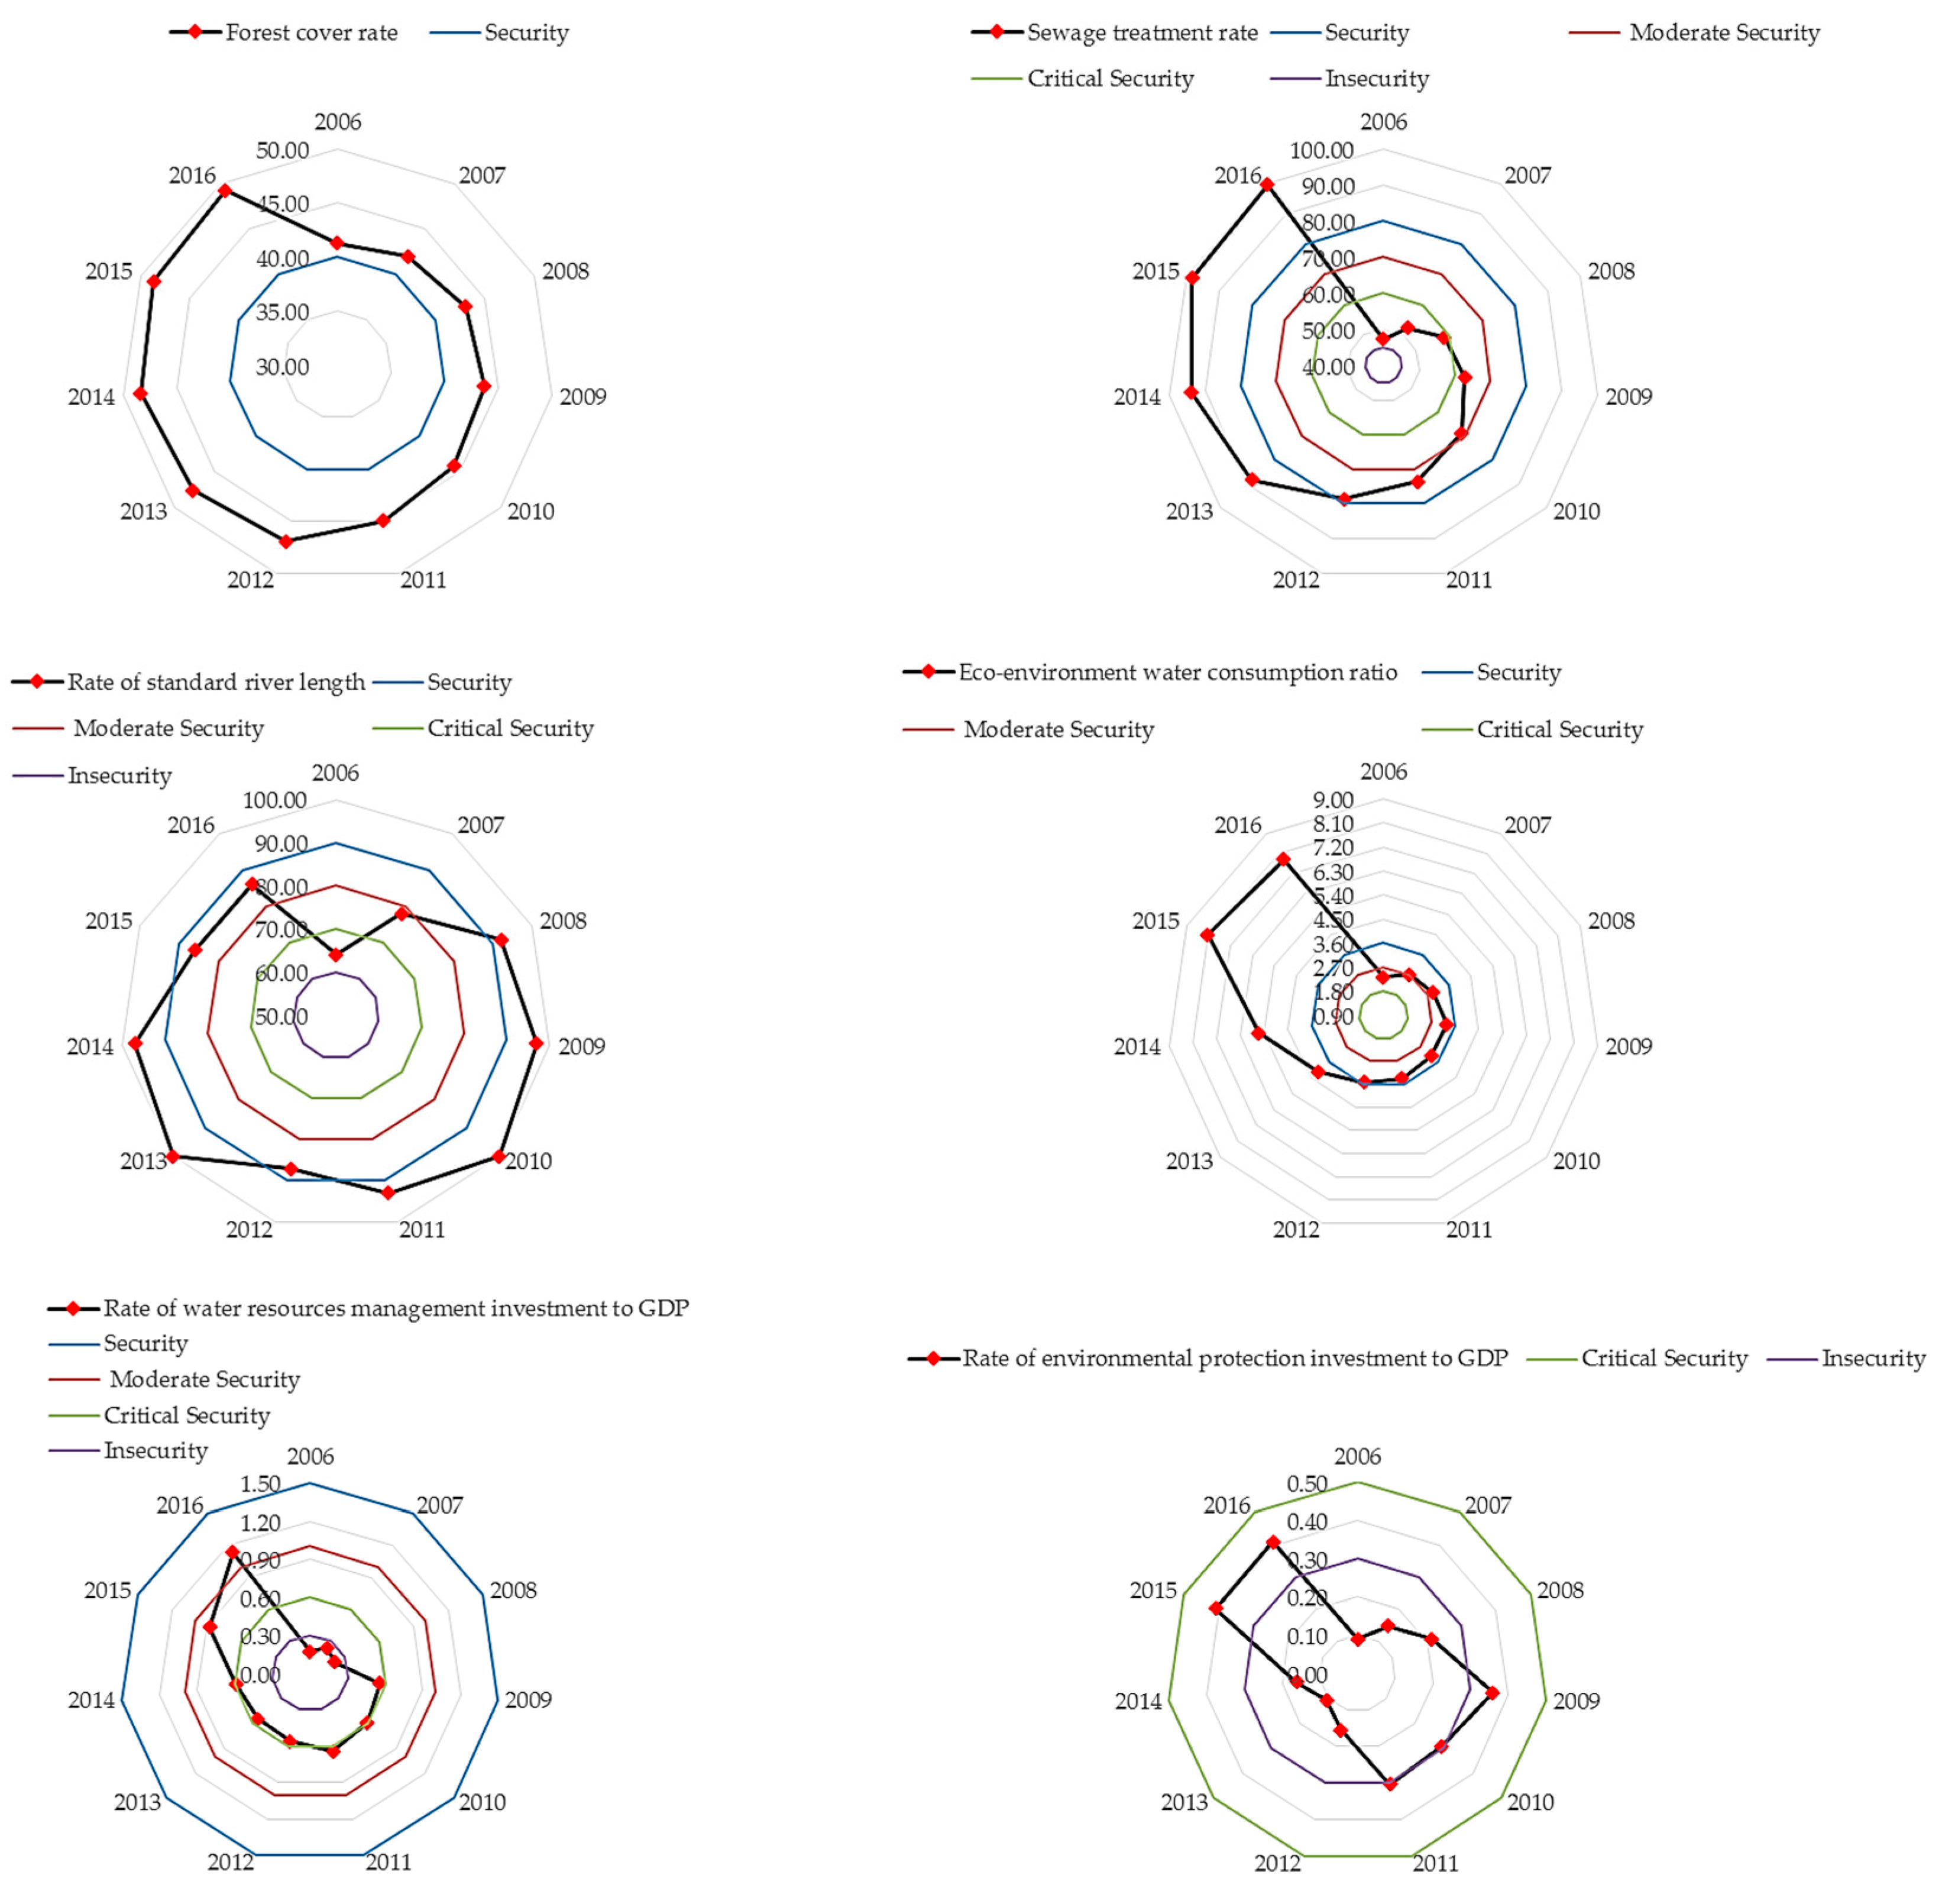
Since the implementation of the ecological strategy in Luoyang City, each index of the response subsystem has increased to different degrees. The rate of wastewater up to discharge standard for urban areas has reached 100% since 2010. The other indicators’ changes are shown in Figure 10. The forest coverage rate was ranked as Security in all years and has been steadily increasing. The sewage treatment rate increased to 99.4% between 2006 and 2016, which changed from an Insecurity state to a Security state. The rate of standard river length fluctuated to some extent, but has also experienced a generally rising trend. This indicates that the supervision and management of outlets into the river in Luoyang City have achieved certain positive effects. Meanwhile, in line with urban development, the allocation of water resources should not undermine the sustainable development of ecosystems [51]. The indicator for the eco-environment water consumption ratio went up from 2.33% in 2006 to 7.82% in 2016, which has been in a Security state since 2013. Moreover, poor water resources management and prominent water environment problems seriously affect the state of water security [52]. In both aspects, the rate of water resource management investment to GDP reached 1.13% in Luoyang City, an increase of 6.7 times the rate in 2006. The rate of environmental protection investment to GDP reached 41%, an increase of 4.6 times. As we can see, the response measures are gradually starting to take effect, but there is still room for improvement.
4. Conclusions
The reasonable development and utilization of water resources provides an effective water supply for social-economic development. In addition, social-economic development has provided the necessary funds and conditions for implementing a strategy relating to the rational exploitation and utilization of water resources, both in terms of support and restrictions. The comprehensive evaluation of water resource security and the evaluation analysis of each subsystem are consistent with the actual situation. This offers a certain degree of feasibility and reference significance. The main conclusions of our study are as follows:
- (1)
- In general, the water resource security situation in Luoyang has improved. From 2006 to 2008, Luoyang was graded at the Insecurity level, and the ranking was very close to being Critical Security for most of the years. This compares to a slightly improved grading of Critical Security level from 2009 to 2016 (except for 2013). However, the overall level of water resource security is still low.
- (2)
- From the evaluation results of each subsystem, we found that the response subsystem has the largest weight and develops in a safer direction. The pressure subsystem ranks second in weight. The pressure of water resource security increases because of urbanization and its negative influence on the development and utilization of water resources. Also, this pressure increases gradually. The state subsystem has the smallest weight. The state subsystem is mainly affected by climate change and tends to worsen.
- (3)
- From the perspective of the changes in various indexes, the social and economic development of Luoyang has gradually reduced the pressure on water resource consumption. Water quality and ecological protection have both improved significantly. However, the problem of shortages in terms of the quantity of water resources still poses a certain threat to water resource security.
- (4)
- The SPA method provides a new idea for the quantitative expression of the uncertain system and is not limited by the number of evaluation indicators. When combining the SPA method with the comprehensive weight method and the PSR model, the evaluation results reflect the sources of pressure on water resources and the efficiency of response measures. These methods can also be applied to water quality assessment, environmental assessment, disaster assessment, water cycle health assessment, etc., and have valuable application prospects.
Therefore, in the process of urbanization in Luoyang, we need to continue to improve the degree of efficiency in the utilization of water resources. We also need to intensify efforts to improve the efficiency of water resources management and strengthen environmental protection. Thus, we can achieve sustainable water resource and social-economic development in Luoyang City.
Author Contributions
Conceptualization, G.D.; Methodology, G.D. and J.S.; Validation, Y.J. and F.S.; Formal Analysis, G.D. and J.S.; Data Curation, G.D. and Y.J.; Writing-Original Draft Preparation, G.D.; Writing-Review & Editing, J.S.; Visualization, F.S.; Project Administration, G.D.
Funding
This research was funded by [Study on Application of Accounting Method in Ecological Environment] grant number [2014B09314] and [Fundamental Research Funds for the Central Universities] grant number [2016B46314].
Conflicts of Interest
The authors declare no conflict of interest.
References
- Grant, S.B.; Saphores, J.-D.; Feldman, D.L.; Hamilton, A.J.; Fletcher, T.D.; Cook, P.L.M.; Stewardson, M.; Sanders, B.F.; Levin, L.A.; Ambrose, R.F.; et al. Taking the “waste” out of “wastewater” for human water security and ecosystem sustainability. Science 2012, 337, 681–686. [Google Scholar] [CrossRef] [PubMed]
- Bakker, K. Water security: Research challenges and opportunities. Science 2012, 337, 914–915. [Google Scholar] [CrossRef] [PubMed]
- Cook, C.; Bakker, K. Water security: Debating an emerging paradigm. Glob. Environ. Chang.-Hum. Policy Dimens. 2012, 22, 94–102. [Google Scholar] [CrossRef]
- Voeroesmarty, C.J.; McIntyre, P.B.; Gessner, M.O.; Dudgeon, D.; Prusevich, A.; Green, P.; Glidden, S.; Bunn, S.E.; Sullivan, C.A.; Liermann, C.R.; et al. Global threats to human water security and river biodiversity. Nature 2010, 467, 555–561. [Google Scholar] [CrossRef] [PubMed] [Green Version]
- Bogardi, J.J.; Dudgeon, D.; Lawford, R.; Flinkerbusch, E.; Meyn, A.; Pahl-Wostl, C.; Vielhauer, K.; Voeroesmarty, C. Water security for a planet under pressure: Interconnected challenges of a changing world call for sustainable solutions. Curr. Opin. Environ. Sustain. 2012, 4, 35–43. [Google Scholar] [CrossRef]
- Gerlak, A.K.; Mukhtarov, F. ‘Ways of knowing’ water: Integrated water resources management and water security as complementary discourses. Int. Environ. Agreem.-Polit. Law Econ. 2015, 15, 257–272. [Google Scholar] [CrossRef]
- Chen, Z.; Wei, S. Application of system dynamics to water security research. Water Resour. Manag. 2014, 28, 287–300. [Google Scholar] [CrossRef]
- Xia, J.; Zhu, Y. The measurement of water resources security: A study and challenge on water resources carrying capacity. J. Nat. Resour. 2002, 17, 262–269. [Google Scholar]
- Chen, Z.; Li, G.; Tan, X. Study on concept and future strategic demonstration of water resources security in east China coastal cities. Water Resour. Prot. 2017, 33, 38–46. [Google Scholar]
- Tao, T.; Xin, K. A sustainable plan for China's drinking water. Nature 2014, 511, 527–528. [Google Scholar] [CrossRef] [PubMed]
- Chen, Y.; He, L.; Lu, H.; Li, J.; Ren, L. Planning for regional water system sustainability through water resources security assessment under uncertainties. Water Resour. Manag. 2018, 32, 3135–3153. [Google Scholar] [CrossRef]
- Roach, T.; Kapelan, Z.; Ledbetter, R. A resilience-based methodology for improved water resources adaptation planning under deep uncertainty with real world application. Water Resour. Manag. 2018, 32, 2013–2031. [Google Scholar] [CrossRef]
- Molinos-Senante, M.; Mocholi-Arce, M.; Sala-Garrido, R. Estimating the environmental and resource costs of leakage in water distribution systems: A shadow price approach. Sci. Total Environ. 2016, 568, 180–188. [Google Scholar] [CrossRef] [PubMed]
- Wang, X.-J.; Zhang, J.-Y.; Shahid, S.; Guan, E.-H.; Wu, Y.-X.; Gao, J.; He, R.-M. Adaptation to climate change impacts on water demand. Mitig. Adapt. Strat. Glob. Chang. 2016, 21, 81–99. [Google Scholar] [CrossRef]
- Sullivan, C.A. Quantifying water vulnerability: A multi-dimensional approach. Stoch. Environ. Res. Risk Assess. 2011, 25, 627–640. [Google Scholar] [CrossRef]
- Manandhar, S.; Pandey, V.P.; Kazama, F. Application of water poverty index (WPI) in Nepalese context: A case study of Kali Gandaki River Basin (KGRB). Water Resour. Manag. 2012, 26, 89–107. [Google Scholar] [CrossRef]
- Wilk, J.; Jonsson, A.C. From water poverty to water prosperity-a more participatory approach to studying local water resources management. Water Resour. Manag. 2013, 27, 695–713. [Google Scholar] [CrossRef]
- Gunda, T.; Benneyworth, L.; Burchfield, E. Exploring water indices and associated parameters: A case study approach. Water Policy 2015, 17, 98–111. [Google Scholar] [CrossRef]
- Gain, A.K.; Giupponi, C.; Wada, Y. Measuring global water security towards sustainable development goals. Environ. Res. Lett. 2016, 11. [Google Scholar] [CrossRef]
- Lautze, J.; Manthrithilake, H. Water security: Old concepts, new package, what value? Nat. Resour. Forum 2012, 36, 76–87. [Google Scholar] [CrossRef]
- Wang, X.; Cui, Q.; Li, S. An optimal water allocation model based on water resources security assessment and its application in Zhangjiakou Region, northern China. Resour. Conserv. Recycl. 2012, 69, 57–65. [Google Scholar] [CrossRef]
- Liu, K.K.; Li, C.H.; Cai, Y.P.; Xu, M.; Xia, X.H. Comprehensive evaluation of water resources security in the Yellow River Basin based on a fuzzy multi-attribute decision analysis approach. Hydrol. Earth Syst. Sci. 2014, 18, 1605–1623. [Google Scholar] [CrossRef] [Green Version]
- Gao, Y.; Wang, H.; Xu, X.; Gao, X.; Shi, Q. Assessment of water resources security case of Quanzhou City in Fujian Province. J. Nat. Resour. 2012, 27, 204–214. [Google Scholar]
- Norman, E.S.; Dunn, G.; Bakker, K.; Allen, D.M.; de Albuquerque, R.C. Water security assessment: Integrating governance and freshwater indicators. Water Resour. Manag. 2013, 27, 535–551. [Google Scholar] [CrossRef]
- Su, Y.; Guan, D.; Su, W.; Gao, W. Integrated assessment and scenarios simulation of urban water security system in the southwest of China with system dynamics analysis. Water Sci. Technol. 2017, 76, 2255–2267. [Google Scholar] [CrossRef]
- Wang, D.; Borthwick, A.G.; He, H.; Wang, Y.; Zhu, J.; Lu, Y.; Xu, P.; Zeng, X.; Wu, J.; Wang, L.; et al. A hybrid wavelet de-noising and rank-set pair analysis approach for forecasting hydro-meteorological time series. Environ. Res. 2018, 160, 269–281. [Google Scholar] [CrossRef] [PubMed]
- Neri, A.C.; Dupin, P.; Sanchez, L.E. A pressure-state-response approach to cumulative impact assessment. J. Clean. Prod. 2016, 126, 288–298. [Google Scholar] [CrossRef]
- Sun, T.; Lin, W.; Chen, G.; Guo, P.; Zeng, Y. Wetland ecosystem health assessment through integrating remote sensing and inventory data with an assessment model for the Hangzhou Bay, China. Sci. Total Environ. 2016, 566, 627–640. [Google Scholar] [CrossRef] [PubMed]
- Wolfslehner, B.; Vacik, H. Evaluating sustainable forest management strategies with the analytic network process in a pressure-state-response framework. J. Environ. Manag. 2008, 88, 1–10. [Google Scholar] [CrossRef] [PubMed]
- Hambling, T.; Weinstein, P.; Slaney, D. A review of frameworks for developing environmental health indicators for climate change and health. Int. J. Environ. Res. Public Health 2011, 8, 2854–2875. [Google Scholar] [CrossRef] [PubMed]
- Wu, K.-Y.; Jin, J.-L.; Wei, Y.-M.; Zhang, H. Diagnosis assessment model of watershed water security based on index system. Acta Sci. Nat. Univ. Sunyatseni 2008, 47, 105–113. [Google Scholar]
- Zhang, J.-Y.; Wang, L.-C. Assessment of water resource security in Chongqing City of China: What has been done and what remains to be done? Nat. Hazards 2015, 75, 2751–2772. [Google Scholar] [CrossRef]
- Zhang, F.; Wang, L.; Su, W. The safety evaluation of water resources based on DPSIRM conceptual framework in karst region. China Environ. Sci. 2015, 35, 3511–3520. [Google Scholar]
- Luoyang Statistics Bureau. Luoyang Statistical Yearbook; China Statistics Press: Beijing, China, 2007.
- Water Resources Department of Henan Province. Henan Water Resources Bulletin; Water Resources Department of Henan Province: Zhengzhou, China, 2006.
- Bao, C.; Zou, J. Analysis of spatiotemporal changes of the human-water relationship using water resources constraint intensity index in northwest China. Ecol. Indic. 2018, 84, 119–129. [Google Scholar] [CrossRef]
- Delgado, A.; Romero, I. Environmental conflict analysis using an integrated grey clustering and entropy-weight method: A case study of a mining project in Peru. Environ. Model. Softw. 2016, 77, 108–121. [Google Scholar] [CrossRef] [Green Version]
- Xie, T.; Wang, M.; Su, C.; Chen, W. Evaluation of the natural attenuation capacity of urban residential soils with ecosystem-service performance index (EPX) and entropy-weight methods. Environ. Pollut. 2018, 238, 222–229. [Google Scholar] [CrossRef] [PubMed]
- Jin, J.-L.; Wei, Y.-M.; Zou, L.-L.; Liu, L.; Zhang, W.-W.; Zhou, Y.-L. Forewarning of sustainable utilization of regional water resources: A model based on BP neural network and set pair analysis. Nat. Hazards 2012, 62, 115–127. [Google Scholar] [CrossRef]
- Feng, L.H.; Sang, G.S.; Hong, W.H. Statistical prediction of changes in water resources trends based on set pair analysis. Water Resour. Manag. 2014, 28, 1703–1711. [Google Scholar] [CrossRef]
- Pan, Z.; Wang, Y.; Jin, J.; Liu, X. Set pair analysis method for coordination evaluation in water resources utilizing conflict. Phys. Chem. Earth 2017, 101, 149–156. [Google Scholar] [CrossRef]
- Li, C.; Sun, L.; Jia, J.; Cai, Y.; Wang, X. Risk assessment of water pollution sources based on an integrated k-means clustering and set pair analysis method in the region of Shiyan, China. Sci. Total Environ. 2016, 557, 307–316. [Google Scholar] [CrossRef] [PubMed]
- Chou, C.-M. Application of set pair analysis-based similarity forecast model and wavelet denoising for runoff forecasting. Water 2014, 6, 912–928. [Google Scholar] [CrossRef]
- Xia, J. A perspective on hydrological base of water security problem and its application study in north China. Prog. Geogr. 2002, 21, 517–526. [Google Scholar]
- He, C.; Li, J.; Zhang, X.; Liu, Z.; Zhang, D. Will rapid urban expansion in, the drylands of northern China continue: A scenario analysis based on the land use scenario dynamics-urban model and the shared socioeconomic pathways. J. Clean. Prod. 2017, 165, 57–69. [Google Scholar] [CrossRef]
- Jiang, Y. China’s water scarcity. J. Environ. Manag. 2009, 90, 3185–3196. [Google Scholar] [CrossRef] [PubMed]
- Liu, L.; Guan, D.; Yang, Q. Evaluation of water resource security based on an MIV-BP model in a karst area. Water 2018, 10. [Google Scholar] [CrossRef]
- Wang, S.; Li, R. Toward the coordinated sustainable development of urban water resource use and economic growth: An empirical analysis of Tianjin City, China. Sustainability 2018, 10. [Google Scholar] [CrossRef]
- Min, Q.; Cheng, S. Water resource security and countermeasures in China oriented to globalization. Resour. Sci. 2002, 24, 49–55. [Google Scholar]
- Cheng, H.; Hu, Y.; Hao, J. Meeting China’s water shortage crisis: Current practices and challenges. Environ. Sci. Technol. 2009, 43, 240–244. [Google Scholar] [CrossRef] [PubMed]
- Richter, B.D.; Mathews, R.; Wigington, R. Ecologically sustainable water management: Managing river flows for ecological integrity. Ecol. Appl. 2003, 13, 206–224. [Google Scholar] [CrossRef]
- Zhang, L.; Xia, J. Situation and problem analysis of water resource security in China. Resour. Environ. Yangtze Basin 2009, 18, 116–120. [Google Scholar]
Figure 1.
PSR Framework.

Figure 2.
Administrative divisions of Henan Province.

Figure 3.
Cumulative connection degree trends from 2006 to 2016 in Luoyang.

Figure 4.
Cumulative connection degree trends for the pressure subsystem from 2006 to 2016.

Figure 5.
Negative changes of indexes in pressure subsystem from 2006 to 2016.

Figure 6.
Positive changes of indexes in pressure subsystem from 2006 to 2016.

Figure 7.
Cumulative connection degree trends for the state subsystem from 2006 to 2016.

Figure 8.
Change of indexes in state subsystem from 2006 to 2016.

Figure 9.
Cumulative connection degree trends for the response subsystem from 2006 to 2016.

Figure 10.
Change of indexes in response subsystem from 2006 to 2016.


Table 1.
Evaluation index system of water resource security.
| Factor | Indicators | Unit | Indicator Meaning | Type |
|---|---|---|---|---|
| Pressure (B1) | GDP Growth Rate (C1) | % | Reflect the economic development and population consumption pressures on water resources | − |
| Population Density (C2) | Pop. km−2 | Reflects population growth pressures on water resources | − | |
| Urbanization percentage in the area (C3) | % | Reflects water pressures from regional development | − | |
| Water consumption per 10,000 Yuan of GDP (C4) | m3·10−4 Yuan | Reflects the intensity of economic development pressures on water resources | − | |
| Water consumption per 10,000 Yuan of industrial output (C5) | m3·10−4 Yuan | Reflects the intensity of industrial development pressures on water resources | − | |
| Water consumption per 10,000 Yuan of agricultural output (C6) | m3·10−4 Yuan | Reflects the intensity of agricultural development pressures on water resources | − | |
| Wastewater quantity per 10,000 Yuan of industrial output (C7) | t·10−4 Yuan | Reflects the water quality pressures from industrial production | − | |
| Development degree of surface water (C8) | % | Reflects the development and utilization pressures on surface water resources | − | |
| Development degree of groundwater (C9) | % | Reflects the development and utilization pressures on groundwater resources | − | |
| State (B2) | Annual runoff (C10) | mm | Reflects the amount of water resources | + |
| Water resources amount per capita (C11) | m3/person | Reflects the per capita state of water resources | + | |
| Water resources amount per unit area (C12) | 104 m3·km−2 | Reflects the per unit area state of water resources | + | |
| Water supply amount per capita (C13) | m3/person | Reflects the intensity of water supply | + | |
| Water production coefficient (C14) | Reflects the amount of precipitation | + | ||
| Response (B3) | Sewage treatment rate (C15) | % | Reflects the response to quality of water resources | + |
| Forest coverage rate (C16) | % | Reflects the response to quantity of water resources | + | |
| Rate of wastewater up to discharge standard for urban (C17) | % | Reflects the response to quality of water resources | + | |
| Rate of standard river length (C18) | % | Reflects the response to quality of water resources | + | |
| Eco-environment water consumption ratio (C19) | % | Reflects the response to eco-environment water security condition | + | |
| Rate of water resources management investment to GDP (C20) | % | Reflects the capacity of investment to aid in ecological management and reduce pressure on water resources | + | |
| Rate of environmental protection investment to GDP (C21) | % | Reflects the capacity of investment to aid in ecological management and reduce pressure on water resources | + |
Note: In this table, “−” means the negative index and “+” means the positive index.
Table 2.
Grade classification of water resource security.
| Factor | Indicators | Unit | Security | Moderate Security | Critical Security | Insecurity | Absolute Insecurity |
|---|---|---|---|---|---|---|---|
| Pressure (B1) | GDP Growth Rate (C1) | % | ≤3 | 3–5 | 5–8 | 8–10 | ≥10 |
| Population Density (C2) | Pop. km−2 | ≤400 | 400–800 | 800–2000 | 2000–5000 | ≥5000 | |
| Urbanization percentage in the area (C3) | % | ≤30 | 30–40 | 40–50 | 50–60 | ≥60 | |
| Water consumption per 10,000 Yuan of GDP (C4) | m3·10−4 Yuan | ≤100 | 100–200 | 200–300 | 300–400 | ≥400 | |
| Water consumption per 10,000 Yuan of industrial output (C5) | m3·10−4 Yuan | ≤30 | 30–60 | 60–90 | 90–120 | ≥120 | |
| Water consumption per 10,000 Yuan of agricultural output (C6) | m3·10−4 Yuan | ≤500 | 500–1000 | 1000–1500 | 1500–2000 | ≥2000 | |
| Wastewater quantity per 10,000 Yuan of industrial output (C7) | t·10−4 Yuan | ≤10 | 10–20 | 20–30 | 30–40 | ≥40 | |
| Development degree of surface water (C8) | % | ≤30 | 30–50 | 50–70 | 70–90 | ≥90 | |
| Development degree of groundwater (C9) | % | ≤30 | 30–50 | 50–70 | 70–90 | ≥90 | |
| State (B2) | Annual runoff (C10) | mm | ≥130 | 90–130 | 50–90 | 10–50 | ≤10 |
| Water resources amount per capita (C11) | m3/person | ≥1000 | 750–1000 | 500–750 | 250–500 | ≤250 | |
| Water resources amount per unit area (C12) | 104 m3·km−2 | ≥200 | 150–200 | 100–150 | 50–100 | ≤50 | |
| Water supply amount per capita (C13) | m3/person | ≥800 | 600–800 | 400–600 | 200–400 | ≤200 | |
| Water production coefficient (C14) | ≥0.3 | 0.24–0.3 | 0.18–0.24 | 0.12–0.18 | ≤0.12 | ||
| Response (B3) | Sewage treatment rate (C15) | % | ≥80 | 70–80 | 60–70 | 45–60 | ≤45 |
| Forest coverage rate (C16) | % | ≥40 | 30–40 | 20–30 | 10–20 | ≤10 | |
| Rate of wastewater up to discharge standard for urban (C17) | % | ≥95 | 85–95 | 75–85 | 60–75 | ≤60 | |
| Rate of standard river length (C18) | % | ≥90 | 80–90 | 70–80 | 60–70 | ≤60 | |
| Eco-environment water consumption ratio (C19) | % | ≥3.6 | 2.7–3.6 | 1.8–2.7 | 0.9–1.8 | ≤0.9 | |
| Rate of water resources management investment to GDP (C20) | % | ≥1.5 | 1–1.5 | 0.6–1 | 0.3–0.6 | ≤0.3 | |
| Rate of environmental protection investment to GDP(C21) | % | ≥1 | 0.8–1 | 0.5–0.8 | 0.3–0.5 | ≤0.3 |
Note: the threshold value of water resource security is derived from references 31 to 33.
Table 3.
The weights of evaluation indicators for water resource security.
| Factor | Indicators | |||
|---|---|---|---|---|
| Pressure (0.3519) | C1 | 0.0168 | 0.0476 | 0.0322 |
| C2 | 0.0135 | 0.0503 | 0.0319 | |
| C3 | 0.0098 | 0.0453 | 0.0275 | |
| C4 | 0.0629 | 0.0407 | 0.0518 | |
| C5 | 0.0575 | 0.0423 | 0.0499 | |
| C6 | 0.0334 | 0.0402 | 0.0368 | |
| C7 | 0.0629 | 0.0390 | 0.0510 | |
| C8 | 0.0270 | 0.0433 | 0.0351 | |
| C9 | 0.0270 | 0.0444 | 0.0357 | |
| State (0.2368) | C10 | 0.0137 | 0.0634 | 0.0385 |
| C11 | 0.0643 | 0.0592 | 0.0617 | |
| C12 | 0.0353 | 0.0602 | 0.0478 | |
| C13 | 0.0643 | 0.0443 | 0.0543 | |
| C14 | 0.0183 | 0.0508 | 0.0345 | |
| Response (0.4112) | C15 | 0.0453 | 0.0467 | 0.0460 |
| C16 | 0.0562 | 0.0471 | 0.0516 | |
| C17 | 0.0372 | 0.0393 | 0.0383 | |
| C18 | 0.0372 | 0.0402 | 0.0387 | |
| C19 | 0.0610 | 0.0568 | 0.0589 | |
| C20 | 0.1283 | 0.0487 | 0.0885 | |
| C21 | 0.1283 | 0.0503 | 0.0893 |
Table 4.
Total connection degree and cumulative connection degree of comprehensive evaluation of water resources security.
Table 4.
Total connection degree and cumulative connection degree of comprehensive evaluation of water resources security.
| Year | Security Grade | ||||||||||
|---|---|---|---|---|---|---|---|---|---|---|---|
| 2006 | 0.1891 | 0.1570 | 0.1712 | 0.1112 | 0.3716 | 0.1891 | 0.3460 | 0.5172 | 0.6284 | 1 | Grade 4 |
| 2007 | 0.2662 | 0.1498 | 0.1638 | 0.0767 | 0.3435 | 0.2662 | 0.4160 | 0.5798 | 0.6565 | 1 | Grade 4 |
| 2008 | 0.2951 | 0.1029 | 0.1812 | 0.0535 | 0.3673 | 0.2951 | 0.3980 | 0.5792 | 0.6327 | 1 | Grade 4 |
| 2009 | 0.3119 | 0.1470 | 0.1680 | 0.1733 | 0.1997 | 0.3119 | 0.4589 | 0.6269 | 0.8003 | 1 | Grade 3 |
| 2010 | 0.4134 | 0.1369 | 0.1744 | 0.0582 | 0.2171 | 0.4134 | 0.5503 | 0.7247 | 0.7829 | 1 | Grade 3 |
| 2011 | 0.4455 | 0.1344 | 0.1461 | 0.0564 | 0.2176 | 0.4455 | 0.5800 | 0.7261 | 0.7824 | 1 | Grade 3 |
| 2012 | 0.4124 | 0.1579 | 0.0746 | 0.1110 | 0.2441 | 0.4124 | 0.5703 | 0.6449 | 0.7559 | 1 | Grade 3 |
| 2013 | 0.3959 | 0.0523 | 0.1363 | 0.1577 | 0.2578 | 0.3959 | 0.4482 | 0.5845 | 0.7422 | 1 | Grade 4 |
| 2014 | 0.4151 | 0.0748 | 0.1283 | 0.1380 | 0.2437 | 0.4151 | 0.4900 | 0.6182 | 0.7563 | 1 | Grade 3 |
| 2015 | 0.4270 | 0.0783 | 0.1625 | 0.1663 | 0.1660 | 0.4270 | 0.5053 | 0.6677 | 0.8340 | 1 | Grade 3 |
| 2016 | 0.4293 | 0.0906 | 0.1128 | 0.1923 | 0.1751 | 0.4293 | 0.5199 | 0.6326 | 0.8249 | 1 | Grade 3 |
Table 5.
Total connection degree and cumulative connection degree of PSR subsystems of water resources security.
Table 5.
Total connection degree and cumulative connection degree of PSR subsystems of water resources security.
| PSR | Year | ||||||||||
|---|---|---|---|---|---|---|---|---|---|---|---|
| Pressure | 2006 | 0.3514 | 0.2527 | 0.2365 | 0.0680 | 0.0914 | 0.3514 | 0.6041 | 0.8406 | 0.9086 | 1 |
| 2007 | 0.4866 | 0.1811 | 0.2409 | 0.0000 | 0.0914 | 0.4866 | 0.6677 | 0.9086 | 0.9086 | 1 | |
| 2008 | 0.4738 | 0.1402 | 0.2946 | 0.0000 | 0.0914 | 0.4738 | 0.6140 | 0.9086 | 0.9086 | 1 | |
| 2009 | 0.4729 | 0.1987 | 0.2370 | 0.0000 | 0.0914 | 0.4729 | 0.6716 | 0.9086 | 0.9086 | 1 | |
| 2010 | 0.5658 | 0.1720 | 0.1708 | 0.0000 | 0.0914 | 0.5658 | 0.7378 | 0.9086 | 0.9086 | 1 | |
| 2011 | 0.6073 | 0.1894 | 0.1031 | 0.0088 | 0.0914 | 0.6073 | 0.7966 | 0.8997 | 0.9086 | 1 | |
| 2012 | 0.4637 | 0.2872 | 0.1348 | 0.0229 | 0.0914 | 0.4637 | 0.7509 | 0.8857 | 0.9086 | 1 | |
| 2013 | 0.4626 | 0.1486 | 0.1791 | 0.1556 | 0.0541 | 0.4626 | 0.6112 | 0.7903 | 0.9459 | 1 | |
| 2014 | 0.5171 | 0.1373 | 0.1938 | 0.1518 | 0.0000 | 0.5171 | 0.6544 | 0.8482 | 1.0000 | 1 | |
| 2015 | 0.5507 | 0.1272 | 0.1708 | 0.1421 | 0.0091 | 0.5507 | 0.6779 | 0.8487 | 0.9909 | 1 | |
| 2016 | 0.5575 | 0.0716 | 0.1360 | 0.2349 | 0.0000 | 0.5575 | 0.6290 | 0.7651 | 1.0000 | 1 | |
| State | 2006 | 0.0055 | 0.1572 | 0.1457 | 0.1811 | 0.5105 | 0.0055 | 0.1627 | 0.3084 | 0.4895 | 1 |
| 2007 | 0.0222 | 0.1891 | 0.0971 | 0.1351 | 0.5565 | 0.0222 | 0.2113 | 0.3084 | 0.4435 | 1 | |
| 2008 | 0.0000 | 0.0346 | 0.1766 | 0.1265 | 0.6623 | 0.0000 | 0.0346 | 0.2113 | 0.3377 | 1 | |
| 2009 | 0.0000 | 0.1498 | 0.0857 | 0.2156 | 0.5489 | 0.0000 | 0.1498 | 0.2355 | 0.4511 | 1 | |
| 2010 | 0.3084 | 0.0573 | 0.2033 | 0.0285 | 0.4024 | 0.3084 | 0.3657 | 0.5691 | 0.5976 | 1 | |
| 2011 | 0.3084 | 0.0000 | 0.2324 | 0.0546 | 0.4045 | 0.3084 | 0.3084 | 0.5408 | 0.5955 | 1 | |
| 2012 | 0.1627 | 0.1457 | 0.0000 | 0.1748 | 0.5168 | 0.1627 | 0.3084 | 0.3084 | 0.4832 | 1 | |
| 2013 | 0.0000 | 0.0000 | 0.2020 | 0.1681 | 0.6299 | 0.0000 | 0.0000 | 0.2020 | 0.3701 | 1 | |
| 2014 | 0.0000 | 0.1122 | 0.0991 | 0.1377 | 0.6510 | 0.0000 | 0.1122 | 0.2113 | 0.3490 | 1 | |
| 2015 | 0.0000 | 0.0816 | 0.1054 | 0.1252 | 0.6878 | 0.0000 | 0.0816 | 0.1870 | 0.3122 | 1 | |
| 2016 | 0.0000 | 0.0000 | 0.1600 | 0.1002 | 0.7398 | 0.0000 | 0.0000 | 0.1600 | 0.2602 | 1 | |
| Response | 2006 | 0.1562 | 0.0752 | 0.1303 | 0.1081 | 0.5302 | 0.1562 | 0.2314 | 0.3617 | 0.4698 | 1 |
| 2007 | 0.2185 | 0.1007 | 0.1366 | 0.1089 | 0.4353 | 0.2185 | 0.3192 | 0.4558 | 0.5647 | 1 | |
| 2008 | 0.3126 | 0.1105 | 0.0873 | 0.0573 | 0.4324 | 0.3126 | 0.4231 | 0.5104 | 0.5676 | 1 | |
| 2009 | 0.3542 | 0.1016 | 0.1565 | 0.2965 | 0.0913 | 0.3542 | 0.4558 | 0.6123 | 0.9087 | 1 | |
| 2010 | 0.3442 | 0.1530 | 0.1609 | 0.1248 | 0.2171 | 0.3442 | 0.4972 | 0.6581 | 0.7829 | 1 | |
| 2011 | 0.3869 | 0.1651 | 0.1330 | 0.0978 | 0.2171 | 0.3869 | 0.5520 | 0.6850 | 0.7829 | 1 | |
| 2012 | 0.5129 | 0.0547 | 0.0660 | 0.1492 | 0.2171 | 0.5129 | 0.5676 | 0.6336 | 0.7829 | 1 | |
| 2013 | 0.5676 | 0.0000 | 0.0619 | 0.1533 | 0.2171 | 0.5676 | 0.5676 | 0.6296 | 0.7829 | 1 | |
| 2014 | 0.5676 | 0.0000 | 0.0890 | 0.1262 | 0.2171 | 0.5676 | 0.5676 | 0.6566 | 0.7829 | 1 | |
| 2015 | 0.5676 | 0.0346 | 0.1879 | 0.2099 | 0.0000 | 0.5676 | 0.6022 | 0.7901 | 1.0000 | 1 | |
| 2016 | 0.5676 | 0.1586 | 0.0656 | 0.2082 | 0.0000 | 0.5676 | 0.7262 | 0.7918 | 1.0000 | 1 |
© 2018 by the authors. Licensee MDPI, Basel, Switzerland. This article is an open access article distributed under the terms and conditions of the Creative Commons Attribution (CC BY) license (http://creativecommons.org/licenses/by/4.0/).
Share and Cite
MDPI and ACS Style
Dong, G.; Shen, J.; Jia, Y.; Sun, F. Comprehensive Evaluation of Water Resource Security: Case Study from Luoyang City, China. Water 2018, 10, 1106. https://doi.org/10.3390/w10081106
AMA Style
Dong G, Shen J, Jia Y, Sun F. Comprehensive Evaluation of Water Resource Security: Case Study from Luoyang City, China. Water. 2018; 10(8):1106. https://doi.org/10.3390/w10081106
Chicago/Turabian StyleDong, Guanghua, Juqin Shen, Yizhen Jia, and Fuhua Sun. 2018. "Comprehensive Evaluation of Water Resource Security: Case Study from Luoyang City, China" Water 10, no. 8: 1106. https://doi.org/10.3390/w10081106
Note that from the first issue of 2016, this journal uses article numbers instead of page numbers. See further details here.