Bacterial Productivity in a Ferrocyanide-Contaminated Aquifer at a Nuclear Waste Site
by
 , ,
, ,
Andrew Plymale
1,* ,
,
Jacqueline Wells
1,
Emily Graham
2,
Odeta Qafoku
3,
Shelby Brooks
1 and
Brady Lee
1 1
Energy and Environment Directorate, Pacific Northwest National Lab (PNNL), Richard, WA 99354, USA
2
Earth and Biological Sciences Directorate, Pacific Northwest National Lab (PNNL), Richard, WA 99354, USA
3
Physical and Computational Sciences Directorate, Pacific Northwest National Lab (PNNL); Richard, WA 99354, USA
*
Author to whom correspondence should be addressed.
Water 2018, 10(8), 1072; https://doi.org/10.3390/w10081072
Submission received: 19 June 2018
/
Revised: 5 August 2018
/
Accepted: 7 August 2018
/
Published: 11 August 2018
(This article belongs to the Special Issue Groundwater Contamination and Remediation)
Abstract
:This study examined potential microbial impacts of cyanide contamination in an aquifer affected by ferrocyanide disposal from nuclear waste processing at the US Department of Energy’s Hanford Site in south-eastern Washington State (USA). We examined bacterial productivity and microbial cell density in groundwater (GW) from wells with varying levels of recent and historical total cyanide concentrations. We used tritiated leucine (3H-Leu) uptake as a proxy for heterotrophic, aerobic bacterial productivity in the GW, and we measured cell density via nucleic acid staining followed by epifluorescence microscopy. Bacterial productivity varied widely, both among wells that had high historical and recent total cyanide (CN−) concentrations and among wells that had low total CN− values. Standing microbial biomass varied less, and was generally greater than that observed in a similar study of uranium-contaminated hyporheic-zone groundwater at the Hanford Site. Our results showed no correlation between 3H-Leu uptake and recent or historical cyanide concentrations in the wells, consistent with what is known about cyanide toxicity with respect to iron speciation. However, additional sampling of the CN− affected groundwater, both in space and time, would be needed to confirm that the CN− contamination is not affecting the GW biota.
Keywords:
cyanide; ferrocyanide; bacteria; toxicity; groundwater; contamination; Hanford; nuclear waste; tritiated leucine; aquifer1. Introduction
At the Hanford Site in semi-arid south-eastern Washington State, the US Department of Energy (DOE) and its contractors processed enriched uranium (235U) into weapons-grade plutonium (239Pu) from the 1940s through the 1980s [1]. The chemical extraction of Pu from U, as well as further chemical and physical processing of the plutonium fuel, was carried out in the 200 Area “Central Plateau” of Hanford, which lies south and west of the Columbia River, in a Pleistocene paleochannel (Figure S1). The groundwater (GW) in the 200 Area is an unconfined aquifer residing in Pliocene alluvial, lacustrine, and paleosol sediments, which lie below Pleistocene flood-deposited sands and gravels (Figure S2). The Central Plateau is underlain by Miocene basalt flows (Figure S2). The 200 Area aquifer is contaminated with a variety of organic and inorganic constituents, including radionuclides (Figure S1a). These contaminants have reached the aquifer after infiltration through the vadose zone from leaking waste tanks, unlined waste trenches, and other sources. Annual precipitation at the Hanford Site averages 177 mm [2]. Currently, flux to groundwater is controlled by natural recharge, which is expected to vary from near zero in undisturbed areas with native shrub vegetation, to nearly 100 mm/year for non-vegetated gravel-covered surfaces [3]. In the 200 Area unconfined aquifer, the predominant flow direction during the active liquid disposal period (1948–1974) was to the north-west. However, in more recent times, the flow direction appears to have reversed, and is now to the south-east, owing to lowering of the regional water table following cessation of active discharges [4].
In the south-eastern portion of the 200 Area, the BP-5 Operable Unit (OU) is contaminated with high levels of nitrate (NO3−), technetium-99 (99Tc), tritium, uranium, iodine-129, and cyanide (CN−) [5] (Figure S3). The BP-5 cyanide contamination has reached GW from a 1950s-era disposal trench [6]. Total cyanide concentrations in BP-5 GW have been detected as high ~1600 µg/L (parts per billion, ppb) [5], or ~8 times the US drinking water maximum contaminant level (200 µg/L total cyanide [7]). In addition, Washington State places a drinking water limit of 4.2 µg/L for free cyanide, since the free form (HCN + CN−) is most toxic [8]. Groundwater from the OU currently is being extracted for physical, chemical, and biological processing at a nearby pump and treatment (P&T) facility, and the GW CN− contamination is of particular concern to the operators of the 200 Area P&T facility. As a potential microbial toxin, CN− has the potential to interfere with biological treatment processes at the plant, which primarily are anaerobic fluidized bed reactors for removing NO3−, 99Tc-pertechntate (99TcO4−), and other oxyanions. In addition, the effluent from the P&T plant is re-injected into the 200 Area vadose zone, so effluent CN− concentrations are a concern [5]. Finally, bacterial CN− toxicity may have the potential to inhibit microbially facilitated in situ contaminant attenuation and degradation, under either bioremediation or monitored natural attenuation scenarios.
Although results from pure culture, enrichment culture, and bioreactor studies indicate the potential for cyanide toxicity to bacteria [9,10,11,12,13], CN− toxicity to native GW populations of bacteria has not been examined. In general, there are few studies of the toxicity of GW contaminants to in situ populations of bacteria under relevant conditions (one exception being Konopka et al. [14], for the case of uranium). In the case of cyanide, toxicity is determined by the proportion of free and complexed cyanide. For the latter, toxicity is determined by the stability of the metal–CN− complex, with the strongest metal complexes showing the least toxicity with respect to CN− [15]. When originally disposed to the 200 Area vadose zone, the cyanide was in the form of a ferrous iron [Fe(II)] complex, ferrocyanide [(Fe(CN)64−)], which was used to precipitate cesium-137 (137Cs) from aqueous waste, with the 137Cs-laden sludge being transferred to waste tanks, and the aqueous supernatant disposed of in unlined trenches [6]. Ferrocyanide is a highly stable complex, being considered “strong acid dissociable” (SAD), meaning that the complex will not appreciably dissociate above pH 2 [8]. In addition, both ferric [Fe(III)] cyanide and mixed iron-valence, ferric–ferro–cyanide complexes also are SAD. However, little is known with certainty about the current speciation of CN− in the BP-5 operable unit, some 60 years after disposition.
This study sought to assess the GW microbiology of the 200-BP-5 operable unit in relation to cyanide (CN−) contamination and other geochemical factors. Groundwater samples were collected from eight wells in the operable unit, and bacterial productivity in the GW samples was assessed via the tritiated leucine (3H-Leu) incorporation assay [14,16,17,18,19,20]. In bacterial protein, leucine is present at a relatively constant level (~7%), but heterotrophic bacteria are auxotrophic for this amino acid, and so must acquire it from their environment. Thus, leucine uptake provides a reliable proxy of bacterial growth, and tritium labelling provides a high level of sensitivity [20]. Developed for marine and freshwater environments and widely used in studying these systems, the 3H-Leu method recently has been adapted to GW environments [14,18,19]. We also assessed standing microbial biomass in the GW samples by total microscopic cell counts (nucleic-acid staining in conjunction with epifluorescence microscopy). Our biotic results were examined in relation to geochemical and hydrogeological factors, both from historical data and from results gathered as part of the current project.
2. Materials and Methods
2.1. Site Description and Sampling Procedure
Groundwater samples were collected in June and July of 2017 from 8 wells in the BP-5 Operable Unit of the Hanford Site 200 Area (Table 1, Figure S4). Wells were purged at a rate of 7.57 L/min. Samples were collected from within the area of the highest current total cyanide concentrations and from outside the current CN− plume, from older monitoring wells, for comparison (Table 2, Figure 1). The latter included wells that had historical maximum total CN− concentration that were either relatively high or low (Table 2, Figure 1), to account for possible long-term biotic effects. Within the plume, GW was collected from a recently drilled monitoring well (well #2, E33-360, see Table S1) and from a GW extraction well for the 200 West Area pump-and-treatment facility (well #1, E33-268, see Table S1). Groundwater was collected in 1-L aliquots in 1-L polypropylene bottles and was stored at 4 °C until use. To confirm that the tritiated leucine incorporation method would give appropriate sensitivity and response, the method (see below) was first tested on a Columbia River water sample taken downstream from the Hanford Site and on an unfiltered and untreated domestic well water sample from an aquifer near the site.
2.2. Tritiated Leucine Incorporation Assay
Bacterial heterotrophic activity [20] was determined under aerobic conditions from 3H-Leu incorporation using a method in which particulate cell material is collected by microcentrifugation [16,17], as implemented by Konopka et al. [14]. For activity assays, 1.45 mL of GW was added to a 1.7 mL Eppendorf plastic microcentrifuge tube, which was then amended with 14.5 µL of a stock of tritiated leucine to start the assay. The stock was amended with unlabeled L-leucine such that each sample would have a final total leucine (1H-leucine + 3H-leucine) concentration of 500 nM, the leucine concentration that Konopka et al. [14] found to produce maximum incorporation rates in bacteria from the Hanford Site 300 Area GW. The stock contained sufficient tritiated leucine to provide 2.5 µCi of 3H-leucine (4,5-3H(N), 56.2 Ci mmol-1, Perkin-Elmer) in each sample. Samples were incubated at ~20 °C without shaking, and activity was terminated by the addition of 0.075 mL of 100% trichloroacetic acid (TCA). For time-zero (T0) killed controls, 0.075 mL of TCA was added before adding the tritiated leucine stock. All treatments and time points were carried out in duplicate. Samples were stored at 4 °C in the dark until being extracted for tritium-labelled protein.
To extract the 3H-labelled protein, the particulate material was collected by centrifugation (10,000 rcf for 10 min. at 4 °C) and then washed once (via centrifugation, as above) with an equal volume of cold (4 °C) 5% TCA. The labelled protein was precipitated with an equal volume of ice-cold 100% ethanol, and then collected by centrifugation as above, and finally dissolved in 0.2 mL of 1 N NaOH at 90 °C for 1 h. After cooling to room temperature, 1.25 mL of liquid scintillation cocktail (Hionic-Fluor, Perkin-Elmer) was added directly to the microcentrifuge tube, and the sample was evenly distributed in the cocktail by vortex mixing. The samples were then left at room temperature in the dark overnight to lower chemical luminescence. After removing the tab and hinge of the microcentrifuge tube with household toenail clippers, each vial was then placed in a separate 20 mL glass liquid scintillation vial, and the samples were then placed in a chilled (4 °C) liquid scintillation analyzer (Perkin-Elmer Tri-Carb 3180 TR/SL) and allowed to chill in the dark for at least 1 h. Each sample was then counted for 10 min. (with a 1 min. pre-count delay), using the spectral index of the sample (SIS) as the quench indicator, since previous work [14] had shown SIS to give more consistent results than other quench indicators for the microcentrifuge tube-contained samples.
2.3. Microbial Cell Numbers
Direct microscopic counts of microorganisms in GW were made on 10–30 mL subsamples that were collected on a 0.1 µm polycarbonate membrane (25 mm, Whatman Nucleopore Track-Etch). Groundwater was vacuum-filtered through the 0.1 µm membrane (with 0.45 µm backing filter) using a glass tower and portable vacuum pump, until ~1 mL of concentrated GW remained. The concentrated 1 mL GW sample was then stained with 60 µL of 4', 6-diamidino-2-phenylindole (DAPI; 50 µg/mL). Stained samples were incubated in the dark at room temperature for 15 min. and were subsequently washed three times with autoclaved, filter-sterilized deionized water. The DAPI-stained membranes were then mounted onto a glass slide with non-fluorescent immersion oil and a cover slip and were frozen at −20 °C until examined, if not examined immediately. The slides were examined using a Nikon Eclipse Ci-L using a single pass filter under type HF (halogen-free) immersion oil. For each sample, a minimum of 200 cells and a minimum of 20 fields were counted. Microbial cell numbers in the original GW sample were calculated using the following equation:
where N is the number of cells counted, At is the effective area of the filter (mm2), Ag is the area of the counting grid (mm2) and Vf is the volume of sample filtered [21].
microorganisms (cells/mL) = (N × At)/(Vf × Ag)
2.4. Aqueous Speciation Modeling
Modeling of groundwater from well #1 (E33-268) and well #2 (E33-360) at a given pH and Eh was computed using The Geochemist’s Workbench®, GWB version 12.0.1 (Aqueous Solutions LLC, Champaign, IL, USA) [22]. The Minteq thermodynamic database built within GWB was selected for these calculations after it was updated with equilibrium constants by Sehmel, 1989 [23], for all reactions involving aqueous ferric/ferrous cyanides complexes.
2.5. Statistical and Geospatial Analyses
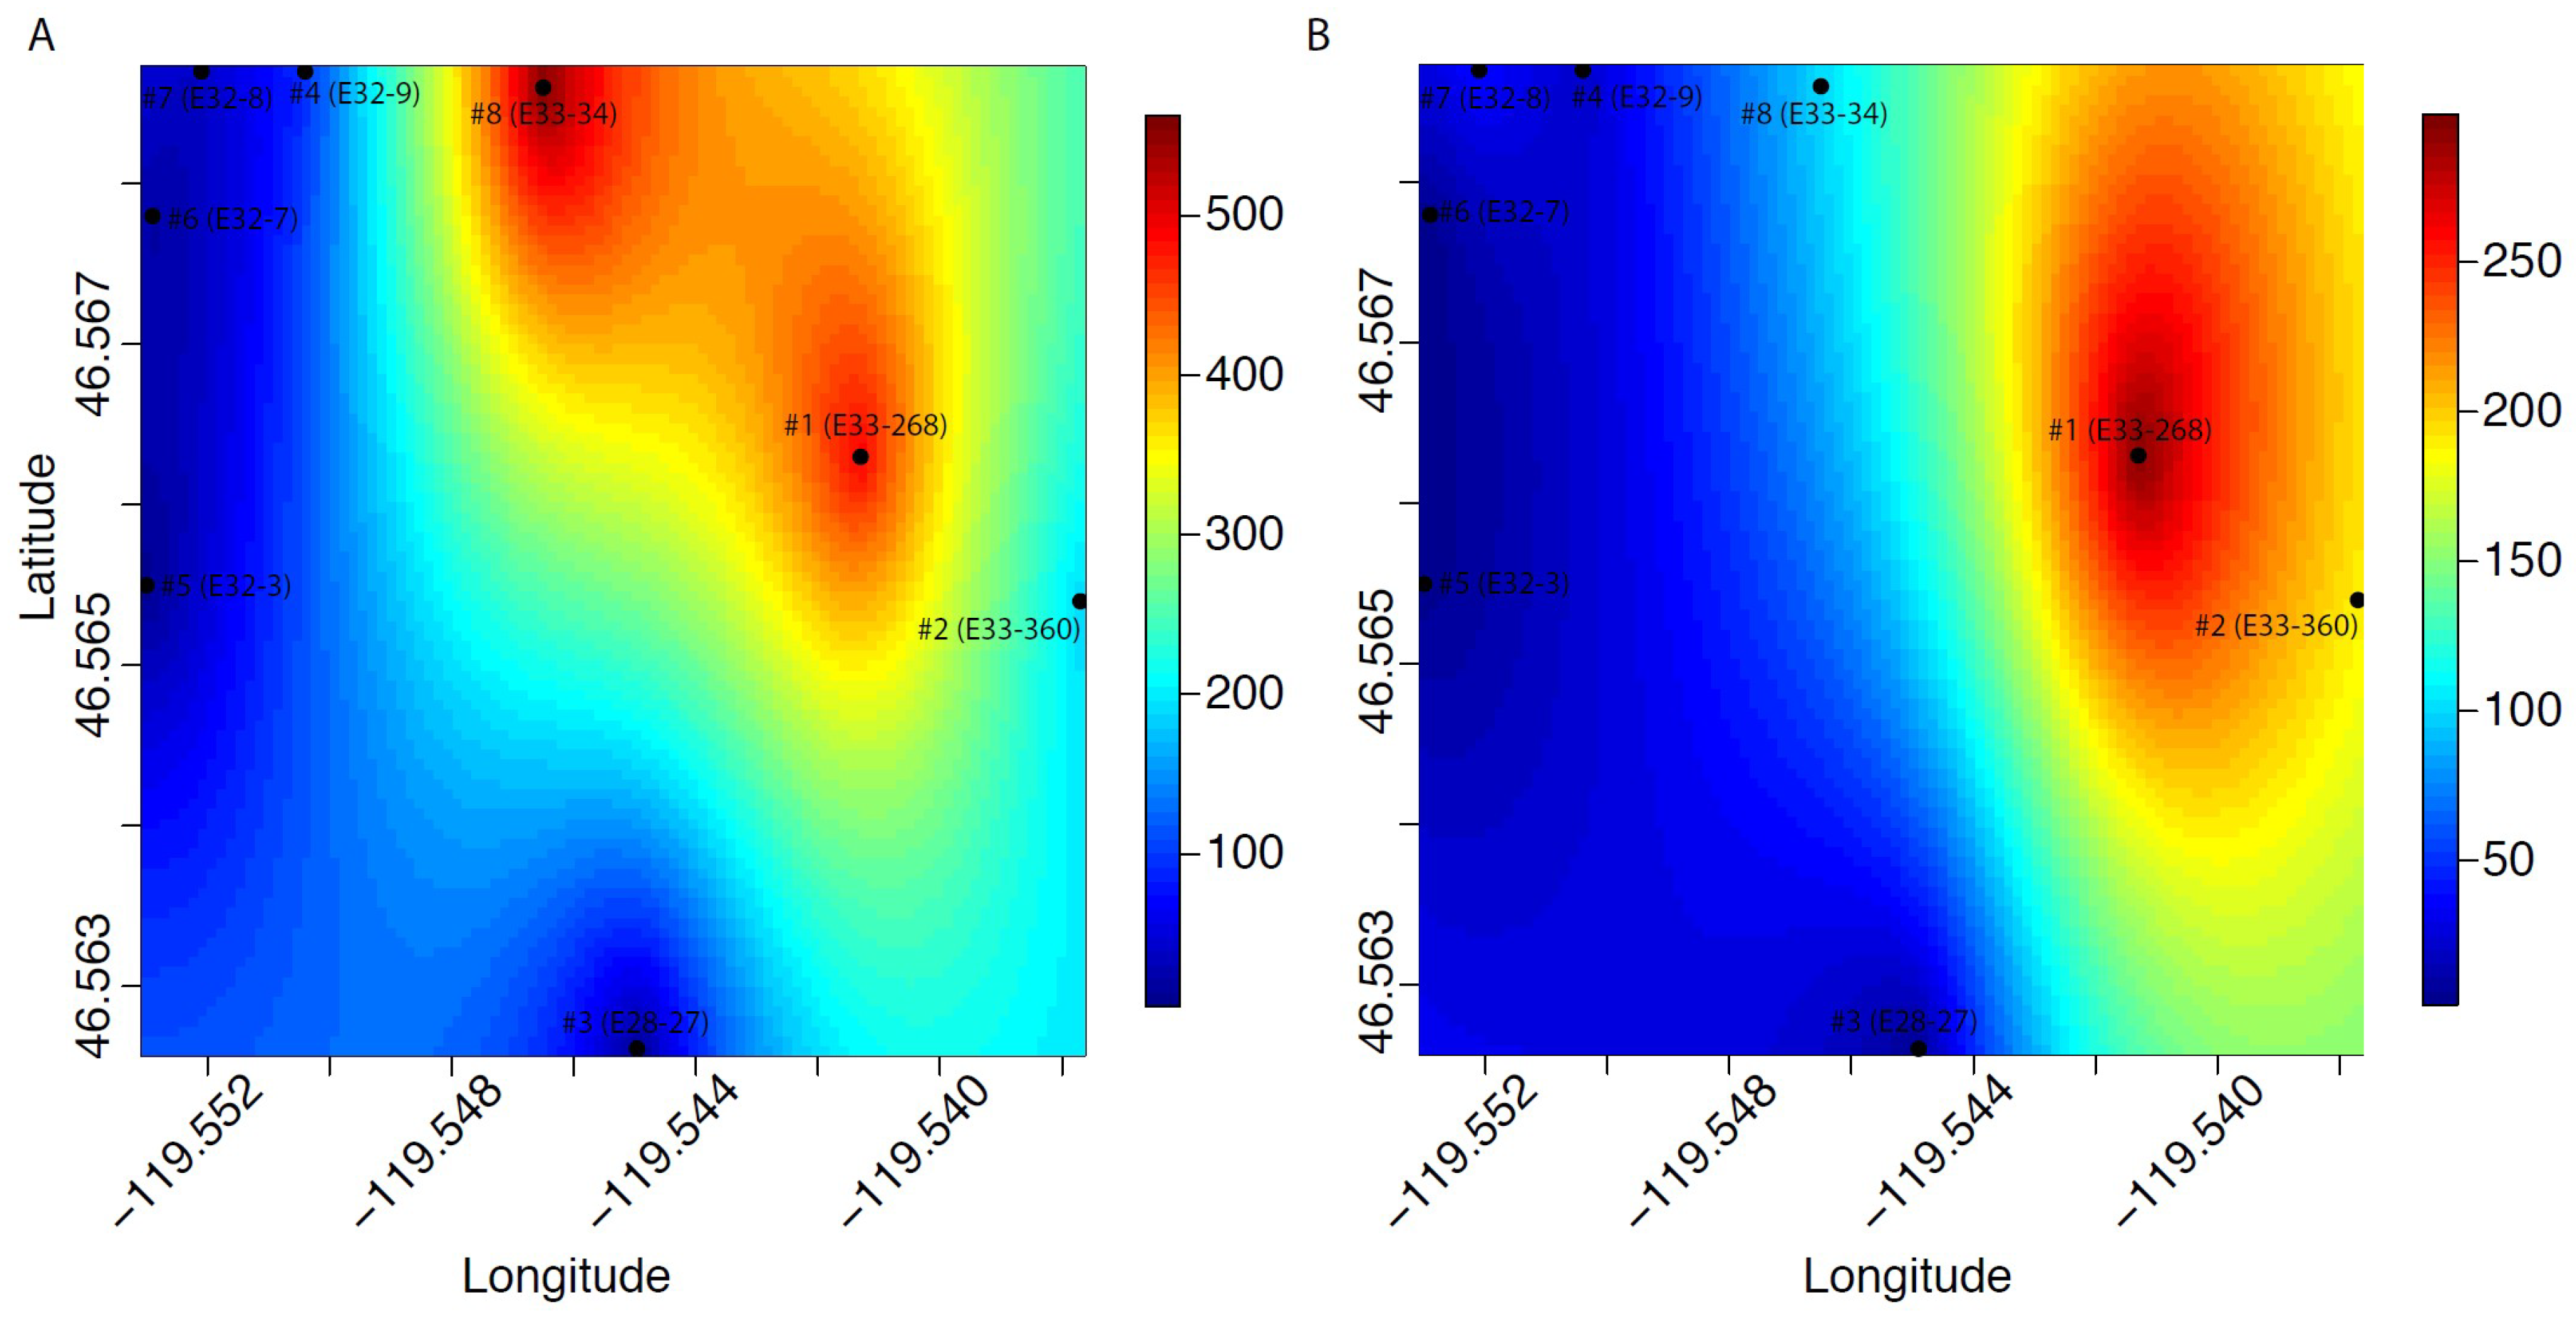
Statistical analyses were performed using R software [24]. To determine environmental and geochemical factors associated with bacterial leucine uptake and GW cyanide content, 3H-Leu and CN− were correlated to all other collected variables using one-tailed Pearson Product-Moment Correlation tests (significance level at 0.05). To determine current and historical spatial distributions of CN− (Figure 1), we interpolated observed values across the sampling domain using kriging estimation. Kriging predicts the value at a given point in space as a function of data in the neighborhood of the point. Kriging parameters were derived from maximum likelihood estimation with the function ‘likfit’ in the ‘geoR’ package, and predicted values were generated with the ‘krige.conv’ function in ‘geoR’ [25]. Predicted values were plotted using the function ‘image.plot’ in the ‘fields’ package [26].
3. Results
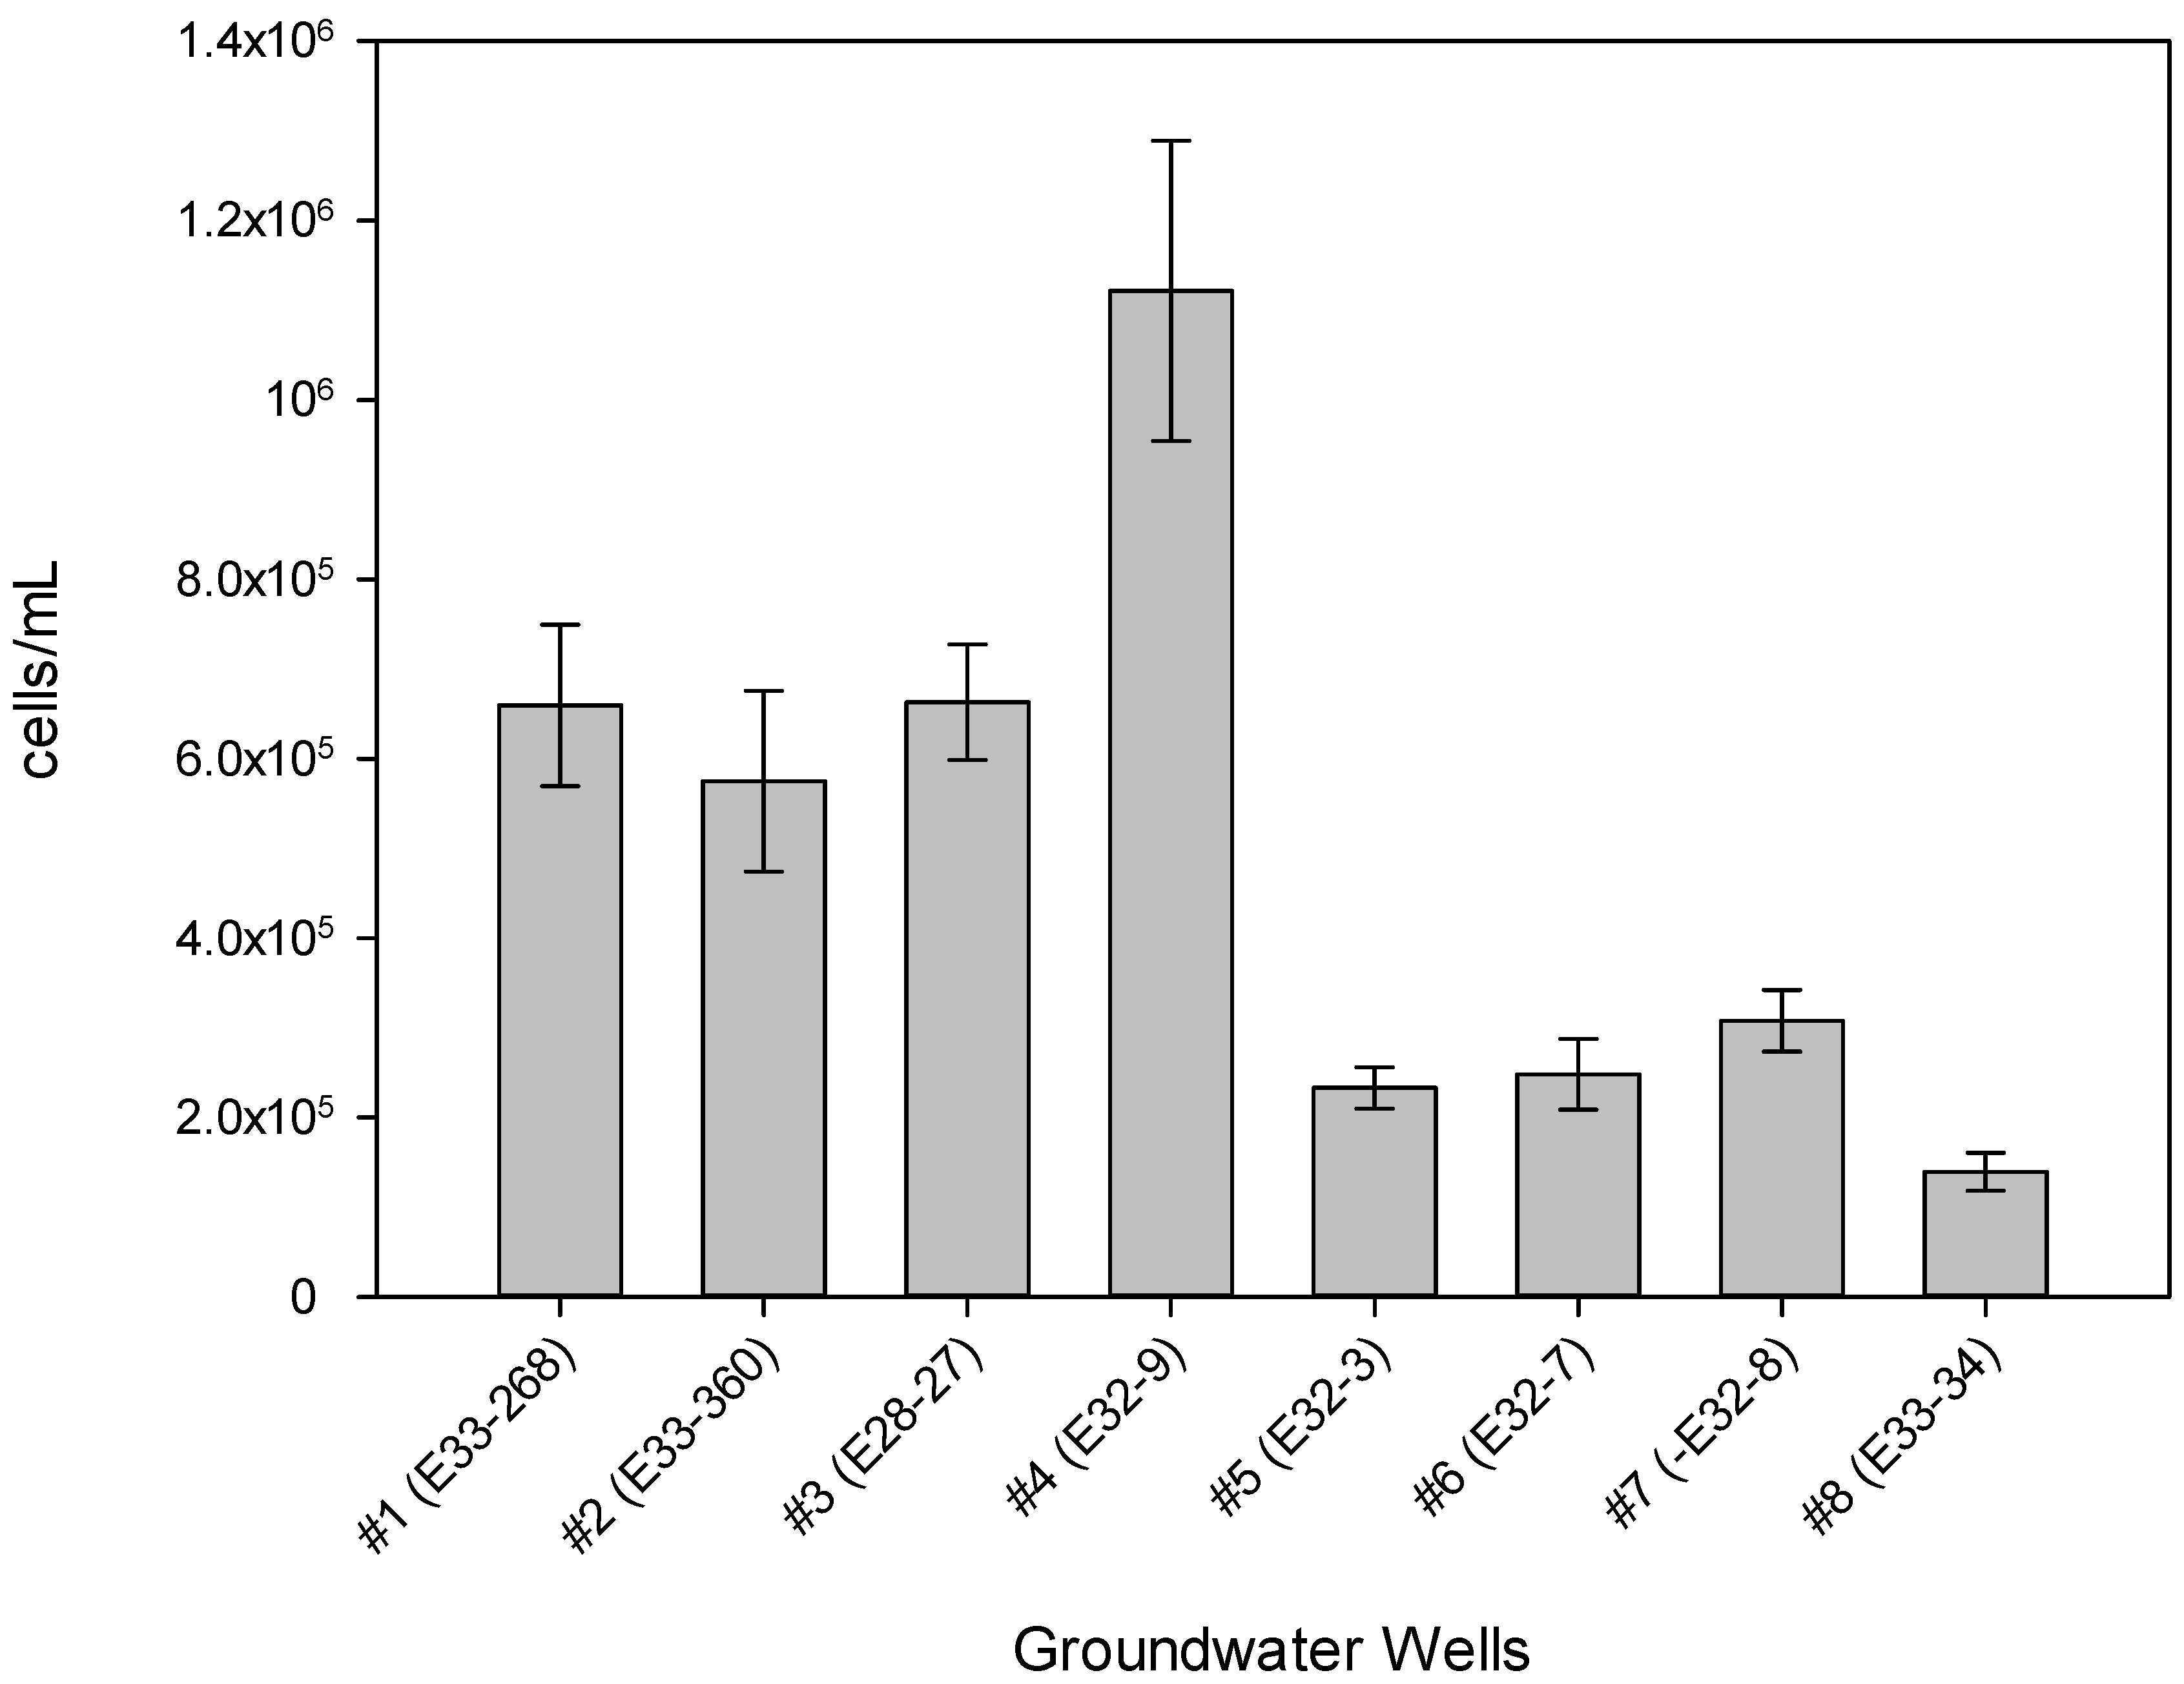
Tritiated leucine uptake by the native BP-5 GW bacteria, incubated aerobically (~20 °C) in ambient (recently collected) GW, varied widely among the wells assayed, from <0.03% in wells #2 (E33-360) and #8 (E33-34) to >8% in well #1 (E33-268) (Table 2; all values based on an 8-h sampling point). In contrast, standing biomass in the well water samples, as indicated by DAPI staining, varied less (Table 2, Figure 2), but still spanned an order of magnitude, from ~1 × 10+5 cells/mL in well #8 to ~1 × 10+6 cells/mL in well #4 (E32-9). These values are as much as ~10 to ~20 times the cell numbers previously observed in GW collected from the Hanford formation in the Columbia River hyporheic zone of the Hanford 300 Area (Figure S1b), 5 × 10+4 to 6 × 10+5 cells/mL [14]). Although rates of 3H-leu uptake, an indication of heterotrophic bacterial productivity, can be related to the corresponding bacteria cell numbers to calculate bacterial growth rates and doubling times [14], such analyses should be treated with some caution. First, the 3H-leu assay is specific for heterotrophic bacteria, such that if significant autotrophic bacteria are present and included in the DAPI counts, then cell doubling times, calculated from values for leucine uptake per cell per unit time, will be underestimated [20]. Second, since our assays were carried out aerobically, any in situ bacterial productivity arising from facultative or strict anaerobes would likely be undetected, again underestimating in situ bacterial productivity. Third, since the DAPI stain is specific for nucleic acids, DAPI counts could include non-bacterial entities, such as viruses, DNA-containing membrane vesicles, and eukaryotes, again leading to underestimates in cell-specific 3H-Leu uptake.
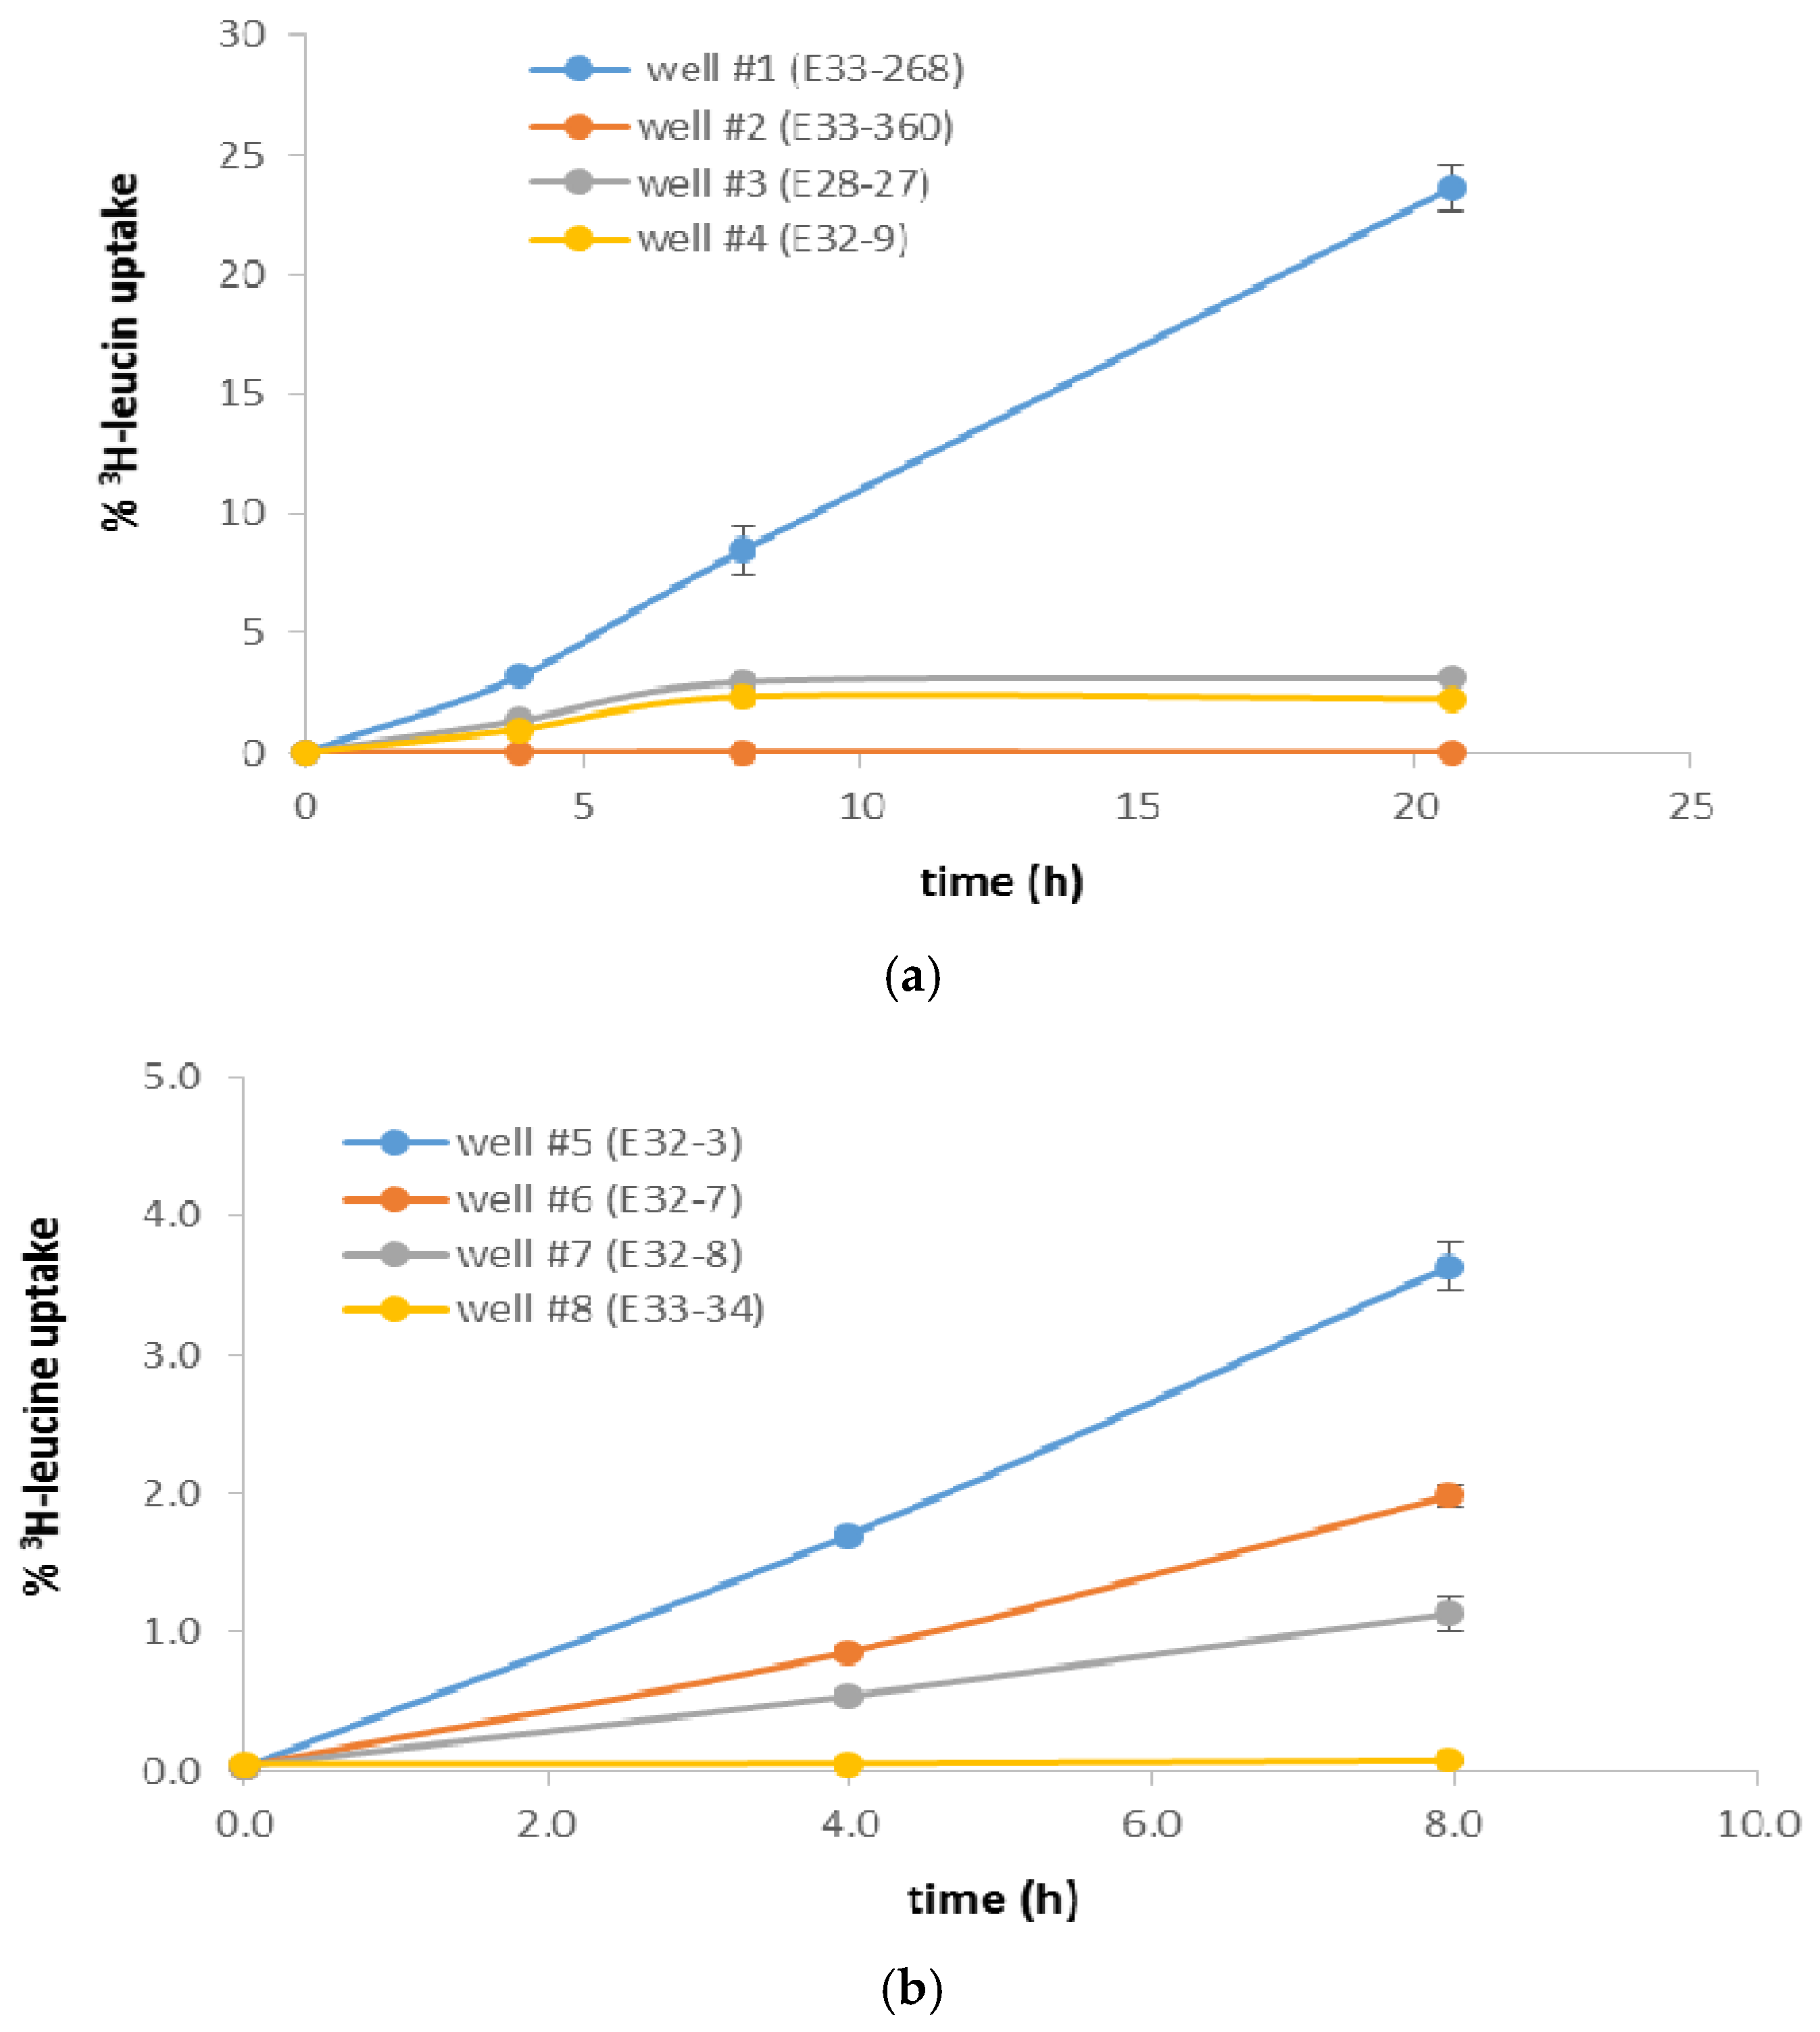
We found 3H-Leu uptake to be nearly linear from 0 to 8 h in all well-water samples (Figure 3a,b). However, in a subset of wells incubated for longer (~21 h), leucine uptake did not increase over the increased incubation time, except for well #1 (Figure 3a). These results suggest that in wells #3 (E28-27) and #4 (E32-9), where 3H-Leu remained constant at ~3% and ~2%, respectively, either (1) some growth factor, such as inorganic phosphorous or organic carbon, became limiting over time or, less likely, (2) some component in the GW exerted a toxic effect that limited bacterial growth to the level seen at 8 h. In contrast, 3H-Leu uptake in well #1 (the BP-5 extraction well for the 200 West Area pump-and-treatment facility) increased from ~8% at 8 h to ~24% at 21 h (Figure 3a), suggesting that neither factor considered above inhibited cell growth in this GW sample over this duration. In support of the first hypothesis, our analysis of this sample showed organic carbon to be 0.5 mg/L and inorganic phosphorous to be 4 µM (data not shown).
Both the lowest and highest leucine uptake were in GW from wells with the highest most recently measured total cyanide concentrations (analysis on GW samples collected at the same time as the samples for biotic analysis), wells #1 and #2. Well #2, a recently (2014) installed monitoring well, had 0.01% 3H-Leu uptake at 8 h and contemporaneous total cyanide concentration 190 µg/L. Well #1, the pump-and-treat extraction well, had ~8% 3H-Leu uptake at 8 h and a contemporaneous total cyanide concentration 297 µg/L. Total cell numbers, as indicated by DAPI staining, were similar in these wells (~6 × 10+5 cells/mL in well #2 and ~7 × 10+5 cells/mL in well #1). Likewise, the proportion of living cells to total cells, as indicated by live/dead staining were similar in both wells (data not shown). In addition to the aforementioned organic carbon and inorganic phosphorus measured in well #1, it is possible that the GW extraction process may increase the proportion of viable heterotrophic, aerobic bacteria in the GW collected via some physical effect. In addition, the redox potential in the P&T well (#1, +16 mV) was lower than in the monitoring well (#2, + 304 mV), possibly indicating greater electron-consuming bacterial activity in the P&T well. The other well showing low 3H-Leu uptake (0.03%), well #8 (E33-34), also had the lowest total cell numbers (1.4 × 10+5 cells/mL, Table 2 and Figure 2). The most recent total CN− measurement in this well was 100 µg/L, and this well had a historical maximum total CN− concentration of 558 µg/L, the highest historical value seen in this set of wells (Table 2).
Aqueous speciation modeling of the most recent GW chemistry data from well #1 showed that strong-acid dissociable iron-cyanide species accounted for 93% of cyanide species, while free cyanide accounted for 6.5% (Table 3). In contrast, in well #2, only 77% of CN− species were SAD, while 22% were free cyanide (Table 4). Weak-acid dissociable (WAD) species were 0.21% and 0.40% in wells #1 and #2, respectively. Iron speciation in the two wells indicated that 88% and 78% of the Fe in wells #1 and #2, respectively, was cyanide-associated (Table S2). However, these values are for total (unfiltered) Fe, rather than filtered (aqueous) Fe. Likewise, CN− values are on unfiltered samples. Given that CN(aq) and Fe(aq) values are not available for these wells (Table S1), we cannot determine how much of the Fe and CN− may have been either colloidal or particulate. However, all of the other wells examined had recent Fe values that were at or near the Fe detection limit (Table S1), suggesting that Fe(aq) and CN−(aq) may be lower than the total values used here for aqueous speciation analysis. Also, at the approximate time that well #2 (E33-360) was constructed (2014), the Eh measurement was −157 mV, significantly lower than the Eh value reported in Table 1 (+304 mV). Re-analysis of aqueous speciation for the given well chemistry data set using this much lower, reducing Eh indicated that lowering the redox potential increases the proportion of SAD (86%) and lowers the amount of free cyanide in solution (14% at the historical low Eh vs. 22% at the most recent, much higher Eh).
Statistical analyses indicated that 3H-Leu uptake was significantly correlated with contemporaneous chemistry data for Fe (Pearson’s r = 0.76, P = 0.01) and Eh (Pearson’s r = −0.68, P = 0.03), and also with the historical maximums for manganese (Mn) (Pearson’s r = 0.63, P = 0.046) (Table S3a). However, no significant correlation was found with total CN− (Pearson’s r = 0.47, P = 0.12) (Table S3a). We also found that the most recent total cyanide data for the eight wells correlated strongly with Eh (Pearson’s r = 0.94, P < 0.001), NO3− (Pearson’s r = 0.94, P < 0.001), and specific conductance (Pearson’s r = 0.95, P < 0.001) (Table S3b), suggesting chemical rather than biotic drivers of CN− recent concentrations.
4. Discussion
Our results do not implicate cyanide toxicity in limiting heterotrophic bacterial productivity in the cyanide-affected aquifer examined here. This result is consistent with other aquatic toxicity studies of ferrocyanide, ferric ferrocyanide, and other iron cyanide compounds, and with what is known about the chemical stability of these compounds. A literature review indicates multiple instances of free cyanide (HCN + CN−) rendering bacterial toxicity [9,10,11,12,13]. However, except for a single study with a cyanobacterium and a Pseudomonas, both in pure culture (where free cyanide was not measured) [9], bacterial toxicity has not been observed at total cyanide concentrations measured in BP-5 (~1600 µg/L maximum). However, confirmation of our results would require additional BP-5 GW sampling and 3H-Leu analysis in space and time, and over a larger range of CN− contamination levels in the aquifer. Additionally, iron concentrations in the BP-5 operable unit have been shown to roughly track total cyanide concentrations [5]. Consequently, it is possible that CN−-derived iron from the originally disposed ferrocyanide could also exert negative microbial affects in the aquifer, if the iron cyanide complexes over time have dissociated, or if the cyanide has been subject to biodegradation or other degradative fates, due to iron toxicity, or to bacterial stress from reactive oxygen species resulting from reactions of dissolved ferrous iron. In one study [27], ferrous iron toxicity to Streptococci from the human oral cavity was found to be relieved by the addition of ferrocyanide.
In addition, alternate BP-5 GW microbial probing, such as anaerobic tritiated leucine uptake for anaerobic bacteria or carbon-14 labelled bicarbonate (H14CO3−) incorporation for autotrophs, might provide a more complete assessment of the bacterial productivity in the BP-5 Operable Unit, and could provide additional information on factors limiting bacterial productivity. It is possible that the bacterial biomass in GW from some wells might be dominated by autotrophs, such that bacterial productivity would not be amenable to measurement via the 3H-Leu assay, which is specific for heterotrophs [20]. In Hanford formation sediments from the Hanford 300 Area within the Columbia River hyporheic zone, autotrophic ammonia oxidizers were found to dominate the microbial community in the seasonal absence of river water influx [28]. Likewise, Lee et al. [29] found a variety of autotrophic hydrogen-oxidizing, nitrate-reducing bacteria in GW in the Hanford formation of the 300 Area, including autotrophic species of Acidovorax, Pseudomonas, and Pelosinus (published and unpublished data from Lee et al. [29]). In addition, although CN− is primarily inhibitory to aerobic metabolic processes, there are reports of CN− inhibition of anaerobic microbial processes, such as denitrification [10,11], so effects on anaerobic bacteria may be relevant.
5. Conclusions
We did not find a correlation between tritiated leucine uptake, as an indication of aerobic heterotrophic bacterial productivity, and total cyanide values for the wells examined (both in terms of recent values and historical high values). However, more biological data in space and time would be required to conclude with certainty that CN− contamination in the aquifer is unlikely to inhibit microbially facilitated in situ attenuation and degradation of co-contaminants, under either bioremediation or monitored natural attenuation scenarios. In addition, data on aqueous (filtered) values for Fe and CN− would give a better picture, since some or most of the CN− measured in the GW may be colloidal or suspended, and therefore presumably of low toxicity. Our results also indicate that the 3H-leucine assay, which was developed for marine systems [20] and which has been widely adopted for surficial freshwater studies, is a valid tool to assess productivity of groundwater bacteria in relation to geochemical factors, confirming recent attempts to adapt the technique to aquifers, both those that are influenced by surface water inputs [14,18] and those that are not (this study [19]).
Supplementary Materials
The following are available online at https://www.mdpi.com/2073-4441/10/8/1072/s1, Figure S1: (a): Location of the Hanford Site in Washington State, U.S. (inset), along with groundwater plumes (as of 2016), Figure S1: (b): Location of the Hanford Site in Washington State, U.S. (inset), and the Hanford 200 and 300 Areas, Figure S2: (a): Generalized Hanford Site Stratigraphy, Figure S2: (b): Generalized Hanford Site stratigraphy, lithostratigraphy, and hydrostratigraphy, Figure S3: (a): Groundwater plumes of cyanide and other contaminants in the BP-5 Operable Unit, Figure S3: (b): Locations of the Hanford Site cyanide plumes, Figure S4: Locations of the groundwater wells sampled for this study, Table S1: Summary of data for the wells examined, based on results of this study and data from the Hanford Environmental Information System (HEIS), Table S2: Aqueous speciation modeling results for well #1 (E33-268) and well #2 (E33-360), Table S3a: 3H-Leu uptake correlations, Table S3b: Recent groundwater [CN−] correlations.
Author Contributions
Conceptualization, A.P. and B.L.; Methodology, A.P., E.G., O.Q., and S.B.; Formal Analysis, E.G. and O.Q.; Investigation, A.P., J.W., and S.B.; Resources, B.L.; Writing-Original Draft Preparation, A.P., J.W., E.G., O.Q., and S.B.; Visualization, E.G.; Supervision, A.P.; Project Administration, A.P.; Funding Acquisition, A.P.
Funding
This research was supported under the Deep Vadose Zone–Applied Field Research Initiative at Pacific Northwest National Laboratory. Funding for this work was provided by the U.S. Department of Energy (DOE) Richland Operations Office. The Pacific Northwest National Laboratory is operated by Battelle Memorial Institute for the DOE under Contract DE-AC05-76RL01830.
Acknowledgments
The authors thank Vicky Freedman and Chris Brown for supporting this project. We also thank Elsa Cordova, Danielle Saunders, and Michelle Snyder for assistance in sample acquisition and processing, and we thank Alicia Gorton for guidance in accessing the HEIS database. We also thank Kevin Rosso for providing a domestic well-water sample for methodological testing and Christopher (Kitt) Bagwell for reviewing a draft of the manuscript.
Conflicts of Interest
The authors declare no conflict of interest. The funders had no role in the design of the study; in the collection, analyses, or interpretation of data; in the writing of the manuscript, and in the decision to publish the results.
References
- Gephart, R.E. A short history of waste management at the Hanford Site. Phys. Chem. Earth. 2010, 35, 298–306. [Google Scholar] [CrossRef]
- Hoitink, D.J.; Burk, K.W.; Ramsdell, J.V., Jr.; Shaw, W.J. Hanford Site Climatological Summary 2004 with Historical Data; Pacific Northwest National Laboratory: Richland, WA, USA, 2005; pp. 1–382. [Google Scholar]
- Fayer, M.J.; Keller, J.M. Recharge Data Package for Hanford Single-Shell Tank Waste Management Areas; PNNL-16688; Pacific Northwest National Laboratory: Richland, WA, USA, 2007. [Google Scholar]
- Hanford Groundwater Monitoring Report for 2016; DOE/RL-2016-67; CH2M Hill Plateau Remediation Company: Richland, WA, USA, 2017.
- Remedial Investigation Report for the 200-BP-5 Groundwater Operable Unit; DOE/RL-2009-127; CH2M Hill Plateau Remediation Company: Richland, WA, USA, 2015; pp. 1–424.
- Cash, R.J.; Meacham, J.E.; Lilga, M.A.; Babad, H. Resolution of the Hanford Site Ferrocyanide Safety Issue; HNF-SA-3126-FP; DE&S Hanford, Inc., Pacific Northwest National Laboratory, Babad Technical Services: Richland, WA, USA, 1997; pp. 1–10. [Google Scholar]
- What Are EPA’s Drinking Water Regulations for Cyanide? Available online: https://safewater.zendesk.com/hc/en-us/articles/212077077-4-What-are-EPA-s-drinking-water-regulations-for-cyanide- (accessed on 10 August 2018).
- Dzombak, D.; Ghosh, R.; Young, T. Physical-Chemical Properties and Reactivity of Cyanide in Water and Soil. In Cyanide in Water and Soil: Chemistry, Risk, and Management; Dzombak, D., Ghosh, R., Young, T., Eds.; Taylor & Francis: Boca Raton, FL, USA, 2006; pp. 57–92. ISBN 9781566706667. [Google Scholar]
- Bringmann, G.; Kuehn, R. Comparative results of the damaging effects of water pollutants against bacteria (Pseudomonas putida) and blue algae (Microcystis aeruginosa). GWF Wasser/Abwasser 1976, 117, 410–413. (In Germany) [Google Scholar]
- Kapoor, V.; Elk, M.; Li, X.; Santo Domingo, J.W. Inhibitory effect of cyanide on wastewater nitrification determined using SOUR and RNA-based gene-specific assays. Lett. Appl. Microbiol. 2016, 63, 155–161. [Google Scholar] [CrossRef] [PubMed]
- Kim, Y.M.; Cho, H.U.; Lee, D.S.; Park, D.; Park, J.M. Comparative study of free cyanide inhibition on nitrification and denitrification in batch and continuous flow systems. Desalin. 2011, 279, 439–444. [Google Scholar] [CrossRef]
- Kim, Y.M.; Cho, H.U.; Lee, D.S.; Park, D.; Park, J.M. Influence of operational parameters on nitrogen removal efficiency and microbial communities in a full-scale activated sludge process. Water Res. 2011, 45, 5785–5795. [Google Scholar] [CrossRef] [PubMed]
- Kim, Y.M.; Lee, D.S.; Park, C.; Park, D.; Park, J.M. Effects of free cyanide on microbial communities and biological carbon and nitrogen removal performance in the industrial activated sludge process. Water Res. 2010, 45, 1267–1279. [Google Scholar] [CrossRef] [PubMed]
- Konopka, A.; Plymale, A.E.; Carvajal, D.A.; Lin, X.; McKinley, J.P. Environmental controls on the activity of aquifer microbial communities in the 300 area of the Hanford Site. Microb. Ecol. 2013, 66, 889–896. [Google Scholar] [CrossRef] [PubMed]
- Gensemer, R.W.; DeForest, D.K.; Stenhouse, A.J.; Higgins, C.J.; Cardwell, R.D. Aquatic toxicity of cyanide. In Cyanide in Water and Soil: Chemisty, Risk, and Management; Dzombak, D., Ghosh, R., Young, T., Eds.; Taylor & Francis: Boca Raton, FL, USA, 2006; pp. 251–284. ISBN 9781566706667. [Google Scholar]
- Bååth, E.; Pettersson, M.; Söderberg, K.H. Adaptation of a rapid and economical microcentrifugation method to measure thymidine and leucine incorporation by soil bacteria. Soil Biol. Biochem. 2001, 33, 1571–1574. [Google Scholar] [CrossRef]
- Demoling, F.; Figueroa, D.; Bååth, E. Comparison of factors limiting bacterial growth in different soils. Soil Biol. Biochem. 2007, 39, 2485–2495. [Google Scholar] [CrossRef]
- Velasco Ayuso, S.; López-Archilla, A.; Montes, C.; Guerrero, M.C. Microbial activities in a coastal, sandy aquifer system (Doñana Natural Protected Area, SW Spain). Geomicrobiol. J. 2010, 27, 409–423. [Google Scholar] [CrossRef]
- Wilhartitz, I.C.; Kirschner, A.K.T.; Stadler, H.; Herndl, G.J.; Dietzel, M.; Latal, C.; Mach, R.L.; Farnleitner, A.H. Heterotrophic prokaryotic production in ultra-oligotrophic alpine karst aquifers and ecological implications. FEMS Microbiol. Ecol. 2009, 68, 287–299. [Google Scholar] [CrossRef] [PubMed]
- Kirchman, D. Measuring bacterial biomass production and growth rates from leucine incorporation in natural aquatic environments. Methods Microbiol. 2001, 30, 227–237. [Google Scholar]
- Kepner, R.L.; Pratt, J.R. Use of fluorochromes for direct enumeration of total bacteria in environmental samples: past and present. Microbiol. Rev. 1994, 58, 603–615. [Google Scholar] [PubMed]
- The Geochemist's Workbench; 12.0.1; Aqueous Solutions LLC: Champaign, IL, USA, 2015.
- Sehmel, G.A. Cyanide and Antimony Thermodynamic Database for the Aqueous Species and Solids for the EPA-Minteq Geochemical Code; PNNL-6835; Pacific Northwest National Laboratory: Richland, WA, USA, 1989; pp. 1–224. [Google Scholar]
- The R Project for Statistical Computing. Available online: https://www.r-project.org/ (accessed on 10 August 2018).
- Ribeiro, P.J., Jr.; Diggle, P.J. geoR: A package for geostatistical analysis. R News 2001, 1, 14–18. [Google Scholar]
- Furrer, R.; Nychka, D.; Sain, S. Fields: Tools for Spatial Data; 6.11. R Foundation, 2009. Available online: http://citeseerx.ist.psu.edu/viewdoc/summary?doi=10.1.1.304.1555 (accessed on 10 August 2018).
- Dunning, J.C.; Ma, Y.; Marquis, R.E. Anaerobic killing of oral streptococci by reduced, transition metal cations. Appl. Environ. Microbiol. 1998, 64, 27–33. [Google Scholar] [PubMed]
- Graham, E.B.; Crump, A.R.; Resch, C.T.; Fansler, S.; Arntzen, E.; Kennedy, D.W.; Fredrickson, J.K.; Stegen, J.C. Deterministic influences exceed dispersal effects on hydrologically-connected microbiomes. Environ. Microbiol. 2017, 19, 1552–1567. [Google Scholar] [CrossRef] [PubMed]
- Lee, J.-H.; Fredrickson, J.K.; Plymale, A.E.; Dohnalkova, A.C.; Resch, C.T.; McKinley, J.P.; Shi, L. An Autotrophic H2-oxidizing, Nitrate-Respiring, Tc(VII)-Reducing Acidovorax sp. Isolated from a Subsurface Oxic-Anoxic Transition Zone. Environ. Microbiol. Rep. 2015, 7, 395–403. [Google Scholar] [CrossRef] [PubMed]
Figure 1.
Historical maximum (A) and recent (B) [CN−] values in spatial relation to the wells examined for this study, as interpolated by kriging.
Figure 1.
Historical maximum (A) and recent (B) [CN−] values in spatial relation to the wells examined for this study, as interpolated by kriging.

Figure 2.
Microbial cell density (cells/mL) in groundwater samples, as determined by DAPI staining and epifluorescence microscopy.
Figure 2.
Microbial cell density (cells/mL) in groundwater samples, as determined by DAPI staining and epifluorescence microscopy.

Figure 3.
(a) Tritiated leucine uptake (as percentage of label added) in wells #1–#4, from 0 to 21 h. Results are based on duplicates, with standard deviation bars as shown. (b) Tritiated leucine uptake (as percentage of label added) in wells #5–#8, from 0 to 8 h. Results are based on duplicates, with standard deviation bars as shown.


Table 1.
Selected information on the wells sampled for this study (for more detailed information, see Table S1). Well #1 (E33-268) is an extraction well. Wells #2–#8 are monitoring wells.
Table 1.
Selected information on the wells sampled for this study (for more detailed information, see Table S1). Well #1 (E33-268) is an extraction well. Wells #2–#8 are monitoring wells.
| Well # | Depth to Ground-Water when Sampled (ft bgs) 1 | Date of Well Construction (year) 1 | Elevation (m) 1 | Depth (ft) 1 | Screened Interval(s) (ft bgs) 1 |
|---|---|---|---|---|---|
| #1 (E33-268) | - | 2012 | 198.0 | 263.5 | 241.9–252.4 |
| #2 (E33-360) | - | 2014 | 199.7 | 272.8 | 251.8–271.7 |
| #3 (E28-27) | 284.86 | 1987 | 208.5 | 301.5 | 269.8–289.8, |
| - | - | - | - | - | 291.2–301.5 |
| #4 (E32-9) | 247.52 | 1991 | 197.1 | 254.6 | - |
| #5 (E32-3) | 281.01 | 1987 | 207.3 | 304.0 | 266.2–286.2, |
| - | - | - | - | - | 291–301 |
| #6 (E32-7) | 262.54 | 1991 | 201.7 | 273.8 | 245.6–266.3 |
| #7 (E32-8) | 249.80 | 1990 | 197.8 | 256.7 | 234.7–255.0 |
| #8 (E33-34) | 237.71 | 1990 | 194.1 | 240.0 | 219.0–239.3 |
Notes: 1 Based on data from the Hanford Environmental Information System (HEIS) database, publicly accessible through the Environmental Dashboard Application (https://ehs.hanford.gov/EDA) and PHOENIX (http://phoenix.pnnl.gov). 2 Not applicable: casing 0–254 ft.
Table 2.
Tritiated leucine uptake and microbial cell density observed in the wells examined, along with recent Eh values, recent total cyanide values, and historical maximum cyanide. Values for most recent pH ranged from 7.6 to 8.1 (see Table S1).
Table 2.
Tritiated leucine uptake and microbial cell density observed in the wells examined, along with recent Eh values, recent total cyanide values, and historical maximum cyanide. Values for most recent pH ranged from 7.6 to 8.1 (see Table S1).
| Well # | % 3H-Leu Uptake 1 | Cells/mL 2 | Most Recent Eh (mV) 3 | Most Recent Total CN− (µg/L) 3,4 | Historical Maximum Total CN− (µg/L) 3 |
|---|---|---|---|---|---|
| #1 (E33-268) | 8.42 | 6.6 × 10+5 | +16 | 297 | 492 |
| #2 (E33-360) | 0.0110 | 5.8 × 10+5 | +304 | 190 | 190 |
| #3 (E28-27) | 2.92 | 6.6 × 10+5 | +8 | 4 | 12 |
| #4 (E32-9) | 2.33 | 1.1 × 10+6 | +382 | 22 | 91 |
| #5 (E32-3) | 3.60 | 2.3 × 10+5 | +202 | 4 | 9 |
| #6 (E32-7) | 1.95 | 2.5 × 10+5 | +233 | 4 | 20 |
| #7 (E32-8) | 1.10 | 3.1 × 10+5 | +169 | 40 | 40 |
| #8 (E33-34) | 0.0256 | 1.4 × 10+5 | +369 | 100 | 558 |
Notes: 1 Based on an 8 h time point. 2 As determined by microscopic counting. 3 Based on data from the Hanford Environmental Information System (HEIS) database, publicly accessible through the Environmental Dashboard Application (https://ehs.hanford.gov/EDA) and PHOENIX (http://phoenix.pnnl.gov). 4 Data closest in time to the date of groundwater sampling for the present study.
Table 3.
Aqueous cyanide species for well #1 (E33-268), based on speciation modelling of well groundwater chemistry contemporaneous to the date of groundwater collection for this study. Strong-acid dissociable (SAD), weak-acid dissociable (WAD), and free cyanide account for 93.29, 0.21, and 6.49% of species, respectively.
| Aqueous Species | Concentration (µM) | CN−% |
|---|---|---|
| 1 Fe(CN)64− | 1.296 | 67.07 |
| 1 NaFe(CN)63− | 0.464 | 24.04 |
| 2 HCN(aq) | 0.723 | 6.24 |
| 1 KFe(CN)63− | 0.038 | 1.95 |
| 2 CN− | 0.030 | 0.26 |
| 1 Na2Fe(CN)62− | 0.005 | 0.25 |
| 3 Ni(CN)42− | 0.004 | 0.13 |
| 3 Cu(CN)2− | 0.005 | 0.08 |
Notes: 1 Strong-acid dissociable (SAD). 2 Free cyanide. 3 Weak-acid dissociable (WAD).
Table 4.
Aqueous cyanide species for well #2 (E33-360), based on speciation modelling of well groundwater chemistry contemporaneous to the date of groundwater collection for this study. Strong-acid dissociable (SAD), weak-acid dissociable (WAD), and free cyanide account for 77.24, 0.40, and 22.37% of species, respectively.
| Aqueous Species | Concentration (µM) | CN−% |
|---|---|---|
| 1 Fe(CN)64− | 0.64 | 52.76 |
| 2 HCN(aq) | 1.56 | 21.44 |
| 1 NaFe(CN)63− | 0.24 | 19.88 |
| 1 Fe(CN)63− | 0.04 | 3.14 |
| 1 KFe(CN)63− | 0.02 | 1.44 |
| 2 CN− | 0.05 | 0.64 |
| 3 Ni(CN)42− | 0.01 | 0.39 |
| 1 Na2Fe(CN)62− | 0.00 | 0.22 |
Notes: 1 Strong-acid dissociable (SAD). 2 Free cyanide. 3 Weak-acid dissociable (WAD).
© 2018 by the authors. Licensee MDPI, Basel, Switzerland. This article is an open access article distributed under the terms and conditions of the Creative Commons Attribution (CC BY) license (http://creativecommons.org/licenses/by/4.0/).
Share and Cite
MDPI and ACS Style
Plymale, A.; Wells, J.; Graham, E.; Qafoku, O.; Brooks, S.; Lee, B. Bacterial Productivity in a Ferrocyanide-Contaminated Aquifer at a Nuclear Waste Site. Water 2018, 10, 1072. https://doi.org/10.3390/w10081072
AMA Style
Plymale A, Wells J, Graham E, Qafoku O, Brooks S, Lee B. Bacterial Productivity in a Ferrocyanide-Contaminated Aquifer at a Nuclear Waste Site. Water. 2018; 10(8):1072. https://doi.org/10.3390/w10081072
Chicago/Turabian StylePlymale, Andrew, Jacqueline Wells, Emily Graham, Odeta Qafoku, Shelby Brooks, and Brady Lee. 2018. "Bacterial Productivity in a Ferrocyanide-Contaminated Aquifer at a Nuclear Waste Site" Water 10, no. 8: 1072. https://doi.org/10.3390/w10081072
Note that from the first issue of 2016, this journal uses article numbers instead of page numbers. See further details here.