Valuation and Pricing of Agricultural Irrigation Water Based on Macro and Micro Scales


1
College of Science, Northeast Agricultural University, Harbin 150030, China
2
College of Engineering, Northeast Agricultural University, Harbin 150030, China
3
School of Water Conservancy & Civil Engineering, Northeast Agricultural University, Harbin 150030, China
*
Author to whom correspondence should be addressed.
Water 2018, 10(8), 1044; https://doi.org/10.3390/w10081044
Submission received: 19 July 2018
/
Revised: 1 August 2018
/
Accepted: 3 August 2018
/
Published: 7 August 2018
(This article belongs to the Section Water Resources Management, Policy and Governance)
Abstract
:Research on water pricing is important to effectively address the water resource crisis. The agricultural industry has the greatest water-saving potential. Using Heilongjiang Province, the main grain-producing region in China, as an example, an agricultural irrigation water price was determined based on macro and micro scales, and affordable water prices for peasants were calculated. The results show a macro-agricultural irrigation water price of 1.023 yuan/m3, indicating that the current agricultural irrigation water price does not reflect the water source value. The micro-agricultural irrigation water prices for surface water and groundwater range from 0.993 to 1.008 and from 2.343 to 2.358 yuan/m3, respectively, indicating differences in cost recovery and value. The surface water prices for maize, rice, and soybeans ranged from 0.286 to 0.476, from 0.101 to 0.179, and from 0.180 to 0.307 yuan/m3, respectively, while the appropriate groundwater prices ranged from 0.317 to 0.507, from 0.131 to 0.210, and from 0.211 to 0.337 yuan/m3, respectively. The government could formulate different subsidy policies according to the actual situation and raise agricultural irrigation water prices to the full-cost level to enable the implementation of law of value.
1. Introduction
Water is an indispensable natural resource for human survival and development. The continuous development of socioeconomic water demand, water resource shortages, degradation of the water environment, and water security issues are becoming increasingly serious. In stark contrast, the price of water is generally low, which neither objectively reflects the scarcity of water resources nor contributes to solutions for water resource problems.
The typical methods of pricing include calculating shadow prices for various types of water resources using mathematical models [1], using the full cost of water resources [2], or using farmers’ willingness to pay for water [3] as a reference for pricing. As relevant research has progressed, the value of water resources has attracted attention. It was proposed in [4] that the essence of value was in the capitalization of water resource rent, upon which the differences in price and value of water resources would be clarified. Scholars have estimated the value of water resources by employing equilibrium pricing [5], value mosaic [6], emergy estimation [7], and fuzzy comprehensive evaluation [8]. In addition, there is clear theoretical and empirical evidence that using price to manage water demand is more cost-effective than other approaches [9]. Even in the absence of water metering, an incentive water pricing instrument could influence farming behavior toward a more efficient use of water [10]. Therefore, the rational pricing of agricultural irrigation water has become the focus [11,12,13,14]. Besides, as pointed out in [15], water pricing is not a single instrument of control, and a subsidy may be necessary. As concluded in [16], cost is also an important factor to be considered when establishing a pricing policy for irrigation water.
Based on the available literature, we found that studies typically applied a single method to estimate agricultural irrigation water prices. Few comparisons and analyses include different price-measurement levels, which likely affects the calculation of reasonable agricultural irrigation water prices and the associated implementation of pricing policies. Therefore, agricultural irrigation water prices are determined at both the macro and micro scale in this paper. The macro-agricultural price reflects the marginal benefit of agricultural water to the national economy, and the micro-agricultural price reflects the full cost of agricultural irrigation water use. In order to reduce the burden on peasants and ensure the effective implementation of agricultural irrigation water charge, on the basis of analyzing affordable prices for peasants and with the goal of achieving a lower bound of the full-cost price, agricultural irrigation water prices and the government’s subsidy policy are given, and are applied according to the cultivation of major crops in the main grain-producing region in China, Heilongjiang Province, to ensure regional agricultural production and food security.
2. Materials and Methods
2.1. Study Area
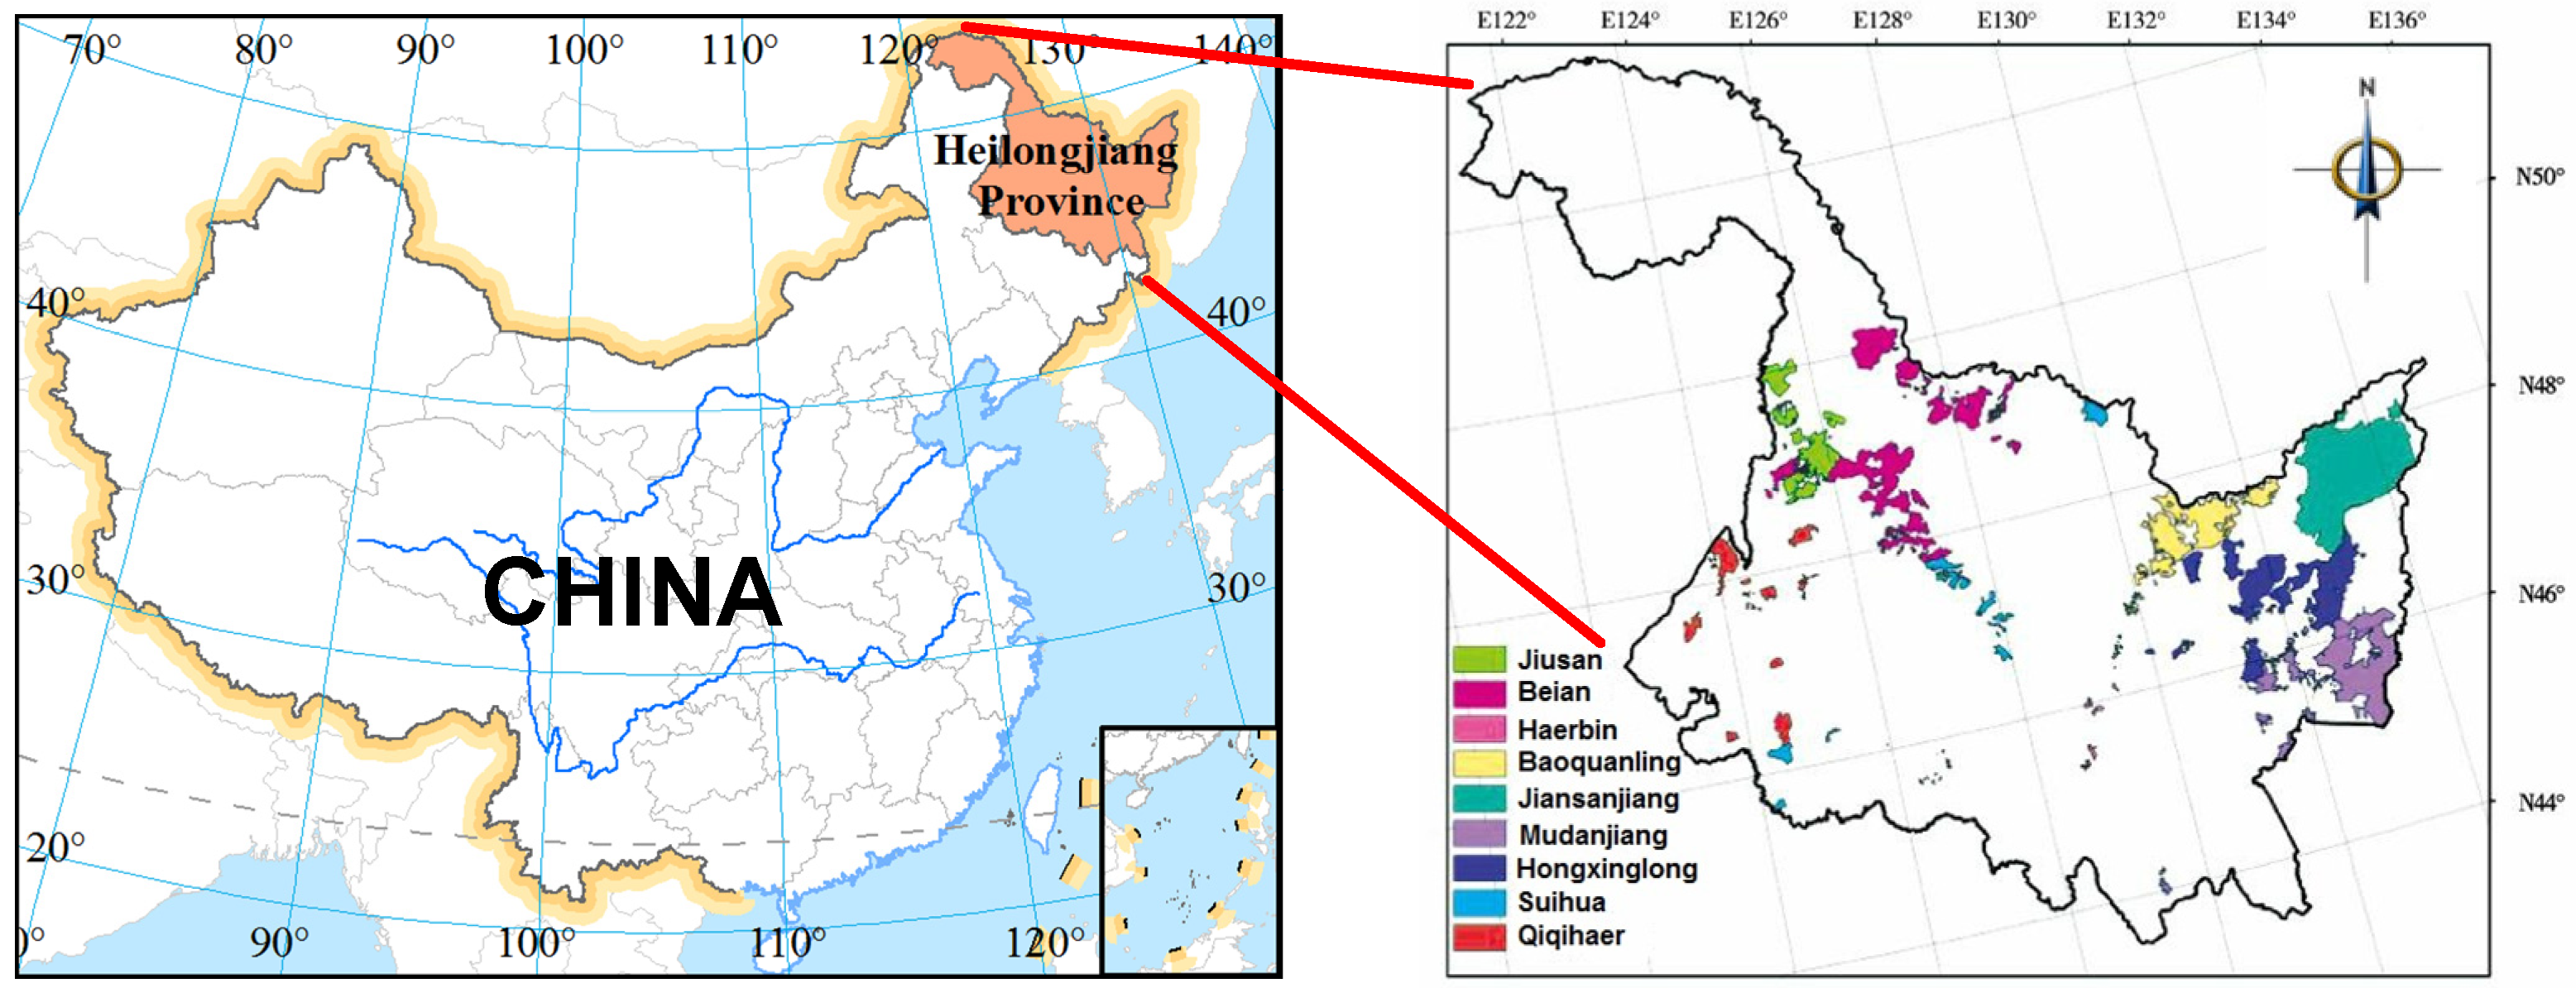
The study area is located at latitude 43°26′–53°33′ N and longitude 121°11′–135°05′ E, with a total land area of 4.53 × 10⁵ km2, of which 33.87% is cultivated land. The average annual rainfall is 400–650 mm. There are 9 state farm bureaus in the study area (Figure 1), and at the end of 2012, there were 323 irrigation districts, 193 reservoirs, 86,544 electromechanical wells, and 223 irrigation and drainage stations. The effective irrigation area was 1.62 × 10⁶ hm2. Applying the full-cost water pricing method to the current water resource cost shows the regional agricultural irrigation water price to be approximately 0.03 yuan/m3, which is close to the current price of 0.02–0.05 yuan/m3. However, according to the China Statistical Yearbook 2012, the amounts of agricultural, industrial, and domestic water consumption in Heilongjiang in 2012 were, respectively, 294.9 × 10⁸ m3, 41.7 × 10⁸ m3, and 16.3 × 10⁸ m3, with a ratio of 0.836:0.118:0.046; and the corresponding water fees were 0.02–0.05 yuan/m3 [17], 3.0–4.3 yuan/m3 [18], and 1.2–2.4 yuan/m3 [18] (paid by water users to the water supply company), with a ratio of approximately 0.006:0.665:0.328 (comparing intermediate values). The total output values of the agricultural, industrial, and service sectors were, respectively, 2113.7 × 108 yuan, 6037.6 × 108 yuan, and 5540.3 × 108 yuan, with a ratio of 0.154:0.441:0.405. These data and ratios show that the current agricultural irrigation water price is far below the industrial and domestic water prices. Hence, the price lever in promoting agricultural water savings has not been effectively exploited. At the same time, the total value of agricultural output was the lowest of the 3 major sectors and does not fully reflect the value of water resources. It is necessary to calculate reasonable agricultural irrigation water prices for the scientific use of regional water resources and to protect the water environment and reduce water pollution.
2.2. Determination of Macro-Agricultural Irrigation Water Price
As early as 1931, Leontief carried out the first economic analysis with input–output tables and mathematical models [19]. In this paper, we determined the macro price based on an input–output analysis. As shown in Table 1, the input–output table for Heilongjiang Province in 2012 was divided into 3 parts. Part I reflects the intersectoral relationships within an economy (, where is the sector that inputs the product and is the sector that uses the product), part II reflects the final demand for the production of sector , and part III reflects the constitution of the added value of sector . An additional row shows the amount of water used in sector in the study area in 2012 (), which is an input to part I and completes the water resource input–output table (see Table 1). The input–output computable general equilibrium (CGE) model of water resources (Equations (1) and (2)) was obtained via linear programming, and its dual solution was used to determine the shadow price of agricultural water resources, or the macro-agricultural irrigation water price:
where is the total surplus (108 yuan) and is the total amount of water consumed (108 m3). For sector , is the final demand and is its lower bound (108 yuan), is import (108 yuan), is total output, and are its upper and lower bounds (108 yuan). For sector , is surplus (108 yuan), is the profit ratio coefficient, is the direct water consumption coefficient, is the added value and is its lower bound (108 yuan), is the total input (108 yuan), is the direct consumption coefficient matrix, and is the material consumption coefficient matrix.
2.3. Determination of Micro-Agricultural Irrigation Water Price
The European Environment Agency (EEA) uses the principle of full-cost recovery to evaluate water prices in the European Union [20,21,22]. The full-cost water price is widely believed to best reflect the commercialization of water resources [23]. Under the guidance of China’s basic national conditions and the theory of sustainable development, Wang proposed that the full-cost water price should be composed of resource cost, project cost, environmental cost, and reasonable profit and tax revenue [24]. For agriculture, profit and tax revenue are not counted. The “Water pricing framework in China” was constructed in [25], clearly showing the category of water price (resource charge, services charge, environmental charge). Based on the theory, we used resource cost (), project cost (), and environmental cost () to determine the full-cost water price () and represent the micro-agricultural irrigation water price in this paper. Emergy theory was applied to estimate the cost of natural resources that are not transformed by human labor (e.g., natural rainfall, surface water, groundwater). The cost of water supply for engineering of state farms was used to estimate project cost, and environmental cost was determined by economic loss due to water environment degradation as accounted for by econometric theory.
The specific steps are as follows:
Step 1: Determine resource cost
The resource cost () reflects the natural value of water resources. The emergy theory proposed by H.T. Odum provides objective and quantitative criteria for the scientific evaluation of natural resource value, which can truly reflect the cost of natural resources [26]. In this research, we chose the emergy theory to determine the natural value of water resources, integrating the solar emergy in water with currency in reality, so that the natural value of water resources can be shown in the form of price. That is, rainfall was used as the energy source of natural water resources, and a conversion between emergy and currency was completed by EDR (the ratio of emergy to gross domestic product, GDP) to calculate the resource cost using Equation (3):
where , , and are the chemical energy of rainfall, surface water, and groundwater (J), respectively; , , and are the total amount of rainfall, surface water, and groundwater (108 m3), respectively; is the Gibbs free energy value (J/g); is the density of water (g/cm3); is rainfall solar emergy (sej); is rainfall solar transformity (sej/J) [26]; and are solar emergy per unit surface water and groundwater (sej/m3), respectively; and are the resource cost per unit of surface water and groundwater (yuan/m3), respectively; and is the ratio of emergy to GDP (sej/yuan) [27].
Step 2: Determine project cost
The project cost () was determined by the reasonable expenses incurred from agricultural water supply engineering. In this paper, we use a cost accounting method to calculate project cost, including depreciation cost (), overhaul expense (), employee work reward (), employee welfare (), union funds (), and employee education funds (), using Equation (4):
where and are the fixed assets of the original value and net residual value (108 yuan), respectively; values for , , , and are from “Measures of water supply pricing cost supervision and examination of water conservancy project (Trial)”; is the number of years depreciated; is the mean of the effective irrigation area of state farms (104 hm2); is the irrigation water quota (104 m3/hm2); and is the fixed assets investment (108 yuan).
Step 3: Determine the environmental cost
In this paper, the environmental cost () was determined by economic losses due to water environment degradation. Based on econometric theory [28], economic loss caused by the use of pesticides, fertilizers, and plastic mulching during the cultivation process was determined by Equation (5):
where is economic loss due to degradation of the water environment in rural areas (108 yuan); is the average amount of agricultural irrigation water consumption (108 m3); k = 1, 2, …, 6 refers to water quality classifications; is the rural socioeconomic development stage coefficient; is the water scarcity index; is the current agricultural water price (yuan/m3); is the amount of water in the specified water quality class (108 m3); is the ecological function loss rate of different water quality; is Engel’s coefficient for rural areas; and are the amount of water demand and water supply (108 m3), respectively; is the rainfall variation coefficient; and and are the ratios of quarter rainfall and mean quarterly rainfall to annual rainfall, respectively.
Step 4: Determine the full-cost water price
We regarded the sum of the resource cost, project cost, and environmental cost as the full-cost water price as follows:
2.4. Initial Data
Data on employee work rewards, fixed asset investments in agricultural water supply projects, and the mean of effective irrigation areas of state farms came from the Statistical Yearbook of Heilongjiang State Farms 2012. The irrigation water quota came from the Local Standard Water Quota of Heilongjiang Province (DB23/T 727-2009). Data on Engel’s coefficient for rural areas and rainfall data came from the Heilongjiang Statistical Yearbook 2012. The amount of water in the different water quality classes came from the Heilongjiang Province Water Resources Bulletin 2011. The net income and output per unit of cultivated land came from the National Agricultural Product Cost Income Data Compilation 2012. The water quality classifications came from the Surface Water Environmental Quality Standard. Since irrigation water accounts for more than 90% of agricultural water, we used agricultural water consumption to replace agricultural irrigation water consumption; agricultural water consumption came from China Statistical Yearbook 2012.
The initial data for micro-agricultural irrigation water pricing can be seen in Table 2.
3. Results and Discussion
3.1. Macro Water Price
The upper and lower bounds of total output in the CGE model were defined, respectively, as 1.2 and 0.8 times the total output of water resources in the input–output table. The lower bound of the final demand and added value in the CGE model were defined as 0.7 times higher than their values in the water resources input–output table [29]. The dual solution of the CGE model was calculated with Lingo v.11 (Figure 2).
When the amount of water consumption increased, the shadow price gradually decreased, which is consistent with marginal benefit theory. As is depicted in Figure 2, when the total amount of water consumption was 310.0 × 10⁸–325.9 × 10⁸ m3, the dual solution was 3.773 yuan/m3; when the total was 326.0 × 10⁸–427.6 × 10⁸ m3, the dual solution was 1.023 yuan/m3; when the total was 427.7 × 10⁸–430.7 × 10⁸ m3, the dual solution was 0.358 yuan/m3; and when the water consumption was above 430.8 × 10⁸ m3, the dual solution was 0. This trend shows that the CGE model of water resources applied in this study can fully reflect the scarcity of water resources. When the total amount of water consumption in the study area in 2012 was used in the CGE model, the shadow price of agricultural water was 1.023 yuan/m3, indicating that the additional regional benefit brought by adding one unit of agricultural irrigation water was 1.023 yuan.
The macro water price was much higher than the current agricultural irrigation water price. Therefore, the current price reflects neither the water resource value nor the relationship between supply and demand. This discrepancy exists primarily because the government regards agriculture as a basic industry. To ensure economic development and encourage peasants to work on farms, a public welfare water supply system has been implemented, and the agricultural irrigation price of water use has been used as an administrative fee. However, due to the large amount of available water resources used for agriculture, the growth of the national economy has been restricted in recent years. The government is aware of the importance of water resources and is beginning to incorporate them into its commodity price management, but the role of value law in agricultural water resources has not been effectively implemented.
3.2. Micro Water Price
Applying the data in Table 2 to Equations (3)–(6) yielded resource costs of surface water and groundwater of 0.960 and 2.310 yuan/m3, respectively. Project costs were 0.023 yuan/m3 and environmental costs ranged from 0.010 to 0.025 yuan/m3. With these values, the micro-agricultural irrigation water price for surface water and groundwater in the study area ranged from 0.993 to 1.008 and from 2.343 to 2.358 yuan/m3, respectively. These results clearly show that the current agricultural irrigation water price of 0.02–0.05 yuan/m3 is too low for cost recovery.
The full cost of surface water was approximately 57.5% lower than that of groundwater. This difference can mainly be attributed to the lower resource cost of surface water, which reflects the natural value of water resources not developed by humans. This difference also directly reflects the preciousness of groundwater. The full cost of surface water was similar to the macro-agricultural irrigation water price, which suggests that the cost of using surface water can be fully utilized and recovered over time. The full cost of groundwater was higher than the macro-agricultural irrigation water price, indicating an imbalance between income from and expenditure for groundwater. This difference illustrates that it is difficult to recover the cost of groundwater investments. As such, groundwater should be carefully extracted to avoid unnecessary environmental damage caused by its exploitation.
3.3. Affordable Water Price Research
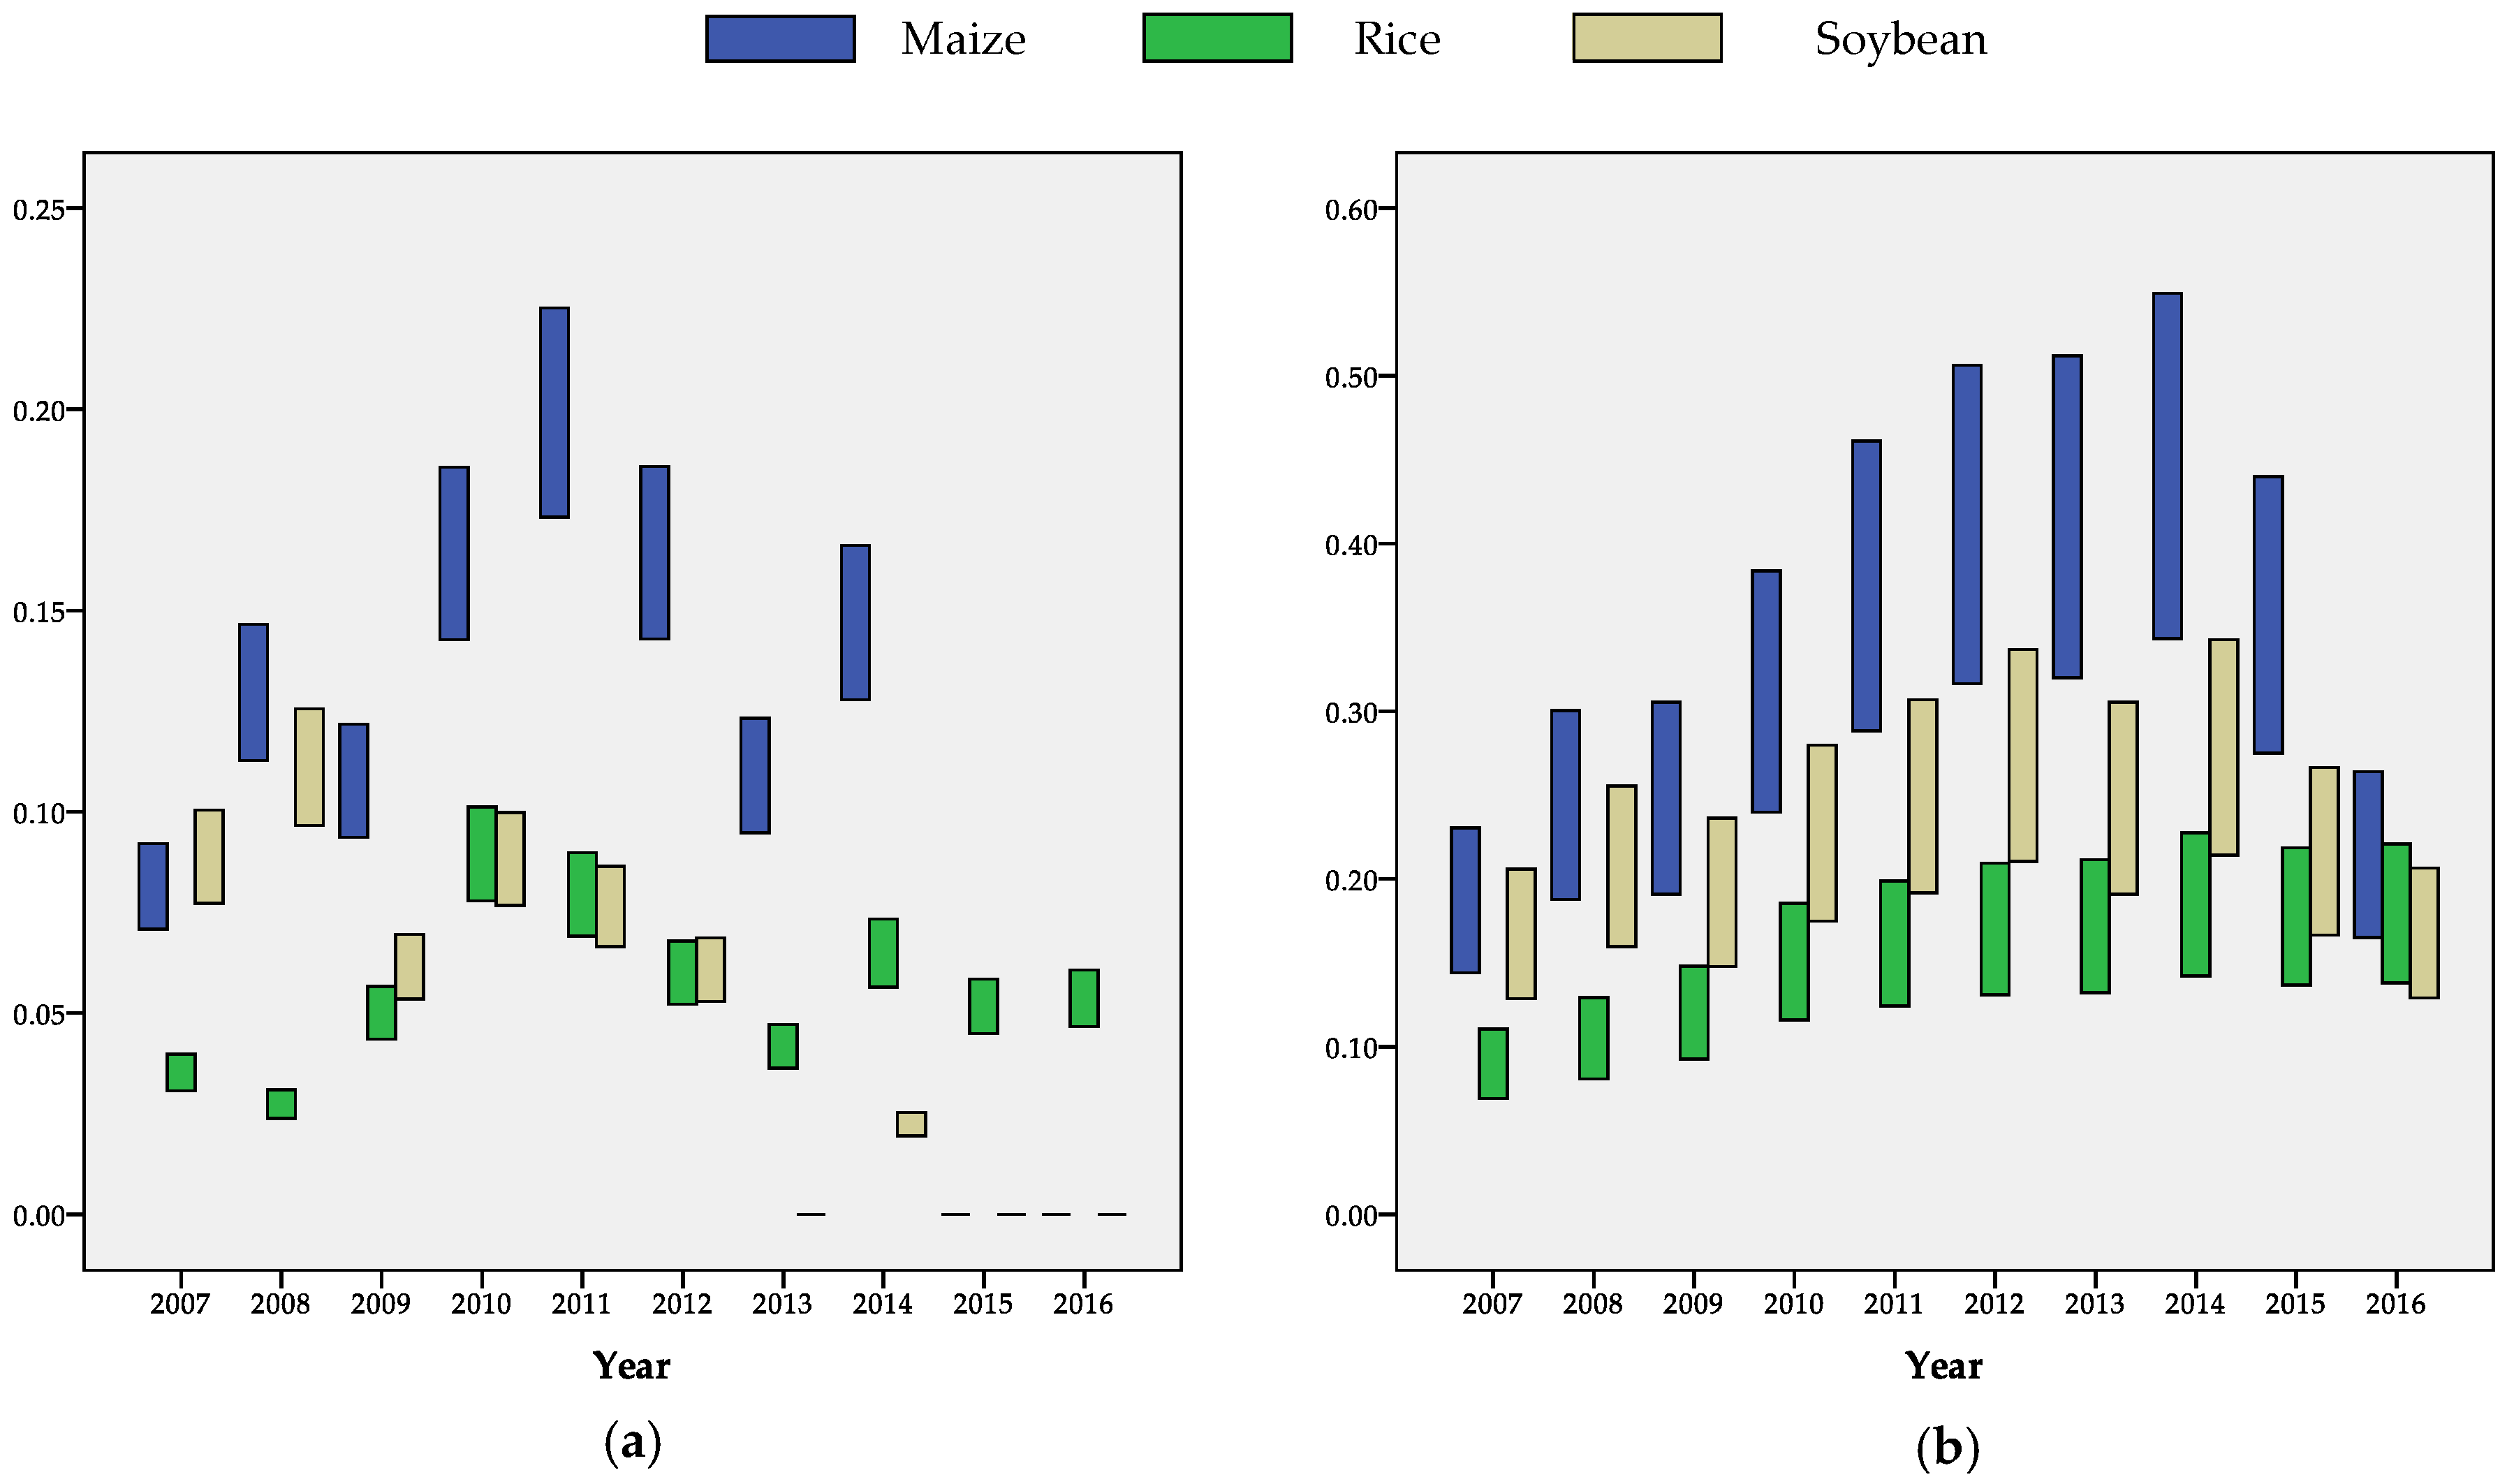
According to a comprehensive analysis by the World Bank in various countries and regions around the world, the ratio of water charge to net income and to output per hm2 can be used to determine the range of affordable water prices for peasants. In the developing country of China, the ratios were set to 10–13% and 5–8%, respectively. In the study area of the present analysis, maize, rice, and soybeans represent the top three crops in terms of area and yield. Furthermore, we suppose that all the irrigation water will be totally used by crops in many forms and not used for any other purpose. Trends from 2007 to 2016 in the range of affordable water prices for the three main crops were analyzed with IBM SPSS Statistics 19 (Figure 3).
Figure 3a shows that the upper affordable water price for maize crops first increased and then decreased between 0.092 and 0.225 yuan/m3 and peaked in 2011 at 0.173–0.225 yuan/m3. After 2015, the net income per hm2 was less than 0, therefore the affordable water price was 0. The major reason for the reduction in net income per hm2 was overcapacity. Specifically, in 2015, China’s total maize production was approximately 2.13 × 10⁸ t, total maize consumption was approximately 2.00 × 10⁸ t, and the gap between production and sales was approximately 0.31 × 10⁸ t, leading to poor sales (according to the Report on the Development of China Cereals Security, 2014–2015). The upper affordable water price for rice crops fluctuated between 0.040 and 0.101 yuan/m3 due to the government’s combined efforts to prevent droughts, resist natural disasters [30], and vigorously promote rice planting and guarantee rice prices, thereby ensuring a stable net income from rice crops. The upper affordable water price for soybean crops oscillated between 0 and 0.126 yuan/m3 and was 0 in 2013, 2015, and 2016. The major reason for these oscillations was that the study area is the major soybean production area of China, and the price of native soybeans is greatly affected by the price of imported soybeans. For example, the average price of imported soybeans in 2013 was 4374.75 yuan/t, while the average sales price in the study area was 4522.4 yuan/t, and net income per hm2 tended to be negative. Subsequently, affordable water prices for maize, rice, and soybeans rebounded in 2014 to 0.128–0.166, 0.057–0.073, and 0.020–0.025 yuan/m3, respectively. The rebound occurred because the weather conditions in 2014 were more suitable for these crops, reflecting the sensitivity of net income per hm2 to natural factors, which also underscores the relatively unsophisticated agricultural production conditions in the study area.
Figure 3b shows affordable water prices measured by output per hm2. Since the output per hm2 includes production cost, affordable water prices were generally three to four times the prices indicated by the data in Figure 3a. Over time, the trend in affordable water prices of the three crops remained basically the same under the two calculation methods. The affordable water prices, from high to low, were for maize, soybean, and rice, due to a higher irrigation water quota for rice (8685 m3/hm2) than for maize and soybean (2385 m3/hm2). The upper affordability of water prices for maize crops was between 0.230 and 0.550 yuan/m3, but the time of the peak price was much later than in Figure 3a. This difference is a result of different calculation methods. The upper affordability of water prices for rice steadily increased at a rate of 1.2% per year from 0.110 to 0.221 yuan/m3 due to the relatively stable output of rice crops. The upper affordability of water prices for soybean crops slightly fluctuated between 0.206 and 0.343 yuan/m3, with 2014 still marking a turning point.
In brief, the overall trends in affordable agricultural water price remained basically the same according to the two calculation methods. However, due to the impact of inflation on the cost of production (such as increases in the cost of production materials), there was a delay in the time of peak affordable prices, which also shows that the analysis based on both net income and output per hm2 can fully and accurately reflect the variability of affordable agricultural water prices.
3.4. Determination of Agricultural Irrigation Water Price in 2012
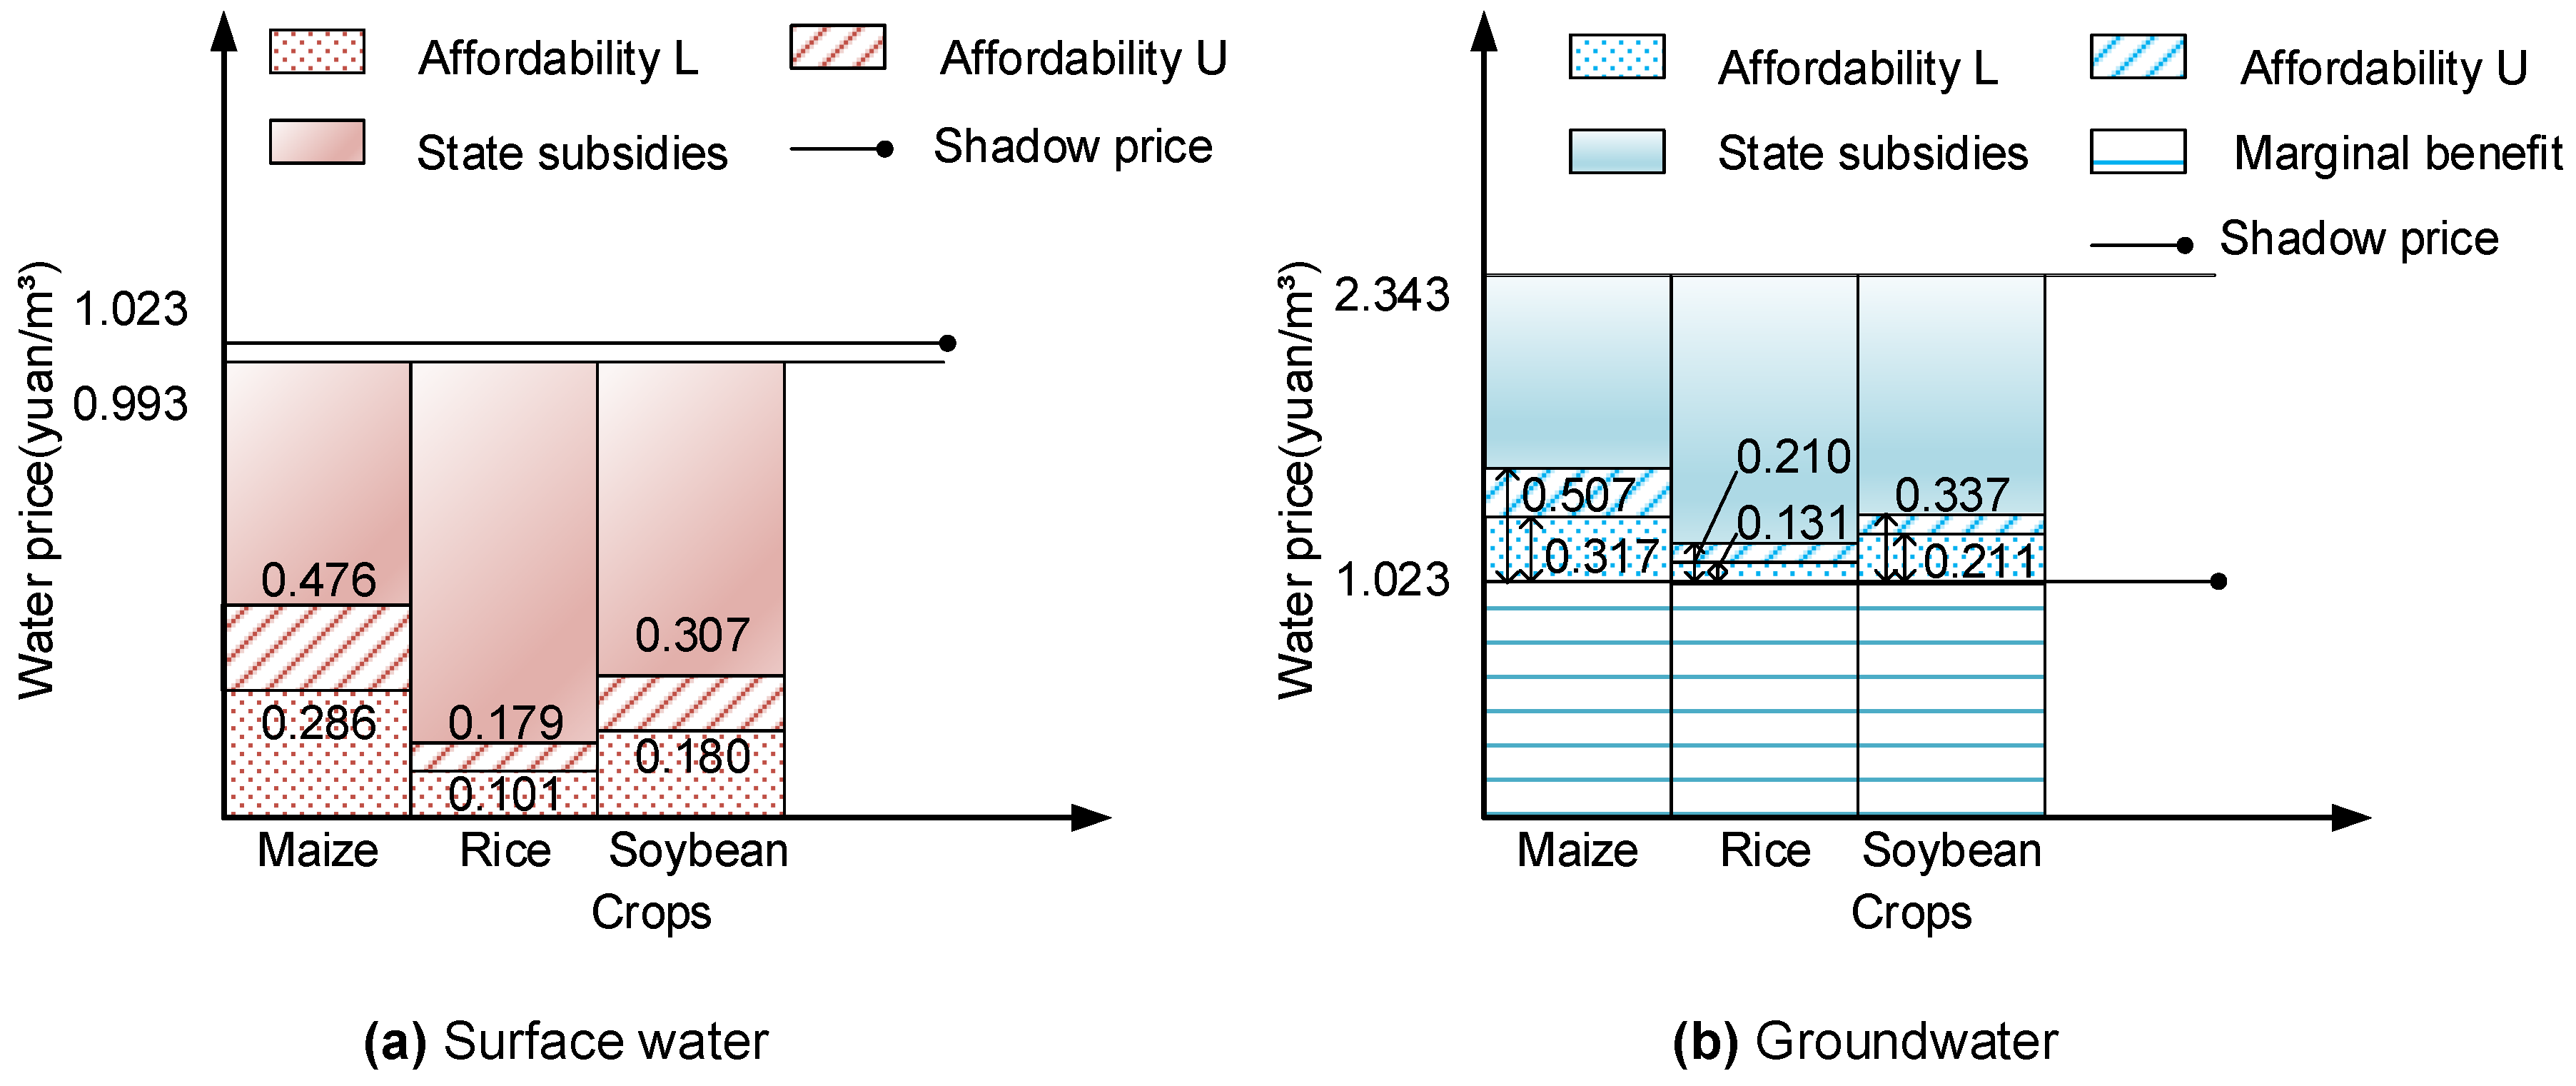
The irrigation water price for surface water and groundwater for agricultural production was determined based on a comparative analysis of the macro and micro prices of agricultural water resources combined with the affordable price using net income in 2012 for the study area (Figure 4). For the three main crops, maize, rice, and soybeans, the range of affordable water prices was from 0.317 to 0.507, from 0.131 to 0.210, and from 0.211 to 0.337 yuan/m3, respectively.
Figure 4a shows the agricultural irrigation water price for the use of surface water. We regarded the lower bound of the full-cost water price (0.993 yuan/m3) as the goal, since the current price is too low to recover costs. In 2012, agriculture had a marginal benefit of 1.023 yuan/m3; that is, the net benefit provided by adding one unit of agricultural water was 0.030 yuan. To encourage the use of surface water by peasants, the net benefit can be a reduction in water price. Therefore, the range of water prices for maize, rice, and soybeans should be from 0.286 to 0.476, from 0.101 to 0.179, and from 0.180 to 0.307 yuan/m3, respectively. In addition, despite the overcapacity of maize production, it is not appropriate to suppress production excessively given the demand for maize in industry and animal husbandry. Consequently, the government subsidy for agricultural irrigation water supply engineering could be set to approximately 0.517 yuan/m3, and the amount of subsidy can be adjusted according to market demand. Because rice is a high water-consuming crop, peasants growing rice should be encouraged to control the amount of water used and increase the efficiency of water use. Therefore, the government subsidy should be less than 0.814 yuan/m3. To reduce the dependence on imported soybeans, the government should encourage peasants to plant native soybeans, and the subsidy should be greater than 0.686 yuan/m3.
Figure 4b shows that the full-cost water price for using groundwater was more than twice the macro price. When using groundwater, the government would apply a larger subsidy if the lower bound of the full-cost water price (2.343 yuan/m3) was set as the goal. Considering a socioeconomic marginal benefit of 1.023 yuan/m3, to lighten the burden on farmers, we deducted the marginal benefit of the cost of groundwater, and the remainder was the underground water price shared by the government and peasants. Based on the basic conditions of the three major crops, when irrigating maize crops, the agricultural irrigation engineering could receive a government subsidy of approximately 0.813 yuan/m3, which is 57% higher than the subsidy for surface water. When irrigating rice crops, the government subsidy to agricultural irrigation engineering should be lower than 1.110 yuan/m3, which is 36% higher than the subsidy for surface water. When irrigating soybean crops, the agricultural irrigation engineering could receive a water price subsidy of 0.983 yuan/m3 or more, which is 43% higher than the subsidy for surface water. Both the peasants and the government have higher groundwater costs than surface water costs, so the use of surface water should be given priority, whereas groundwater should be used judiciously.
3.5. Limitation of the Study
The research proposes a valuation and pricing method of agricultural irrigation water based on macro and micro scales. This method has the goal of achieving the lower bound of the full-cost water price, considers the affordable price of water for peasants, and assumes the government will pay subsidies to agricultural irrigation engineering to ensure implementation, and this is consistent with the goal of agricultural water price reform in China. At the same time, we also consider the contribution of agricultural irrigation water to socioeconomics and reducing the water fee for some peasants. It can be said that this method takes full account of the benefit, cost, and affordability of agricultural irrigation water from three perspectives: society, water suppliers, and water users. However, due to the uncertainties of some parameters and variables in the data and models, the study has some limitations.
- (i)
- The existing input–output tables are compiled according to the provincial administrative regions, and because the marginal costs and benefits of water are expected to vary between river basins and for each section of each river basin, it is more meaningful to analyze the shadow price of agricultural irrigation water resources in each river basin. We intend to construct a basin input–output table according to the socioeconomic conditions in the area where the river flows, in order to estimate the macro-agricultural irrigation water price of each river basin.
- (ii)
- Changing crop prices will affect affordable agricultural irrigation water prices for peasants directly, and then will affect the regional economy and water consumption. We intend to estimate the influence of agricultural irrigation water price on the economy and water consumption according to the change of crop prices, and analyze the relationship between agricultural irrigation water price and agricultural water saving and socioeconomics, and finally to propose a pricing scheme of agricultural irrigation water price with the times.
4. Conclusions
This paper describes research on the progress of agricultural irrigation water pricing, with price determined at both the macro and micro scale. The range of affordable agricultural water prices was determined based on net income and output per hm2, and the prices of using surface water and groundwater were determined for the three main crops in 2012.
- (i)
- Comparative analysis of macro- and micro-agricultural irrigation water prices: The micro price of using surface water was similar to the macro price, while the micro price of using groundwater was more than double the macro price. When taking into account the cost recovery of water resources and their value, priority should be given to using surface water for agricultural production.
- (ii)
- Comparative analysis of current agricultural irrigation water price and macro- and micro-agricultural irrigation water prices: The current agricultural irrigation water price was much lower than the macro-agricultural irrigation water prices and far below the micro price. The current agricultural water price did not accurately reflect the water resource value and cost recovery, primarily because the role of value law in agricultural water resources has not been effectively implemented. Thus, the agricultural irrigation water price should be increased.
- (iii)
- Determination of agricultural irrigation water prices for peasants: Based on the macro- and micro-agricultural irrigation water prices, with the goal of achieving the lower bound of the full-cost water price, the irrigation water prices for access to surface water and groundwater for agricultural production were determined as well as the corresponding government subsidy policies. The ranges of surface water prices for maize, rice, and soybean crops were from 0.286 to 0.476, from 0.101 to 0.179, and from 0.180 to 0.307 yuan/m3 (from 0.045 to 0.075, from 0.016 to 0.028, from 0.029 to 0.049 $/m3), respectively. For groundwater, the ranges for maize, rice, and soybean crops were from 0.317 to 0.507, from 0.131 to 0.210, and from 0.211 to 0.337 yuan/m3 (from 0.050 to 0.080, from 0.021 to 0.033, from 0.033 to 0.053 $/m3), respectively (in 2012, 1 USD = 6.3125 CHY). The government could formulate different subsidy policies based on the actual conditions of these three crops. The research results can provide a reference for similar regions and countries for valuation and pricing of agricultural irrigation water.
Author Contributions
Y.R., K.C., and Q.F. decided the research direction; S.W. collected research trends at home and abroad and initial data; S.W. and K.C. analyzed the data and completed the first draft; Y.R., K.C., and Q.F. worked on improving and finalizing the manuscript; all authors wrote the paper.
Funding
This research was funded by the National Natural Science Foundation of China grant number. [51609039], the Natural Science Foundation of Heilongjiang Province grant number [E2017006], the China Postdoctoral Science Foundation grant number [2016M601410], the Heilongjiang Province Postdoctoral Science Foundation grant number [LBH-Z16025], the Key Laboratory of Efficient Use of Agricultural Water Resources, Ministry of Agriculture, P.R. China grant number [2017008].
Conflicts of Interest
The authors declare no conflict of interest.
References
- Shen, X.; Lin, B. The shadow prices and demand elasticities of agricultural water in China: A StoNED-based analysis. Resour. Conserv. Recycl. 2017, 127, 21–28. [Google Scholar] [CrossRef]
- Xian, W.; Xu, Z.; Deng, X. Agricultural irrigation water price based on full cost recovery: A case study in Ganzhou District of Zhangye Municipality. J. Glaciol. Geocryol. 2014, 36, 462–468. (In Chinese) [Google Scholar]
- Motta, R.S.D.; Ortiz, R.A. Costs and Perceptions Conditioning Willingness to Accept Payments for Ecosystem Services in a Brazilian Case. Ecol. Econ. 2018, 147, 333–342. [Google Scholar] [CrossRef]
- Jiang, W.L.; Yu, L.S.; Liu, R.H.; Han, G.G.; Wang, H.D. Study on the price upper limit of water resources. China Water Wastewater 1993, 2, 58–59. (In Chinese) [Google Scholar]
- Gan, H.; Qin, C.H.; Wang, L.; Zhang, X.J. Study on water pricing method and practice I. Discussion on the connotation of water resources value. J. Hydraul. Eng. 2012, 39, 289–295. (In Chinese) [Google Scholar]
- Hermans, L.M.; Halsema, G.E.V.; Mahoo, H.F. Building a mosaic of values to support local water resources management. Water Policy 2008, 8, 415–434. [Google Scholar] [CrossRef]
- Lv, C.M.; Wu, Z.N.; Hu, C.H. Progress and prospect on theory research of water resource value. Resour. Environ. Yangtze Basin 2009, 18, 545–549. (In Chinese) [Google Scholar]
- Cai, C.; Huang, T.; Li, X.; Li, Y. Application of Fuzzy Maths in Urban Water Resources Value: A Case Study of Water Resources Value in ChengDu Region. Adv. Mater. Res. 2012, 361–363, 1571–1575. [Google Scholar] [CrossRef]
- Olmstead, S.M.; Stavins, R.N. Managing Water Demand Price vs. Non-Price Conservation Programs; Pioneer Institute for Public Policy Research: Boston, MA, USA, 2007. [Google Scholar]
- Lika, A.; Galioto, F.; Viaggi, D. Water Authorities’ Pricing Strategies to Recover Supply Costs in the Absence of Water Metering for Irrigated Agriculture. Sustainability 2017, 9, 2210. [Google Scholar] [CrossRef]
- Bar-Shira, Z.; Finkelshtain, I.; Simhon, A. Block-Rate versus Uniform Water Pricing in Agriculture: An Empirical Analysis. Am. J. Agric. Econ. 2010, 88, 986–999. [Google Scholar] [CrossRef]
- Singh, K. Rational Pricing of Water as an Instrument of Improving Water Use Efficiency in the Agricultural Sector: A Case Study in Gujarat, India. Int. J. Water Resour. Dev. 2007, 23, 679–690. [Google Scholar] [CrossRef]
- Esmaeili, A.; Vazirzadeh, S. Water pricing for agricultural production in the south of Iran. Water Resour. Manag. 2009, 23, 957–964. [Google Scholar] [CrossRef]
- Ohadi, N.; Nejad, J.K. Economic pricing of water in pistachio production of Sirjan. Int. J. Agric. Manag. 2014, 4, 247–252. [Google Scholar]
- Zafeiriou, E. Optimisation of water pricing in the Greek agricultural sector. Int. J. Green Econ. 2013, 7, 348–357. [Google Scholar] [CrossRef]
- Zafeiriou, E.; Sofios, S.; Koutroumanidis, T. Water management and economic growth: A macroeconomic model. J. Environ. Prot. Ecol. 2011, 12, 1563–1574. [Google Scholar]
- State Council. Notice on Adjustment of Water Supply Charging Standards for Agriculture and Other Water Supply from Water Conservancy Projects in Heilongjiang Province. Available online: http://new.luobei.gov.cn/system/201607/102082.html (accessed on 1 August 2018).
- Water Price in Heilongjiang Province. Available online: http://price.h2o-china.com/heilongjiangsheng_546.shtml (accessed on 1 August 2018).
- Raa, T.T. Input–Output Economics: Theory and Applications; Social Science Electronic Publishing: Rochester, NY, USA, 2009; Volume 19, p. 568. [Google Scholar]
- European Commission (EC). Directive 2000/60/EC of the European parliament and of the council. Off. J. Eur. Communities 2000, L327, 12–13. [Google Scholar]
- Anderson, K.M.; Gaines, L.J. International water pricing: An overview and historic and modern case studies. In Managing and Transforming Water Conflicts; Cambridge University Press: New York, NY, USA, 2009; pp. 249–265. [Google Scholar]
- Kampas, A.; Petsakos, A.; Rozakis, S. Price induced irrigation water saving: Unraveling conflicts and synergies between European agricultural and water policies for a Greek Water District. Agric. Syst. 2012, 113, 28–38. [Google Scholar] [CrossRef]
- Organisation for Economic Co-operation and Development (OECD). Improving Water Management: Recent OECD Experience (Complete Edition). In Sourceoecd Development; IWA Publishing: London, UK, 2003; ISBN 9264099484. [Google Scholar]
- Wang, H.; Ruan, B.Q.; Shen, D.J. Water Price Theories and Practice Facing to Sustainable Development; Science Press: Beijing, China, 2003; ISBN 7-03-011465-5. (In Chinese) [Google Scholar]
- Shen, D.; Wu, J. State of the Art Review: Water pricing reform in China. Int. J. Water Resour. Dev. 2017, 33, 198–232. [Google Scholar] [CrossRef]
- Odum, H.T. Environmental accounting: EMERGY and environmental decision making. Child Dev. 1996, 42, 1187–1201. [Google Scholar]
- Tan, C.; Lv, J. Scenario Prediction for Emergy of Heilongjiang Eco-economic System. For. Econ. 2012, 4, 39–42. (In Chinese) [Google Scholar]
- Jiang, Q.X.; Zhu, C.H.; Fu, Q.; Wang, Z.L.; Zhao, K. A study on green gdp of heilongjiang province based on cost accounting of water resources value. Water Saving Irrig. 2015, 11, 80–84. (In Chinese) [Google Scholar]
- Qin, C.H.; Gan, H.; Zhang, X.J.; Jia, L. Study on water pricing method and practice II. Discussion on water price of the Haihe Basin. J. Hydraul. Eng. 2012, 43, 429–436. (In Chinese) [Google Scholar]
- Cheng, K.; Fu, Q.; Li, T.; Jiang, Q.; Liu, W. Regional food security risk assessment under the coordinated development of water resources. Nat. Hazards 2015, 78, 603–619. [Google Scholar] [CrossRef]
Figure 1.
Regional map of the study area.

Figure 2.
Shadow price of agricultural irrigation water.

Figure 3.
Ranges of affordable water prices for the three main crops between 2007 and 2016: (a) 10–13% of net income per hm2, and (b) 5–8% of output per hm2.
Figure 3.
Ranges of affordable water prices for the three main crops between 2007 and 2016: (a) 10–13% of net income per hm2, and (b) 5–8% of output per hm2.

Figure 4.
Agricultural irrigation water price composition and subsidies in 2012. U and L indicate the upper and lower bound, respectively, of the range of affordable prices.
Figure 4.
Agricultural irrigation water price composition and subsidies in 2012. U and L indicate the upper and lower bound, respectively, of the range of affordable prices.


Table 1.
Water resource input–output table of Heilongjiang Province in 2012 (in 108 yuan).
| Output | Intermediate Demand | Final Demand | Import | Total Output | |||||||||||
|---|---|---|---|---|---|---|---|---|---|---|---|---|---|---|---|
| Input | 1 | 2 | 3 | 4 | 5 | 6 | 7 | 8 | 9 | 10 | Total | ||||
| Intermediate input | 1 Agriculture | 387.2 | 1.1 | 1611.5 | 15.5 | 0.1 | 0.1 | 7.0 | 88.6 | 0.1 | 0.0 | 2111.3 | 2861.4 | 1020.3 | 3952.3 |
| 2 Mining | 7.3 | 261.5 | 41.6 | 1051.2 | 200.2 | 362.6 | 88.1 | 4.9 | 12.3 | 18.0 | 2047.7 | 2736.1 | 1368.2 | 3415.6 | |
| 3 Light industry | 599.2 | 14.5 | 649.6 | 51.3 | 18.6 | 2.4 | 23.9 | 181.7 | 21.4 | 118.6 | 1681.3 | 4344.2 | 1713.7 | 4311.8 | |
| 4 Petrifaction | 455.0 | 163.0 | 162.7 | 727.5 | 159.6 | 108.8 | 97.8 | 175.9 | 303.0 | 297.6 | 2651.1 | 1374.8 | 1205.3 | 2820.6 | |
| 5 Manufacturing | 58.1 | 162.2 | 63.7 | 33.8 | 1239.8 | 130.4 | 1415.4 | 84.9 | 116.7 | 96.5 | 3401.4 | 4048.7 | 4555.6 | 2894.4 | |
| 6 Power | 30.0 | 97.4 | 83.5 | 50.3 | 101.8 | 208.1 | 26.6 | 163.1 | 55.0 | 62.2 | 878.0 | 388.8 | 8.5 | 1258.4 | |
| 7 Architecture | 5.3 | 1.7 | 3.8 | 2.5 | 4.2 | 1.0 | 138.1 | 59.9 | 5.8 | 17.0 | 239.3 | 5030.4 | 2339.7 | 2930.0 | |
| 8 Business | 208.0 | 149.5 | 317.6 | 160.0 | 207.7 | 56.5 | 183.6 | 713.2 | 253.6 | 213.1 | 2463.0 | 2360.3 | 275.4 | 4547.8 | |
| 9 Traffic posts | 80.5 | 103.7 | 190.3 | 78.2 | 149.9 | 33.4 | 135.5 | 134.3 | 304.7 | 88.3 | 1298.7 | 719.4 | 76.6 | 1941.6 | |
| 10 Services | 8.1 | 54.4 | 37.5 | 20.1 | 48.2 | 24.2 | 17.1 | 67.5 | 48.6 | 107.8 | 433.4 | 3522.9 | 1090.7 | 2865.6 | |
| Total | 1838.6 | 1009.0 | 3161.6 | 2190.4 | 2130.2 | 927.5 | 2133.0 | 1674.3 | 1121.2 | 1019.2 | 17,205.0 | 27,386.9 | 13,653.8 | 30,938.1 | |
| (108 m3) | 294.9 | 2.1 | 1.2 | 1.1 | 1.4 | 9.8 | 10.5 | 4.1 | 1.9 | 4.3 | 331.2 | ||||
| Added value | Remuneration | 1884.8 | 343.0 | 217.3 | 163.7 | 269.4 | 167.9 | 379.2 | 525.3 | 275.4 | 1192.0 | 5417.9 | |||
| Net product tax | −157.7 | 696.2 | 435.3 | 183.2 | 169.8 | 67.2 | 185.7 | 452.4 | 45.2 | 30.0 | 2107.3 | ||||
| Depreciation | 84.6 | 280.5 | 117.9 | 78.1 | 138.2 | 89.8 | 63.1 | 359.6 | 147.2 | 190.1 | 1549.1 | ||||
| Surplus () | 302.0 | 1086.9 | 379.7 | 205.2 | 186.8 | 6.2 | 169.0 | 1536.3 | 352.5 | 434.3 | 4658.8 | ||||
| Total () | 2113.7 | 2406.6 | 1150.2 | 630.2 | 764.2 | 330.9 | 797.0 | 2873.6 | 820.4 | 1846.4 | 13,733.1 | ||||
| Total input () | 3952.3 | 3415.6 | 4311.8 | 2820.6 | 2894.4 | 1258.4 | 2930.0 | 4547.8 | 1941.6 | 2865.6 | 30,938.1 | ||||
Economic data are from the China Region Input–Output Table 2012 for Heilongjiang Province, pages 94–105; water consumption for each sector is from China Statistical Yearbook 2012, Second Heilongjiang Economic Census Yearbook, and Second China Economic Census Yearbook.
Table 2.
Initial data for micro-agricultural irrigation water pricing. GDP, gross domestic product.
| Category | Name | Symbol | Unit | Value |
|---|---|---|---|---|
| Resource cost | Gibbs free energy | J/g | 4.94 | |
| Density of water | g/cm3 | 1 | ||
| Rainfall solar transformity | sej/J | 1.82 × 10⁴ | ||
| Ratio of emergy to GDP | sej/yuan | 0.43 × 10¹² | ||
| Total amount of rainfall | 1011 m3 | 3.2 | ||
| Total amount of surface water | 108 m3 | 695.7 | ||
| Total amount of groundwater | 108 m3 | 289.8 | ||
| Project cost | Depreciation year | year | 50 | |
| Mean effective irrigation area of state farms | 104 hm2 | 154.6 | ||
| Irrigation water quota | 104 m3/hm2 | 0.78 | ||
| Fixed assets investment | 108 yuan | 37.7 | ||
| Employee work reward | 108 yuan | 1.4 | ||
| Environmental cost | Average amount of agricultural irrigation water consumption | 108 m3 | 252.7 | |
| Current agricultural water price | yuan/m3 | 0.02–0.05 | ||
| Amount of water in water quality class k | 108 m3 | 0; 121.8; 282.5; 184.4; 18.1; 89.1 | ||
| Ecological function loss rate of different water quality | % | 0; 0.5; 24; 50; 76; 99 | ||
| Engel’s coefficient for rural areas | % | 37.9 | ||
| Amount of water demand | 108 m3 | 358.9 | ||
| Amount of water supply | 108 m3 | 358.9 | ||
| Rainfall in quarter | – | 108 m3 | 288.9; 1519.5; 771.4; 70.4 | |
| Annual rainfall | – | 108 m3 | 2650.24 |
© 2018 by the authors. Licensee MDPI, Basel, Switzerland. This article is an open access article distributed under the terms and conditions of the Creative Commons Attribution (CC BY) license (http://creativecommons.org/licenses/by/4.0/).
Share and Cite
MDPI and ACS Style
Ren, Y.; Wei, S.; Cheng, K.; Fu, Q. Valuation and Pricing of Agricultural Irrigation Water Based on Macro and Micro Scales. Water 2018, 10, 1044. https://doi.org/10.3390/w10081044
AMA Style
Ren Y, Wei S, Cheng K, Fu Q. Valuation and Pricing of Agricultural Irrigation Water Based on Macro and Micro Scales. Water. 2018; 10(8):1044. https://doi.org/10.3390/w10081044
Chicago/Turabian StyleRen, Yongtai, Shuai Wei, Kun Cheng, and Qiang Fu. 2018. "Valuation and Pricing of Agricultural Irrigation Water Based on Macro and Micro Scales" Water 10, no. 8: 1044. https://doi.org/10.3390/w10081044
Note that from the first issue of 2016, this journal uses article numbers instead of page numbers. See further details here.