Drought Analysis in Europe and in the Mediterranean Basin Using the Standardized Precipitation Index


1
National Research Council of Italy, Institute for Agricultural and Forest Systems in Mediterranean (CNR-ISAFOM), 87036 Rende, Italy
2
Independent Researcher, 87027 Paola, Italy
3
Independent Researcher, 87036 Rende, Italy
4
National Research Council of Italy, Institute of Neurological Sciences (CNR-ISN), 88021 Roccelletta di Borgia, Italy
*
Author to whom correspondence should be addressed.
Water 2018, 10(8), 1043; https://doi.org/10.3390/w10081043
Submission received: 11 June 2018
/
Revised: 30 July 2018
/
Accepted: 6 August 2018
/
Published: 7 August 2018
(This article belongs to the Section Hydrology)
Abstract
:In this study, drought events over a large area of the Northern Hemisphere, including continental Europe, Ireland, the United Kingdom, and the Mediterranean basin, were analyzed using the Standardized Precipitation Index (SPI) at various times scales (3, 6, 12, and 24 months). To this purpose, the Global Precipitation Climatology Centre (GPCC) Full Data Monthly Product Version 2018 data set, with spatial resolutions of 0.5° longitude/latitude and for the period 1951–2016, has been used. First, the temporal evolution of the percentage of grid points, falling within the severe and extreme drought categories, has been evaluated. Then, a trend analysis has been performed at a seasonal scale, considering the autumn-winter and the spring-summer periods, and at an annual scale. The results of this paper highlight that the Mediterranean basin and North Africa are the most consistently vulnerable areas showing a general reduction in SPI values especially for the long time scale.
1. Introduction
Climate change is undoubtedly one of the greatest environmental challenges of our times. Since the beginning of the 20th century, the highest concentration of anthropogenic greenhouse gases since the pre-industrial era and an increase in mean global temperatures of about 0.9 °C have been detected [1]. As a consequence, anthropic systems and terrestrial ecosystems are becoming more vulnerable to environmental phenomena and an increase in floods, heat waves, forest fires, and droughts can be expected [2,3]. In particular, the Intergovernmental Panel on Climate Change (IPCC) warned about the possible intensification of droughts in this century, especially in some areas such as the Mediterranean basin [1]. Within this context, in recent years and in several areas of the world, drought events have been widely described and analyzed. For example, in Asia, the spatiotemporal drought variability has been studied by Fang et al. [4] and by Hua et al. [5]. Regional drought events have been analyzed in South [6] and North America [7]. Stagge et al. [8] and Lloyd-Hughes and Saunders [9] analyzed some of the major large-scale droughts in Central and Eastern Europe. Drought studies at a national scale have also been performed in Central Europe [10,11] and in some Mediterranean countries [12,13,14].
Drought indices are a useful tool for monitoring and assessing the different kinds of drought (meteorological, agricultural, and hydrological drought) since they facilitate communication of climate anomalies to diverse user audiences. Numerous indices, based on different variables, have been developed to identify and quantify drought events. These include, for example, the Palmer Drought Severity Index (PDSI) [15], the Reconnaissance Drought Index (RDI) [16], the Standardized Precipitation Index (SPI) [17,18], the Standardized Precipitation Evapotranspiration Index (SPEI) [19], the Surface Water Supply Index (SWSI) [20], the Streamflow Drought Index (SDI) [21], the Rainfall Anomaly Index (RAI) [22], and the Standardized Runoff Index (SRI) [23]. The SPI is the most applied index to analyze meteorological drought defined as temporary lower-than-average precipitation which results in diminished water resources availability and carrying capacity of the ecosystems, impacting on economic activities, human lives, and the environment [24,25]. This can be considered one of the most robust and effective drought indices, as it can be evaluated for different time scales and allows the analysis of different drought categories [26]. Moreover, the SPI is based on precipitation alone, and is thus easier to calculate than more complex indices; furthermore, it allows the comparison between different drought conditions in different time periods and regions [27,28]. Guttman [29] and Hayes et al. [30] compared the SPI with the PDSI and concluded that the SPI has statistical consistency advantages, and can describe both short-term and long-term drought impacts through different time scales of precipitation anomalies. Besides, due to its intrinsic probabilistic nature, the SPI is the ideal candidate for carrying out drought risk analysis [31,32]. With this aim, the SPI has been extensively applied in different countries of the world. For example, in Australia the SPI has been found to correlate well with fluctuations in shallow ground water table in irrigation areas [33]. In Zimbabwe, an increase of severe and extreme droughts has been detected in the last years of the past century [34]. In Iran, Golian et al. [35] showed that the northern, the northwestern, and the central parts of Iran have experienced significant drying trends. Similar results have been obtained in China, in particular in the Yangtze basin [36] and in the Gansu Province [37]. In New Zealand, in every area currently subject to drought, an increase in this phenomenon can be expected [38,39]. In Europe, the area covered by dry events increased during the last 50 years of the past century [40] but different results in drought frequency, duration, and severity are expected following the projections of drought trends until the end of the 21st century [41,42]. Finally, in the Mediterranean basin, and in particular in Greece [43], in Turkey [44], and in southern Italy [45,46,47,48,49], an increase in drought frequency has been evidenced.
As the latest IPCC report [1] has shown, there is medium confidence that droughts will intensify in the 21st century in some seasons and areas, including southern Europe and the Mediterranean region due to reduced precipitation or increased evapotranspiration, or both. However, none of the previously cited papers provides a complete analysis of the meteorological drought both in Europe and the Mediterranean basin. Although drought should be studied within a large area, because of its large-scale character, the majority of the cited studies refer to regional or national analyses, providing only local results without any spatial connection with the others. Given this research context, this study is an attempt to explore the spatial coherence of drought on a large area of the Northern Hemisphere, which has never been investigated simultaneously in order to address the gaps in our understanding identified in the previous works. In particular, there is a need for an examination of large-scale spatial coherence of meteorological drought, in all seasons, to enable improved assessments of large-scale drought propagation. Compared to the works already existing on drought, in this paper some important novelties have been introduced. Firstly, the analysis is based on one of the newest gridded databases (latest release in 2018) with monthly rainfall data evaluated for a large area of the Northern Hemisphere in the period 1951–2016. Secondly, meteorological drought has been evaluated using the SPI at different time scales (3, 6, 12, and 24 months) in order to consider not simply the effect of drought on plant life and farming but also on the management of water supplies.
2. Methodology
In this work, dry periods were evaluated using the SPI at different time scales (3, 6, 12, and 24 months). While the 3- and 6-month SPI describe droughts that affect plant life and farming, the 12- and 24-month SPI influence the way water supplies and reserves are managed [50,51]. Angelidis et al. [52] offered a meticulous description of the method to compute the SPI.
In order to calculate the index, for each time scale, an appropriate probability density function (PDF) must be fitted to the frequency distribution of the cumulated precipitation. In particular, a gamma function is considered. The shape and the scale parameters must be estimated for each month of the year and for each time aggregation, for example by using the approximation of Thom [53].
Since the gamma distribution is undefined for a rainfall amount x = 0, in order to take into account the zero values that occur in a sample set, a modified cumulative distribution function (CDF) must be considered:
with G(x) the CDF, q the probability of zero precipitation, given by the ratio between the number of zero in the rainfall series (m) and the number of observations (n).
Finally, the CDF is changed into the standard normal distribution by using the approximate conversion provided by Abramowitz and Stegun [54]:
with c0 = 2.515517, c1 = 0.802853, c2 = 0.010328, d1 = 1.432788, d2 = 0.189269, and d3 = 0.001308 mathematical constants.
Table 1 reports the climatic classification according to the SPI, provided by the National Drought Mitigation Center [55]. This index is now habitually used in the classification of wet periods, even though the original classification provided by McKee et al. [17] was limited to drought periods only.
3. Study Area and Data
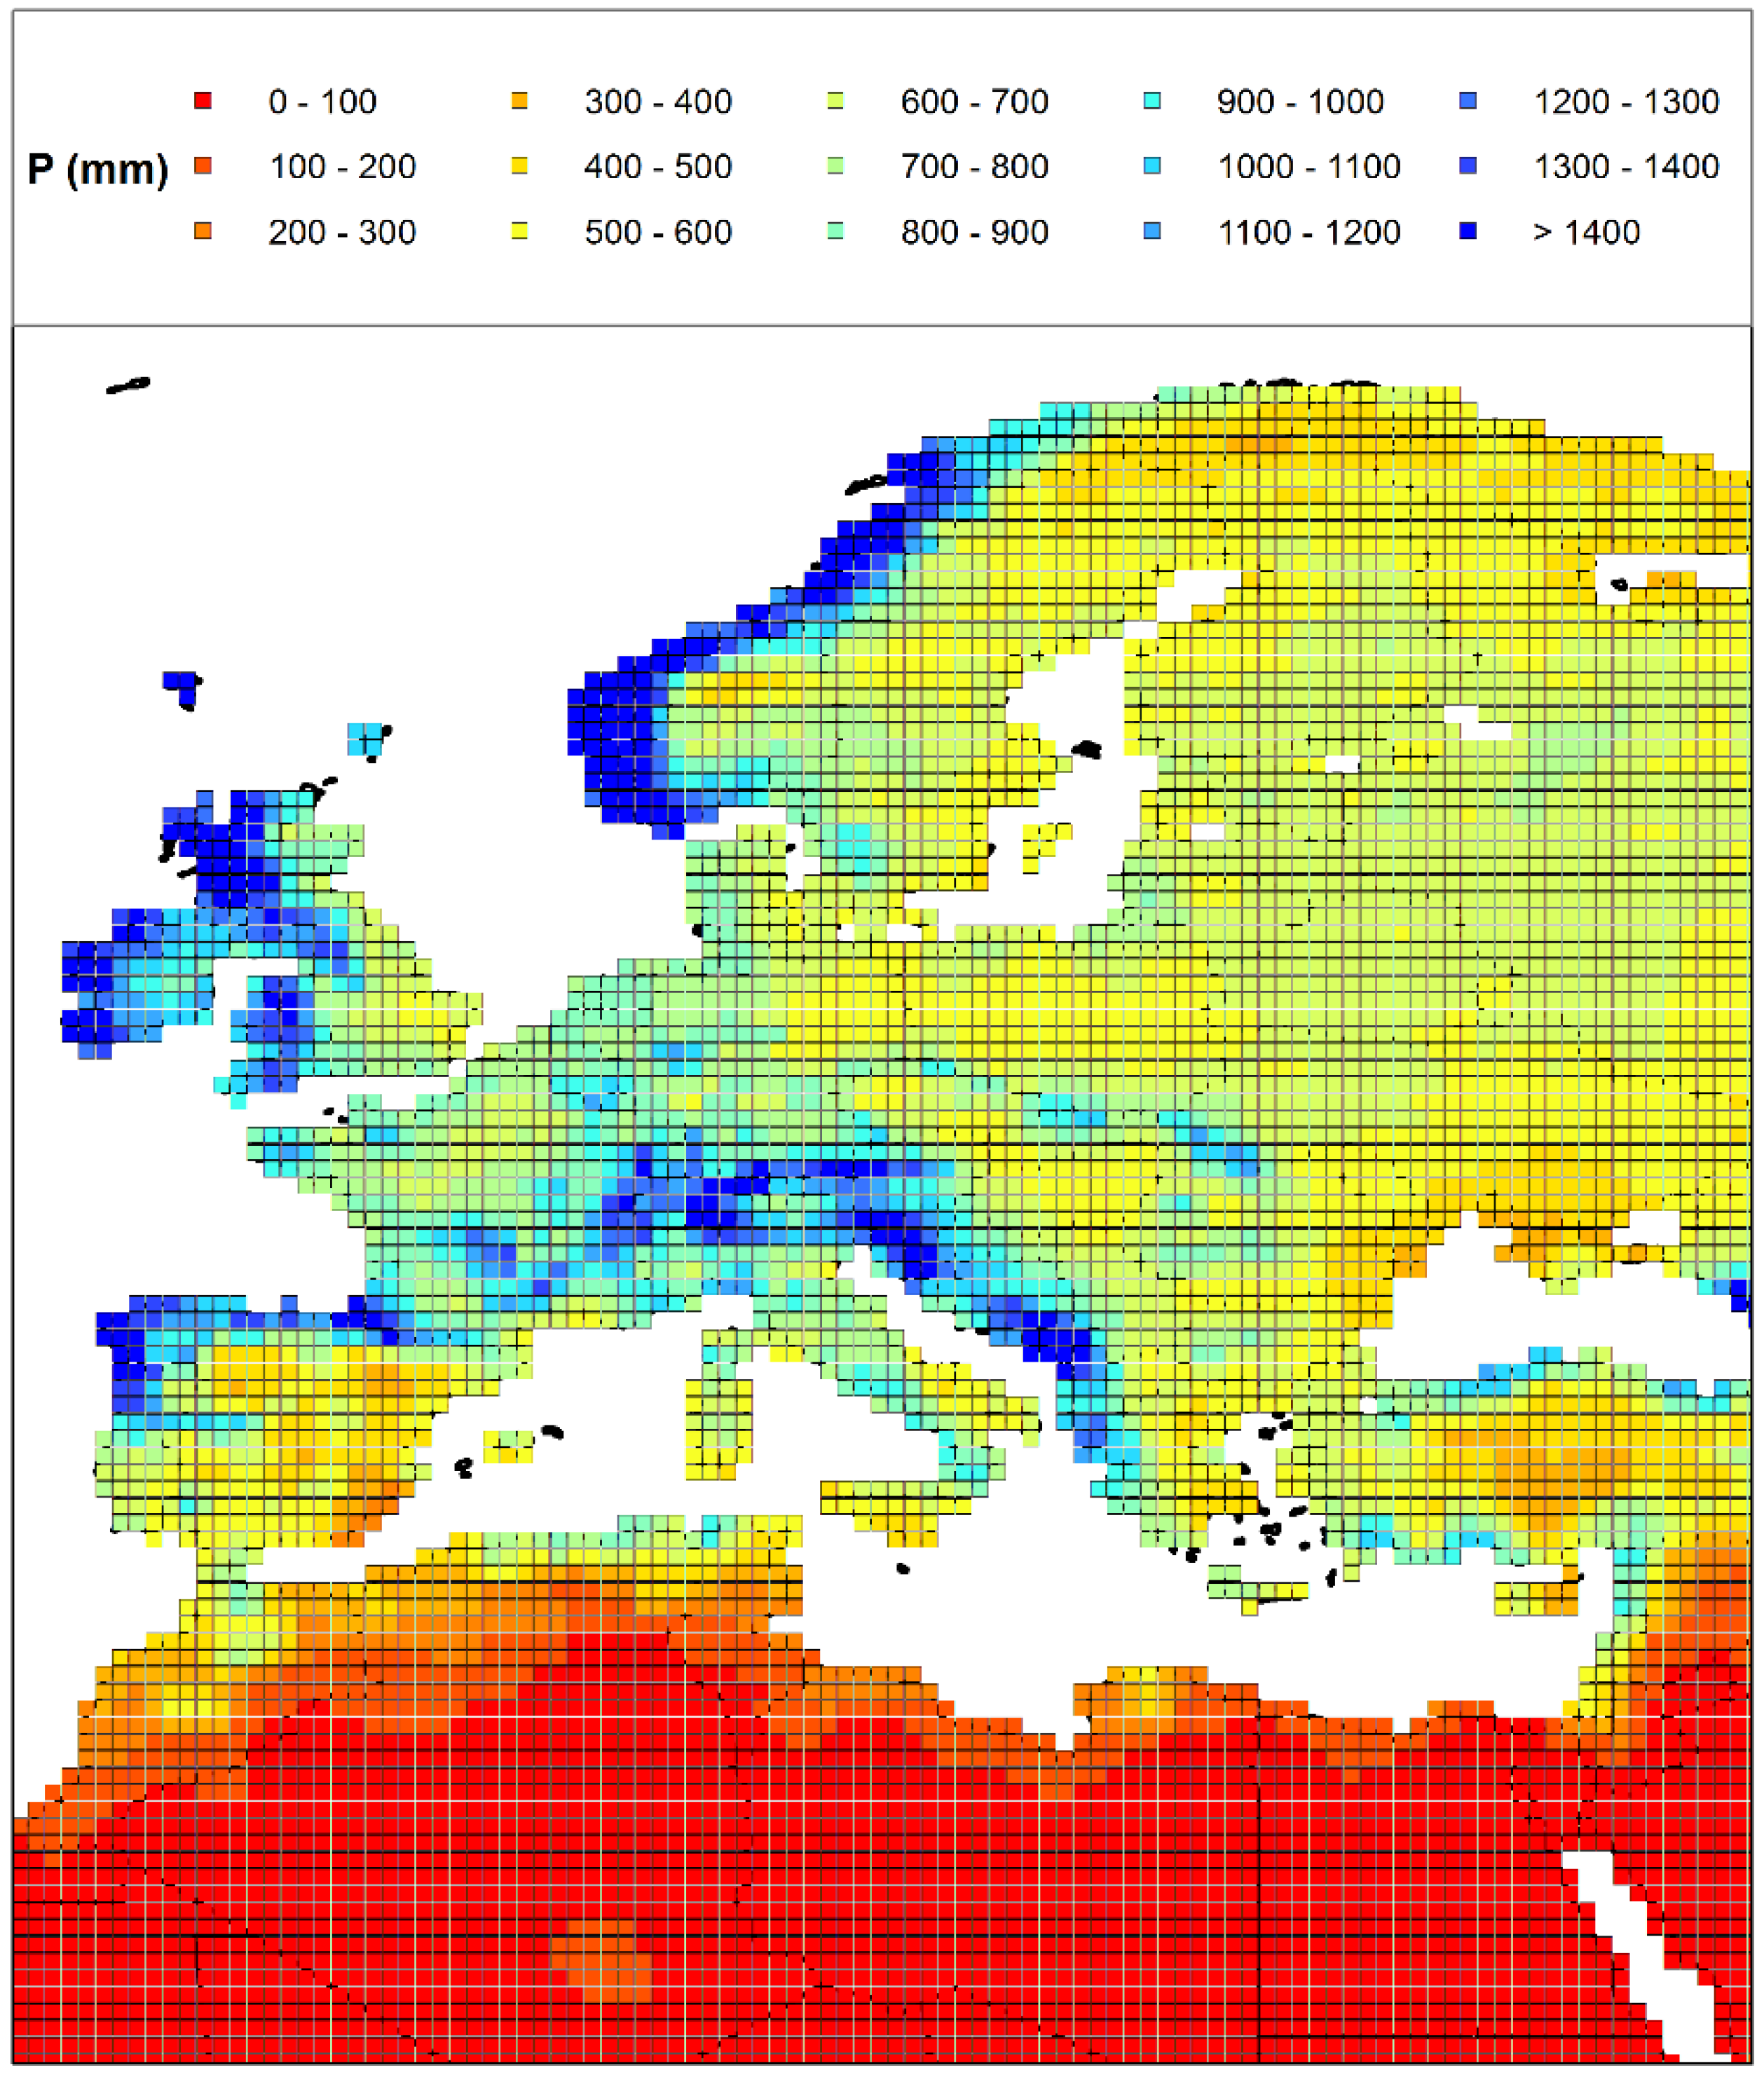
The study area (21.25 ÷ 70.75° N and −11.75° W ÷ 39.25° E) includes Continental Europe, Ireland, the United Kingdom, and the Mediterranean basin reaching portions of three continents; Europe, Asia, and Africa (Figure 1). Climate is very variable within this area. In Eastern Europe, the rainy season occurs in early summer and the dry season occurs in winter, in Western Europe, the rainy season is in the early winter and the dry season is in spring, while in the Mediterranean basin climate is characterized by warm to hot, dry summers and mild to cool, wet winters.
The SPI has been evaluated for the period 1951–2016 using a globally gridded precipitation data set: the GPCC Full Data Monthly Product Version 2018 data set [58]. It is based on data that were observed in situ from rain gauge networks of more than 65,000 stations, originating from several sources. In fact, historical data sets from the Food and Agriculture Organization of the UN (FAO), the Climate Research Unit (CRU), the Global Historical Climatology Network (GHCN), and data obtained directly from national meteorological and hydrological services, and regional research projects have been used. Although the high number of stations used, it should be noted, however, that the station density is very irregular, being very high over Germany and France and rather low in areas such as the Sahara Desert [59]. The database contains monthly precipitation data at 0.5° resolution (excluding Antarctica) starting from the beginning of the past century; however, due to the low number of rain gauges used for the creation of the gridded database, in this work data before 1950s were not considered. Several papers thoroughly used and explained the GPCC data set [60,61,62].
4. Results and Discussion
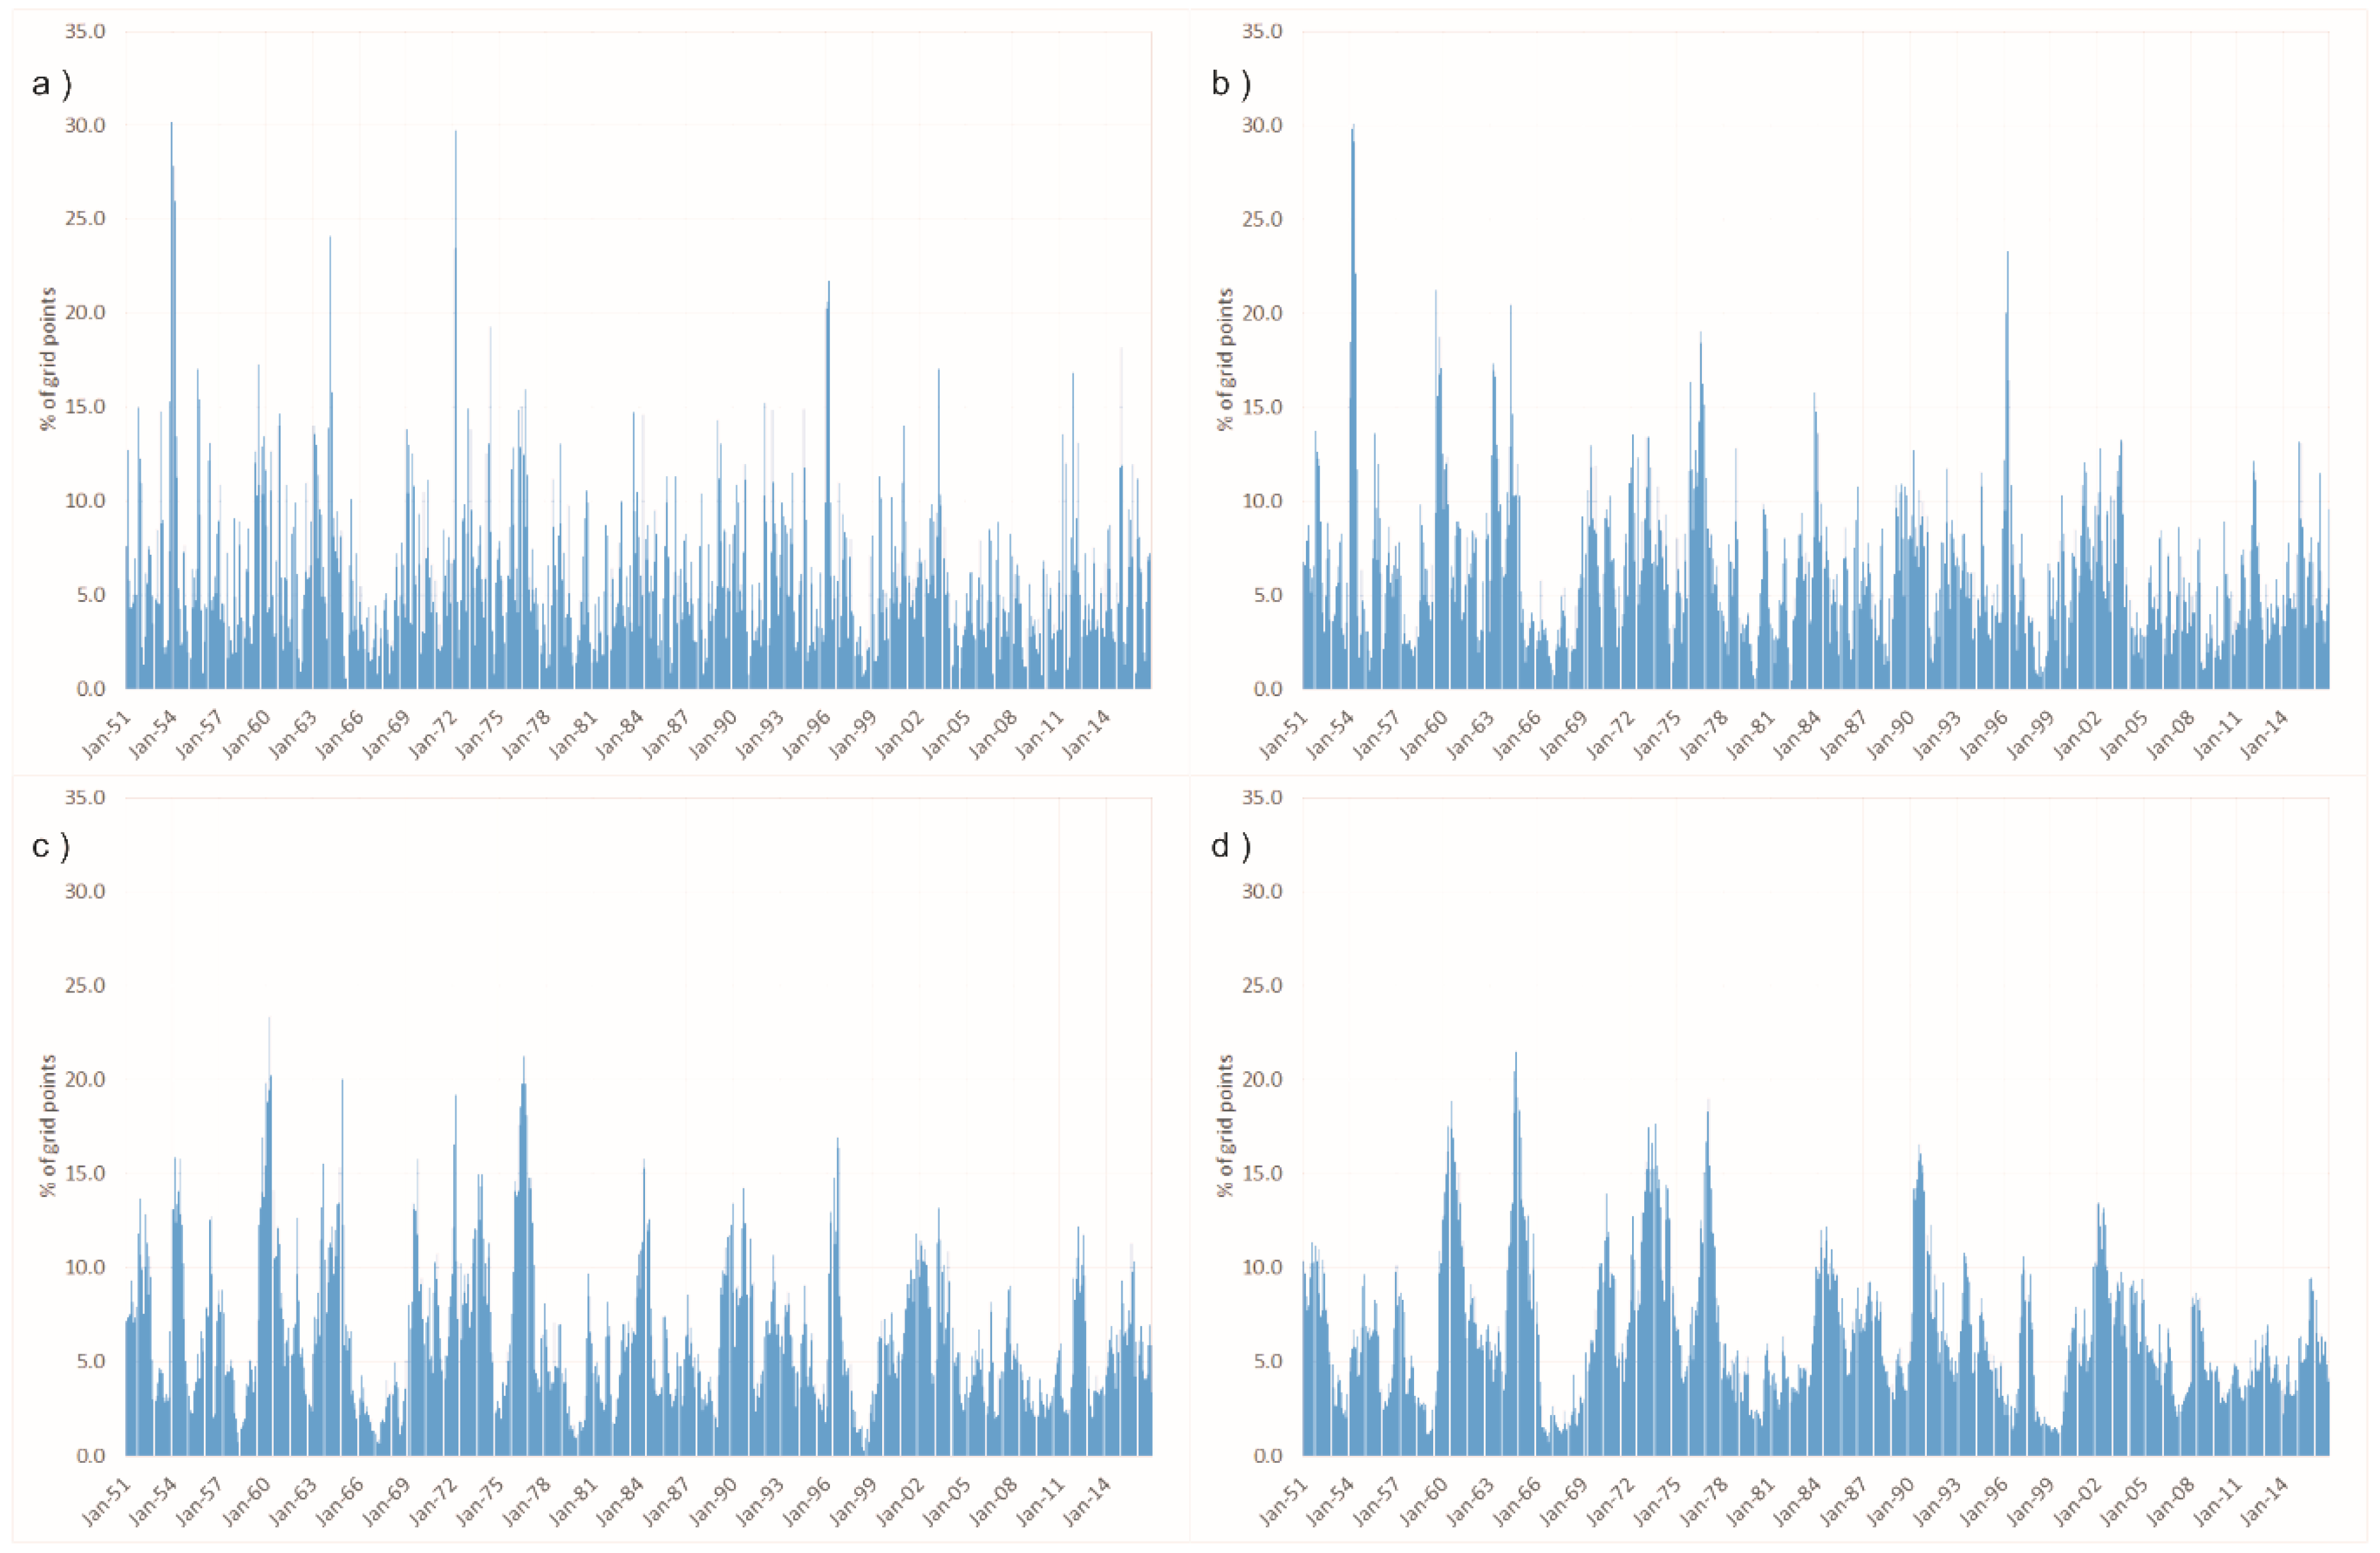
Figure 2 shows the temporal distribution, for the period 1951–2016, of the percentage of grid points which fell within severe or extreme dry conditions (SPI < −1.5) and allows researchers to immediately detect the worst dry events. As a result, for the short-time scale (3- and the 6-month SPI) the twentieth century has been characterized by numerous dry periods. The first and most diffused drought event took place between November 1953 and May 1954 with more than 30% of the grid points showing severe or extreme dry conditions. This event involved most of the countries of Europe. Within the 3- and 6-month intervals, another significant occurrence dates back to summer-autumn 1959, with more than 17% (3 month) and 19% (6 month) of the grid points presenting drought conditions, especially in North, Central, and Eastern Europe. Dry conditions for both the 3- and the 6-month SPI were also present in the years 1964 (in North, Central, and Eastern Europe), 1976 (in Central Europe and UK), and 1996 (in North and Central Europe) with 15% plus grid points affected by severe or extreme drought. In the twenty-first century, the most diffused drought events (more than 15% of the grid points) have been detected in 2003 (in Central and Eastern Europe and in the Mediterranean basin) and 2011 (in UK, Central Europe, and in the Mediterranean basin) only for the 3-month SPI. Regarding the 12- and 24-month SPI, the most diffused events of the past century occurred before 1990. In fact, after the 1990s, only between summer and autumn 1990 drought involved about 15% of the grid points, especially in Southern Europe and in the Mediterranean. On the contrary, before the 1990s, various drought episodes were registered, such as the prolonged drought event detected between 1959 and 1960 (in North, Central, and Eastern Europe) with more than 23% and about 19% of the grid points showing drought conditions, respectively, for the 12-month and the 24-month timescales. Remarkable events have been also observed in 1964, (in North, Central, and Eastern Europe) and between 1976 and 1977 (in Central Europe and UK) even though with a different behavior. In fact, while the first is the most diffuse event for the 24-month SPI (21.5% of the grid point), the second event was particularly relevant for the 12-month SPI (21.2% of the grid points). Another diffuse drought event, involving more than 15% of the grid points, was detected in 1973 (in most of the countries of Europe). In the twenty-first century, the worst drought events have been detected between October 2001 and August 2002 (in Southern and Eastern Europe and in the Mediterranean basin) with about 12% and 13.5% of the grid points showing drought conditions, respectively, for the 12-month and the 24-month timescales.
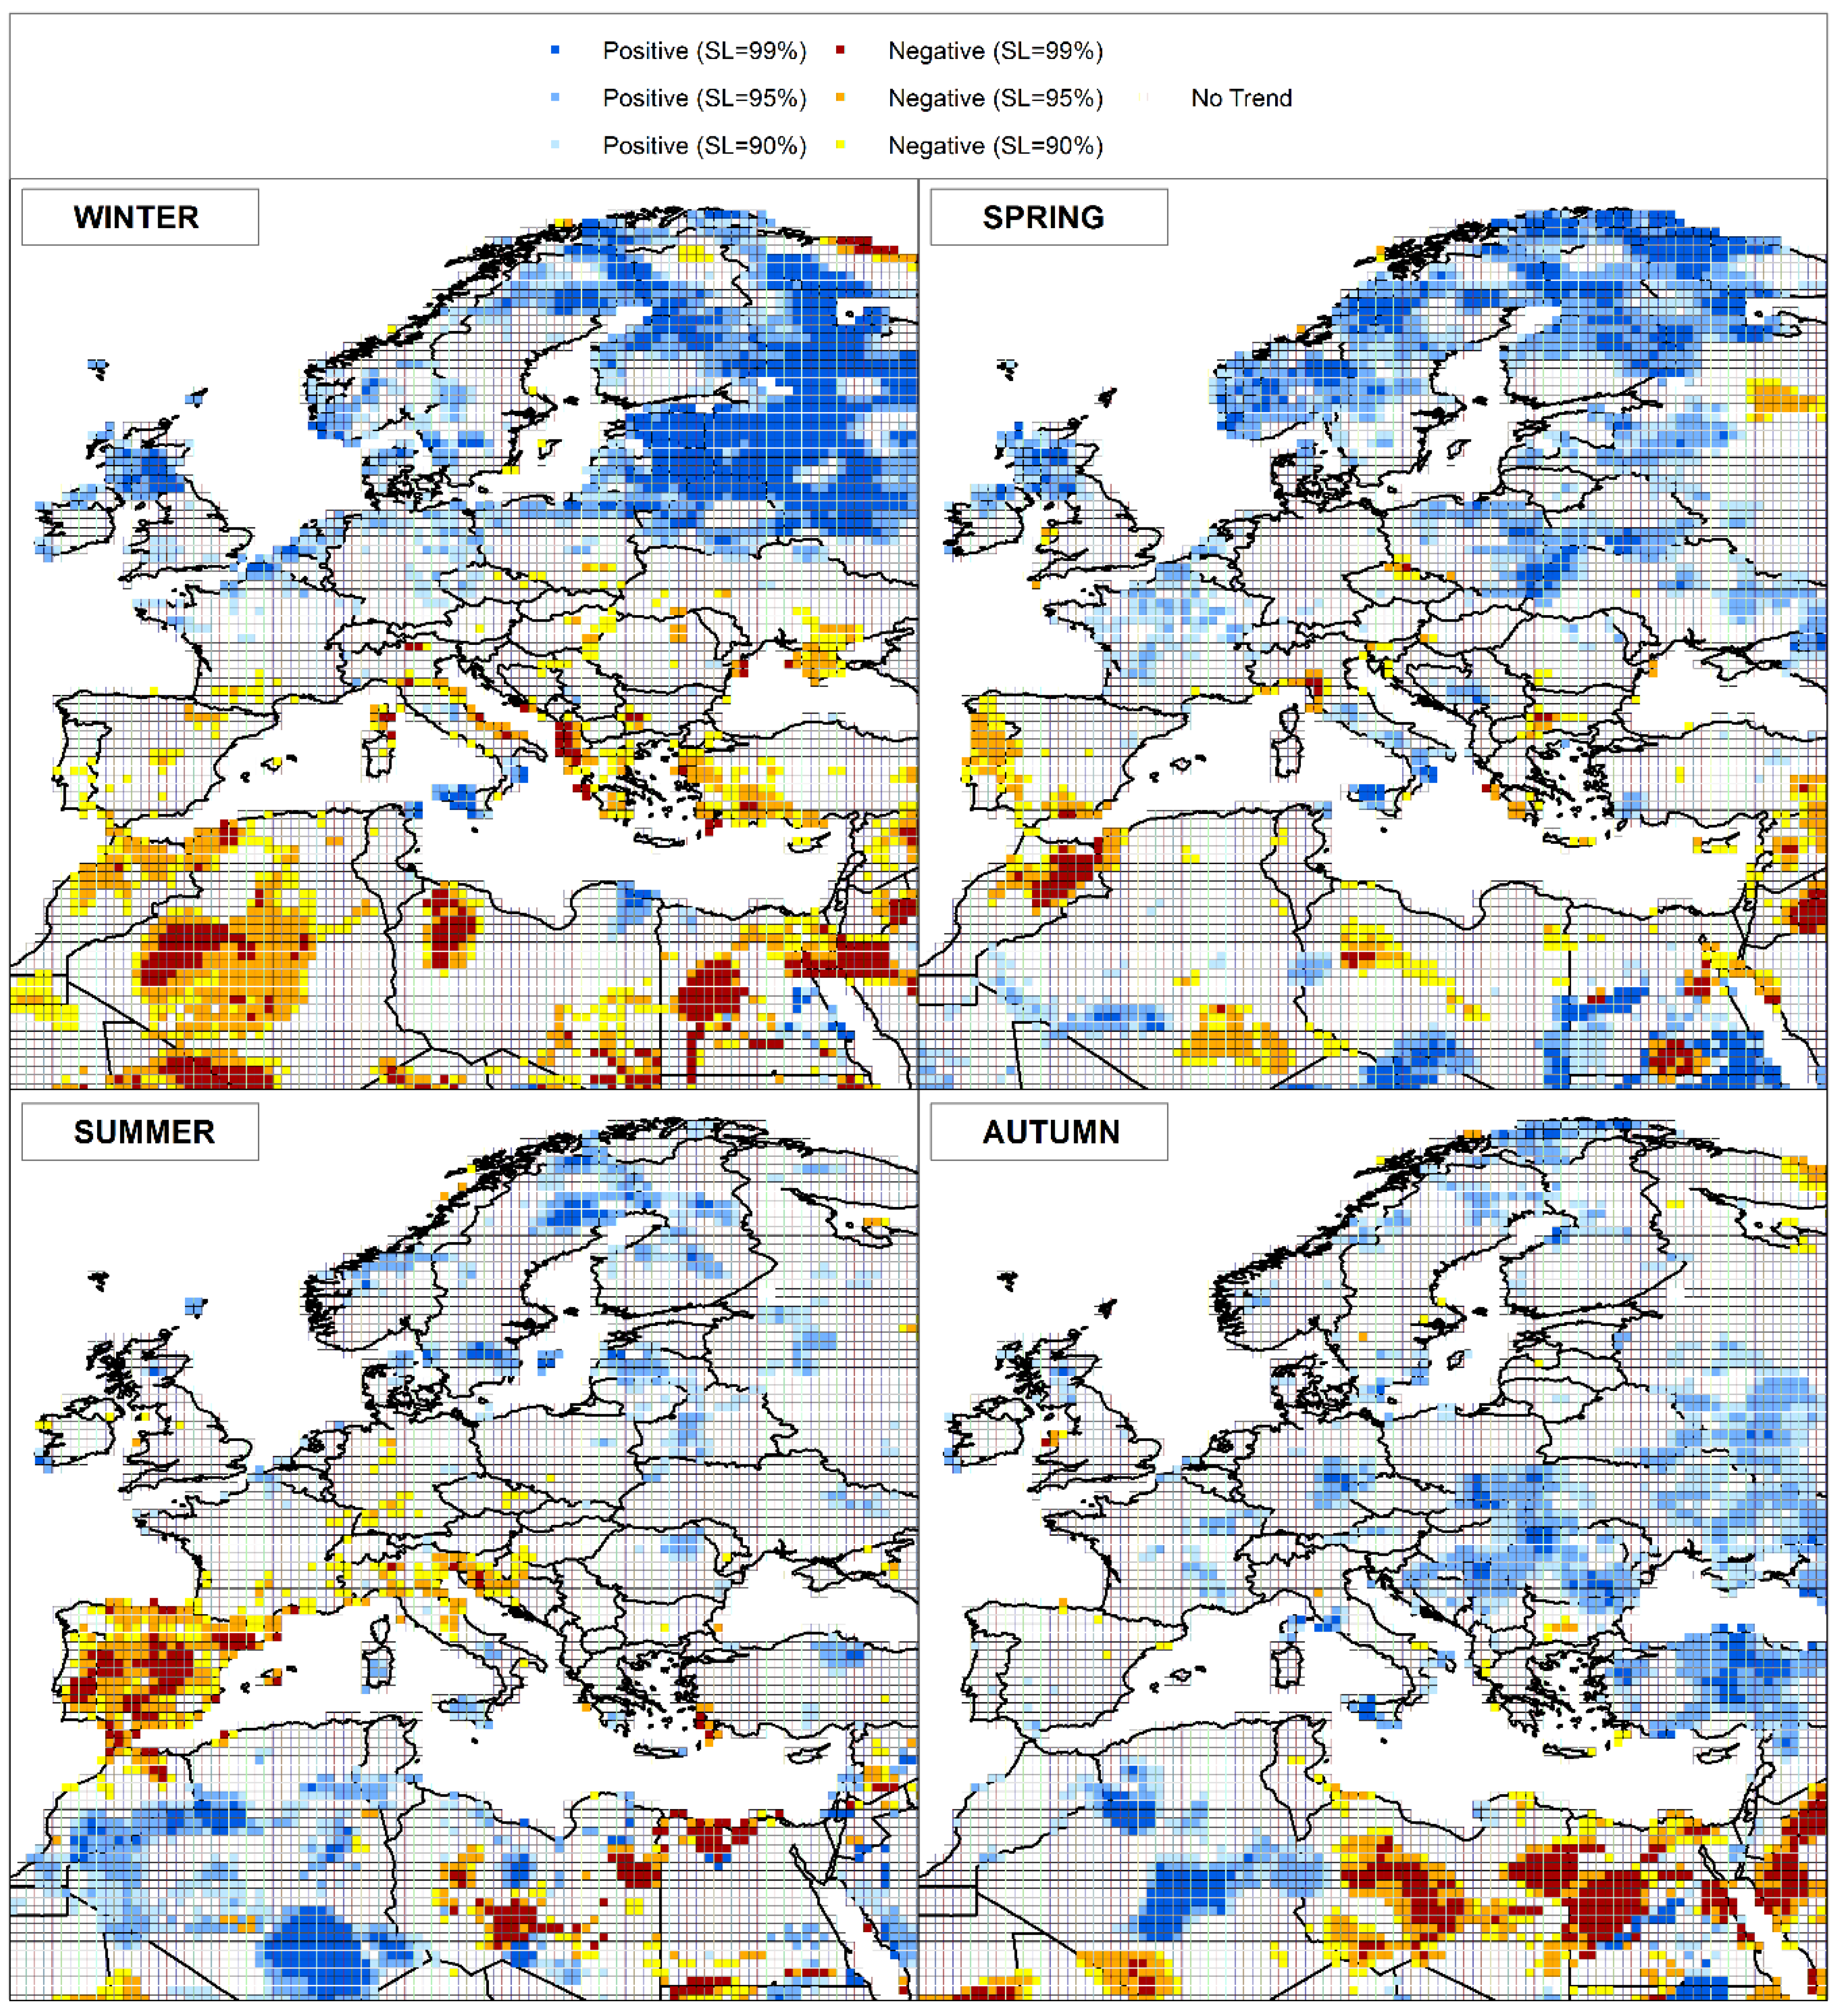
In order to detect drought temporal evolution in the period 1951–2016, the SPI grid point series were tested for trends through the Mann–Kendall test. In particular, trend analysis has been initially conducted at a seasonal scale, considering the 3-month SPI values in February for winter, in May for spring, in August for summer, and in November for autumn (Figure 3). Very different results have been obtained among the seasons and between Continental Europe and the Mediterranean basin. Specifically, in winter, a marked positive trend (Significant Level SL = 99%) has been detected in the north-eastern side of the study area, and in particular in Scotland, Belarus, Russia, Scandinavian countries, and Baltic republics, while a clear negative trend (SL = 99%) has been mainly evidenced in the Mediterranean basin and, in particular, in the Adriatic regions of Italy, Greece, Turkey, Egypt, Libya, Algeria, and in the eastern side of the study area.
Less marked trends (SL = 95%) have been also identified in France, Germany, southern Italy, Libya, and Tunisia (positive values), and in Morocco, Spain, France, Bulgaria, Romania, and Ukraine (negative values). In the other seasons, this marked difference in the SPI trend between Continental Europe and Mediterranean basin has not been detected, and only few areas showed positive or negative trends with a SL = 99%. Indeed, a positive SPI trend (SL = 99%) has been identified in the Scandinavian countries, Poland, Belarus, Ukraine, Scotland, and Ireland in spring. Conversely, Bulgaria, Egypt, Morocco, Italy, Libya, and Spain for a SL = 99% and Greece, Algeria, and Portugal for a SL = 95% showed negative trend values. In summer, very few significant trends (SL ≥ 95%) have been detected, mainly involving Northern Europe and western North Africa for the positive values, and eastern North Africa and especially Spain for the negative ones. Finally, in autumn, a clear spatial difference has emerged with positive SPI trend values (SL ≥ 95%) detected in almost all the European continent and the western North Africa, and negative values (SL = 99%) identified in the south-eastern sector of the study area.
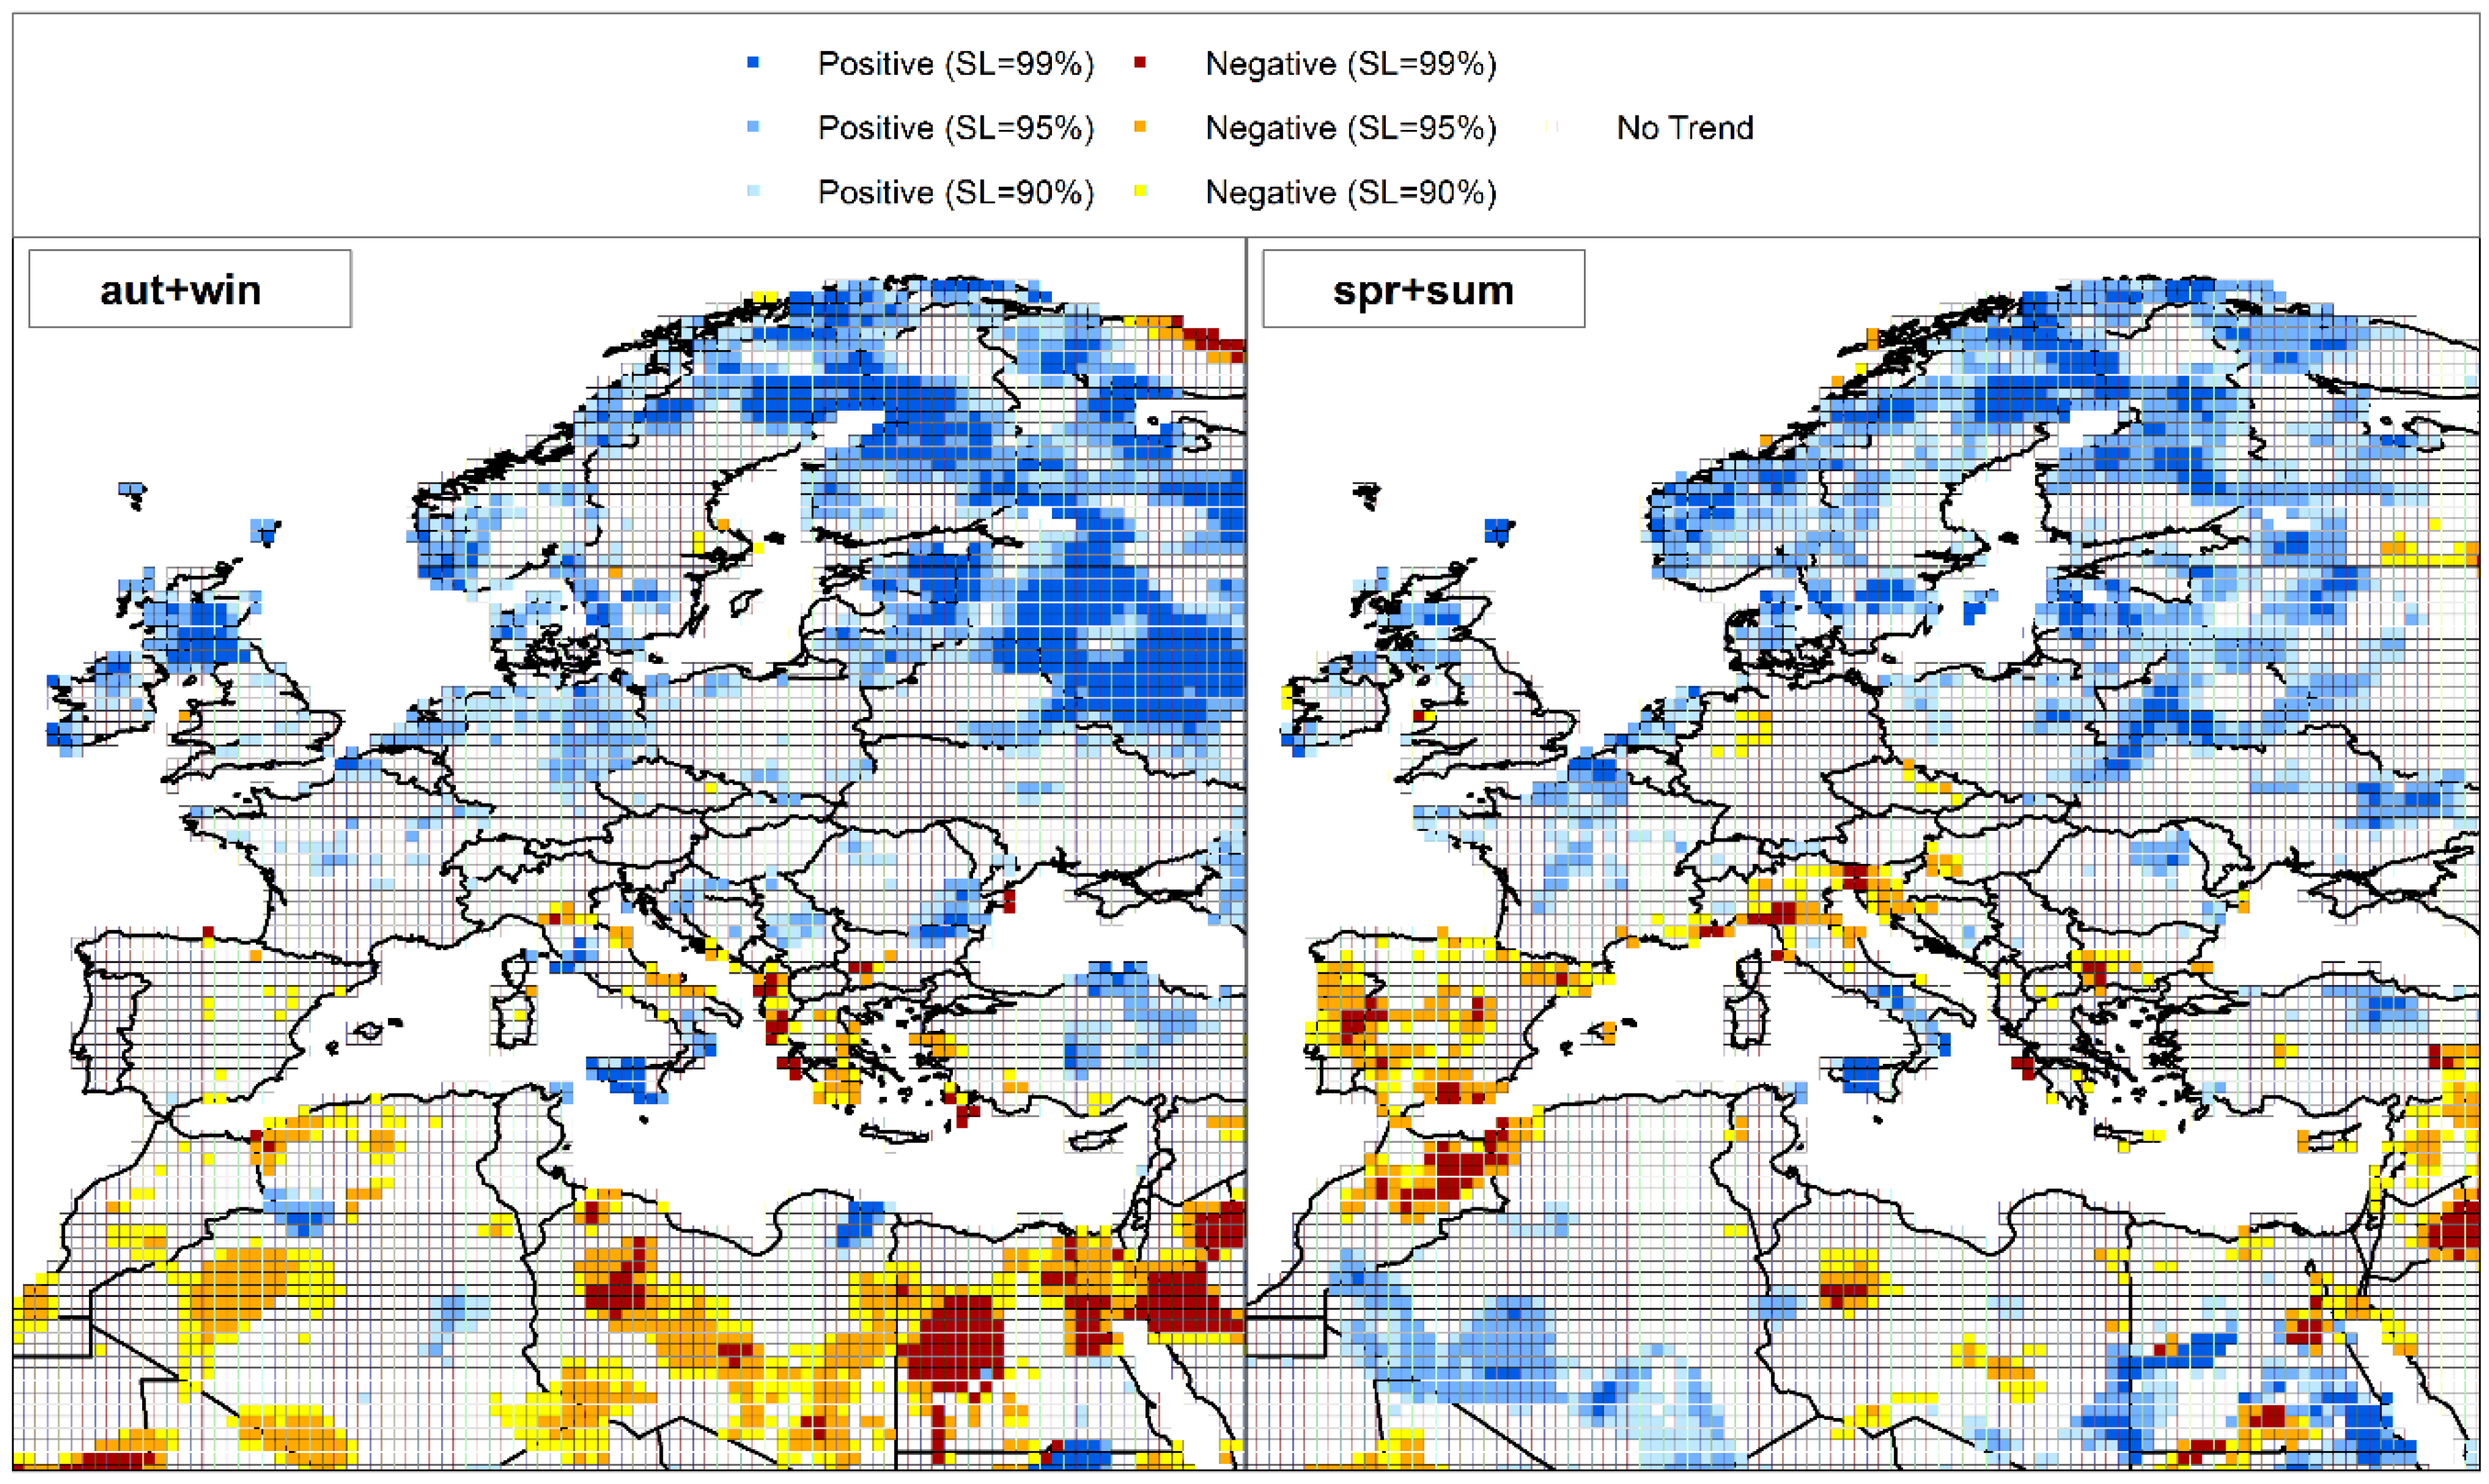
As previously pointed out, climate is very variable within the study area. For this reason, in order to take into account the dry and the wet seasons in the various regions, two 6-month periods have been considered. In particular, the 6-month SPI series evaluated in February (autumn-winter period) and August (spring-summer period) have been analyzed for trends through the Mann–Kendall test (Figure 4). Results clearly showed that in the Mediterranean basin, where the autumn-winter period is generally the rainy period, a negative trend has been detected in Greece, Turkey, Albania, Bulgaria, Italy, Egypt, Libya, and Algeria for a SL = 99%, and in Croatia, Spain, and Morocco for a SL = 90%. On the contrary, similarly to the results of the winter SPI, northern Europe showed marked positive trends (SL = 99%) in Scotland, Belarus, Russia, Scandinavian countries, and Baltic republics. A positive trend has also been detected in Sicily. According to the results obtained for the 3-month SPI in spring and summer, the 6-month SPI trend in the spring-summer period evidenced a positive SPI trend (SL = 99%) in almost every country in central and eastern Europe, but limited to few grid points. Conversely, some areas of Bulgaria, Greece, Italy, Libya, Egypt, Morocco, Spain, and Portugal showed negative trend values with a SL = 99%.
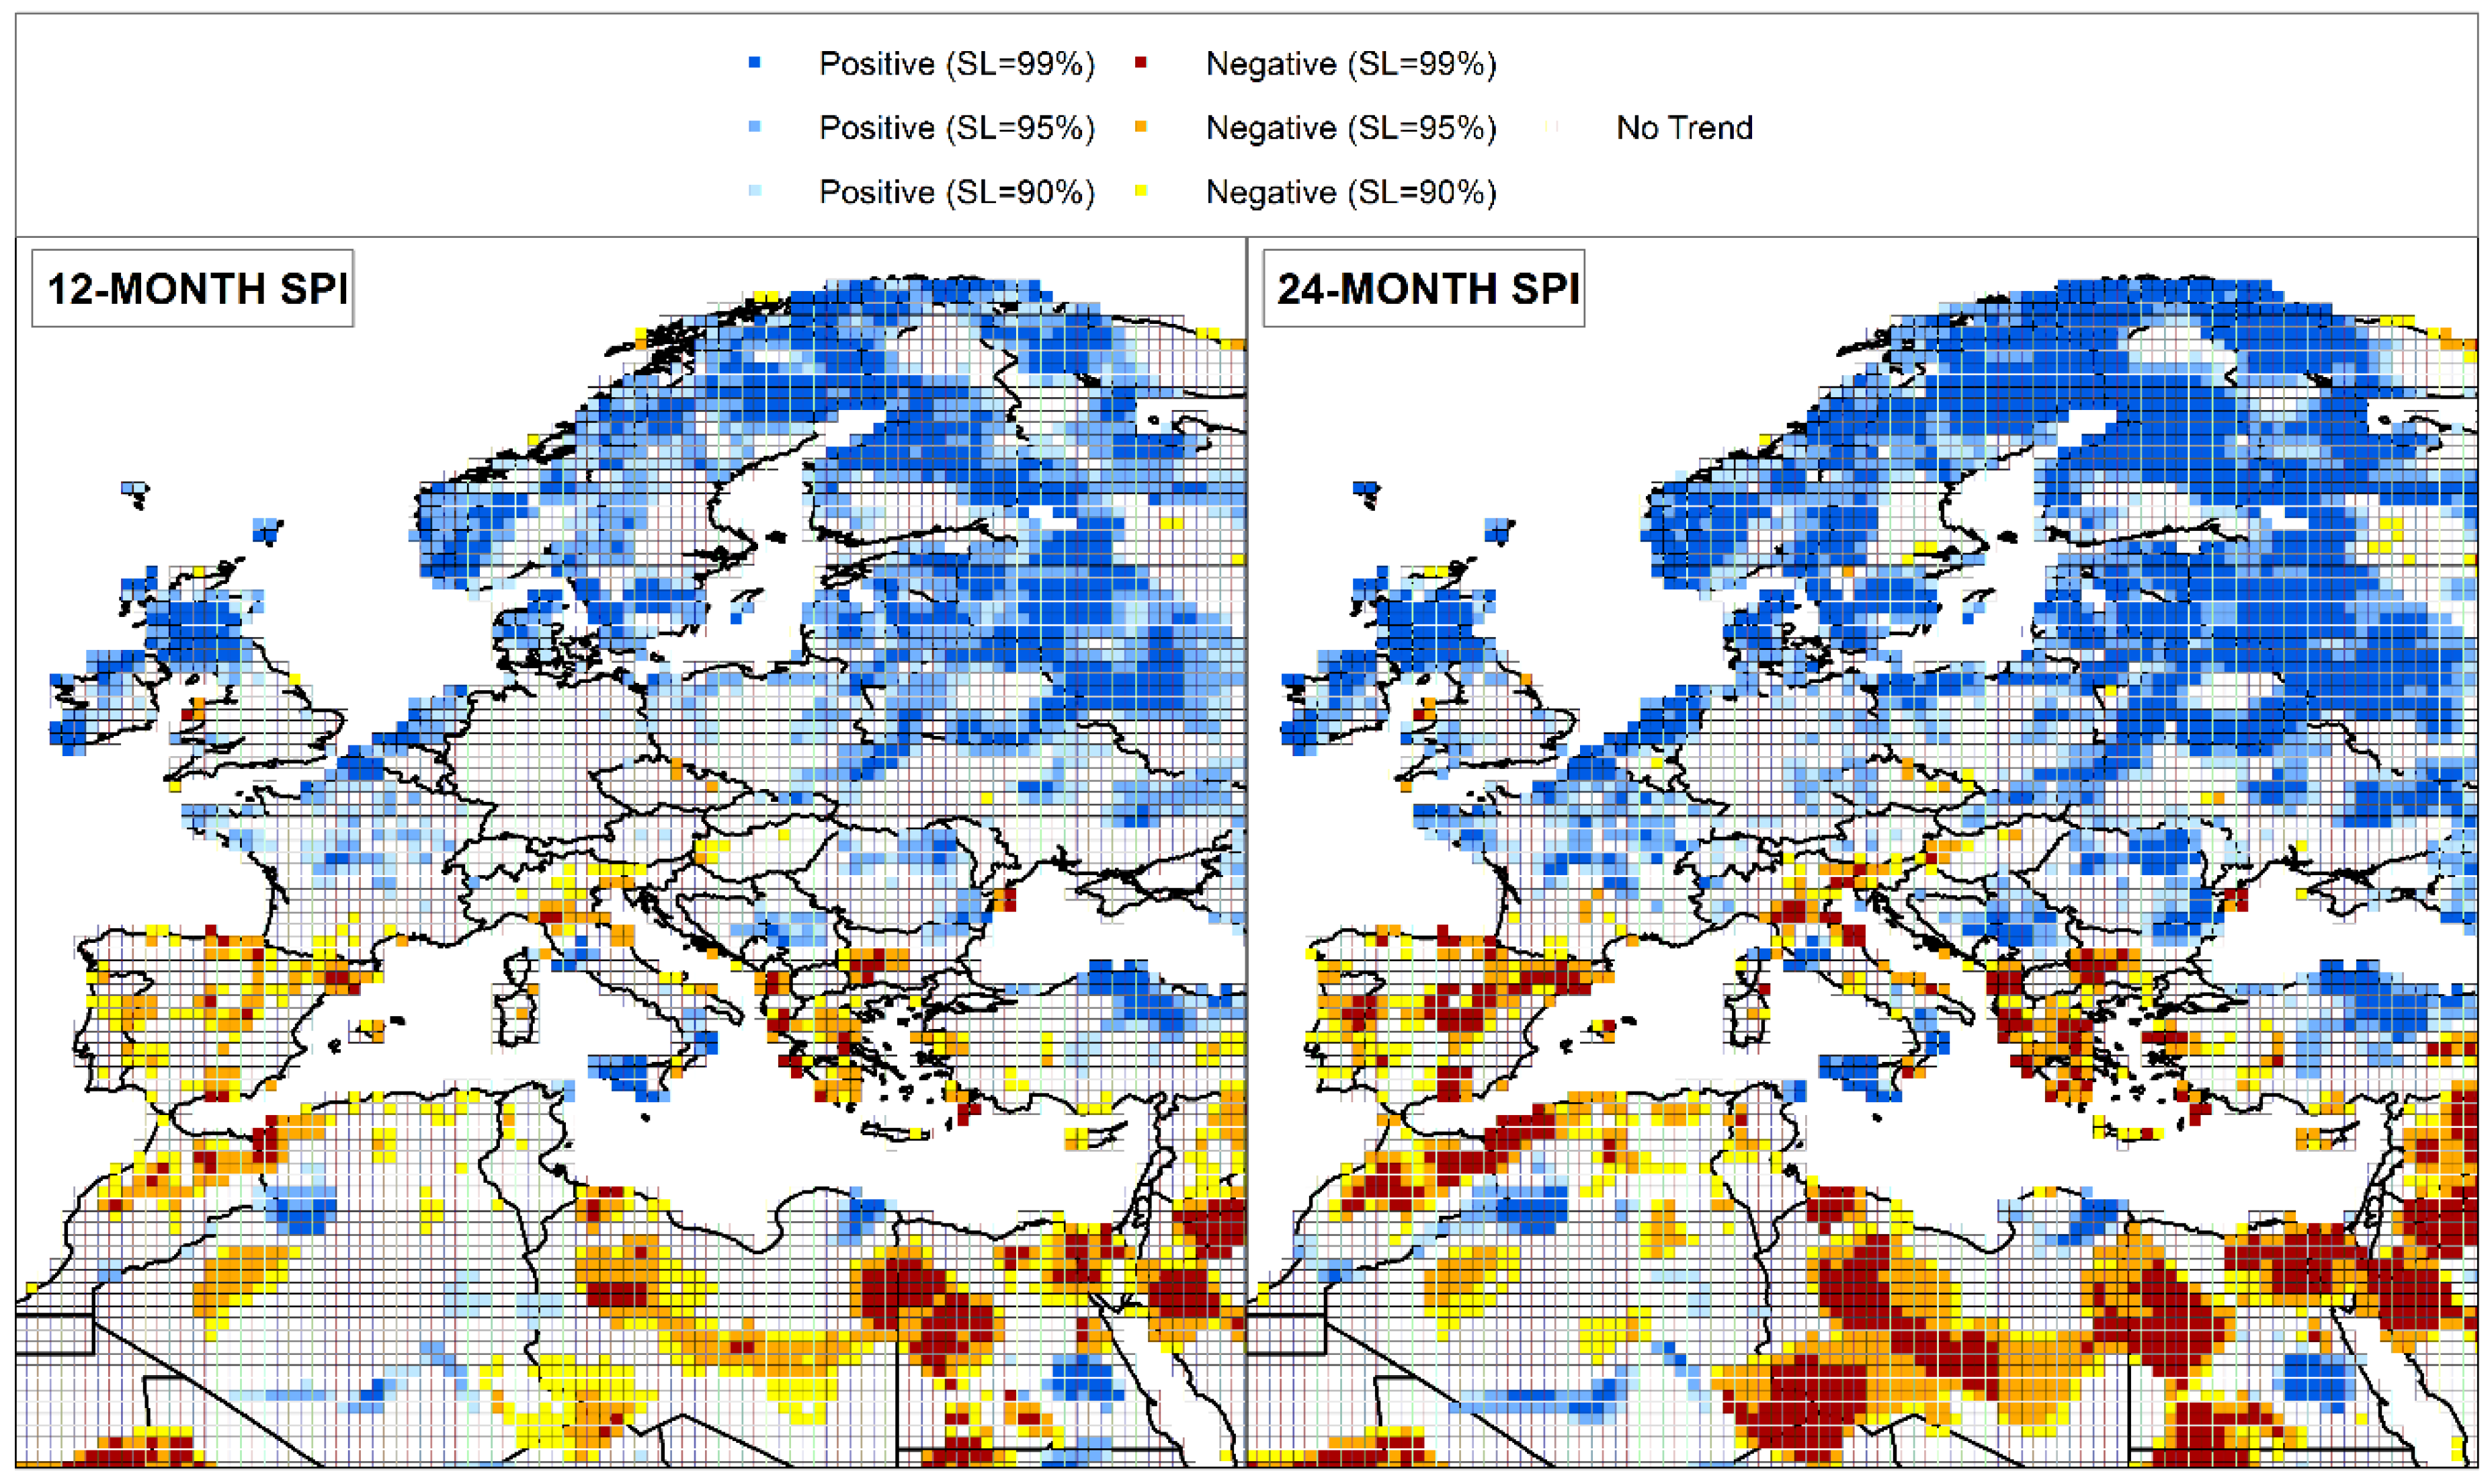
Finally, at an annual scale, a prevalent negative trend can be observed for both the 12-month and the 24-month SPI in the Mediterranean basin (Figure 5). In particular, regarding the 12-month SPI, a marked negative trend has been detected in Italy, Greece, Albania, Bulgaria, Egypt, Libya, Algeria, Morocco, Spain, and the south-eastern sector of the study area for a SL = 99%, and in Portugal, southern France, Croatia, Slovenia, and Tunisia for a SL = 95%. Conversely, northern France, Scotland, Ireland, Poland, Belarus, Russia, Scandinavian countries, and the Baltic republics showed a positive trend (SL = 99%).
The trend behavior evidenced for the 12-month SPI has been confirmed and increased for the 24-month SPI. Indeed, there is an increment of the grid points that show both negative and positive trends with a SL = 99% and a marked difference between the Mediterranean basin and continental Europe can be identified. A negative trend has been detected in almost all the Mediterranean basin and, in particular, in Italy, Slovenia, Albania, Greece, Macedonia, Hungary, Bulgaria, Turkey, Israel, Egypt, Libya, Algeria, Tunisia, Spain, and Portugal. On the contrary, Ireland, Scotland, northern France, Benelux, Germany, Scandinavian countries, the Baltic republics, and all the countries from Serbia to the north-east of the study area evidenced a positive trend in the SPI values.
Results of this study, which evidenced different trends between continental Europe and the Mediterranean basin, confirm past studies. Indeed, while in continental Europe dry periods have been identified in the 20th century [63,64,65], the 2000s have been characterized by an increase in drought frequency and severity in Southern Europe and the Mediterranean area [66,67], but also in some areas of Russia. In particular, Northern and Eastern Europe showed the highest drought frequency and severity from the early 1950s to the mid-1970s while Southern and Western Europe showed the highest drought frequency and severity from the early 1990s onwards [68,69]. These trend behaviors in the Euro-Mediterranean area could be related to teleconnection patterns which reflect large-scale changes in the atmospheric wave and influence temperature, rainfall, storm tracks, jet stream location and intensity over vast areas [70,71]. Several past studies [72,73,74] showed the impacts of the North Atlantic Oscillation (NAO) especially in the western Mediterranean area. The influence of the NAO is strongest in winter and early spring. Positive phases of the NAO, such as the one starting around 1970 which is related to the drought from the early 1990s onwards, cause drying across the northern reaches of the Mediterranean basin, from Spain and Morocco across to the Balkans and western Turkey, while favoring wetter conditions in coastal regions of Libya, Egypt, and the Levant [75,76] with a simultaneous increase in cyclones and precipitation in Northern Europe [77]. On the contrary, negative phases of the NAO, such as the one between 1950 and 1970, can be related to the Northern and Eastern Europe droughts. In fact, besides the Mediterranean basin, the Northern Hemisphere is also generally influenced by the NAO, especially in the last year when the northern center of the NAO dipole moved close to Scandinavia [78]. For example, due to the NAO influence, in the last decades Scotland has been subject to increasing rainfall frequencies and total amounts, larger than those available in the bordering areas; this could be the reason why Scotland is less prone to drought events. Instead, the dry conditions detected in North Africa could be associated with the well-documented Sahelian drought, which results from the response of the African summer monsoon to oceanic forcing, amplified by land-atmosphere interaction [79]. Finally, as evidenced also by Spinoni et al. [42], Central Europe is known to be the transition area between wetting northeastern and drying southwestern European countries, which was reflected in mixed or negligible drought tendencies.
Finally, an important remark concerning the accuracy of the obtained gridded results and some uncertainty issues is necessary in order to better appreciate the results of this study. Indeed, the latter may differ from those obtained by other regional studies using direct rain gauge measurements. Such a difference must be ascribed to some uncertainty factors associated with the GPCC gridded products which, as Becker et al. [60] have evidenced, result from the interpolation of irregularly distributed rain gauge measurements onto regular grids.
5. Conclusions
In this paper, starting from a globally gridded precipitation data set of monthly rainfall observations, a drought analysis has been performed over a large area of the Northern Hemisphere which includes continental Europe, Ireland, the United Kingdom, and the Mediterranean basin and which reaches portions of three continents, Europe, Asia, and Africa. In particular, the GPCC globally gridded precipitation data set was used, the SPI has been evaluated, and a trend analysis has been applied on the SPI values at four different time scales. As a result of the temporal evolution of the percentage of grid points falling within the severe and extreme drought categories, considering the 3- and 6-month SPI, several dry episodes have been detected during the last century. In particular, the first and most diffused drought event took place in 1954 involving more than 30% of the grid points. In the twenty-first century, three main drought events have been detected in 2003, 2011, and 2014 but only for the 3-month SPI. Regarding the 12- and 24-month SPI, the most diffused events of the past century occurred before 1990, and in particular between 1959 and 1960, in 1964, in 1973, and between 1976 and 1977. In this century, the worst drought events have been detected between October 2001 and August 2002 involving only about 12% and 13.5% of the grid points. The trend analysis applied showed very different results among the different time scales and between continental Europe and the Mediterranean basin. In particular, at a seasonal scale, a marked positive trend has been detected in winter in several areas of Central and Northern Europe, while a clear negative trend has been mainly evidenced in the Mediterranean basin. This trend behavior has been confirmed considering the autumn-winter period, although in more restricted areas. At an annual scale the difference between the Mediterranean basin and continental Europe is more marked, in particular considering the trend analysis on the 24-month SPI when large areas of the Mediterranean basin showed negative trends with a SL = 99% and a huge number of central and eastern European nations presented marked positive trends. As a result of this marked trend obtained for the 12- and 24-month SPI, drought in Europe and in the Mediterranean basin seems to have higher impact on water resource management than on vegetation and agricultural practices. In fact, while the 3- and 6-month SPI describe droughts that affect plant life and farming, the 12- and 24-month SPI influence the way water supplies and reserves are managed.
Author Contributions
F.F. and P.C. downloaded the data and prepared the database; T.C. and S.V. analyzed the data and performed the applications; all the authors wrote the paper.
Funding
This research received no external funding.
Conflicts of Interest
The authors declare no conflict of interest.
References
- IPCC. Summary for Policymakers. In Fifth Assessment Report of the Intergovernmental Panel on Climate Change; Cambridge University Press: Cambridge, UK, 2014. [Google Scholar]
- Estrela, T.; Vargas, E. Drought management plans in the European Union. Water Resour. Manag. 2010, 26, 1537–1553. [Google Scholar] [CrossRef]
- Kreibich, H.; Di Baldassarre, G.; Vorogushyn, S.; Aerts, J.C.J.H.; Apel, H.; Aronica, G.T.; Arnbjerg-Nielsen, K.; Bouwer, L.M.; Bubeck, P.; Caloiero, T.; et al. Adaptation to flood risk: Results of international paired flood event studies. Earth’s Future 2017, 5, 953–965. [Google Scholar] [CrossRef]
- Fang, K.; Gou, X.; Chen, F.; Davi, N.; Liu, C. Spatiotemporal drought variability for central and eastern Asia over the past seven centuries derived from tree-ring based reconstructions. Q. Int. 2013, 283, 107–116. [Google Scholar] [CrossRef]
- Hua, T.; Wang, X.M.; Zhang, C.X.; Lang, L.L. Temporal and spatial variations in the Palmer Drought Severity Index over the past four centuries in arid, semiarid, and semihumid East Asia. Chin. Sci. Bull. 2013, 58, 4143–4152. [Google Scholar] [CrossRef] [Green Version]
- Minetti, J.L.; Vargas, W.M.; Poblete, A.G.; de la Zerda, L.R.; Acuña, L.R. Regional droughts in southern South America. Theor. Appl. Climatol. 2010, 102, 403–415. [Google Scholar] [CrossRef]
- Feng, S.; Hu, Q.; Oglesby, R.J. Influence of Atlantic sea surface temperatures on persistent drought in North America. Clim. Dyn. 2011, 37, 569–586. [Google Scholar] [CrossRef]
- Stagge, J.H.; Tallaksen, L.M.; Kohn, I.; Stahl, K.; van Loon, A.F. A European Drought Reference (EDR) Database: Design and Online Implementation; DROUGHT-R&SPI Deliverable D1.1; Technical Report No. 12. European Drought Centre, 2013. Available online: http://www.eu-drought.org/media/default.aspx/emma/org/10832306/DROUGHT-RSPI+Techincal+Report+No++12+European+Drought+Reference+Database+Stagge+et+al++30Sept2013.pdf (accessed on 4 July 2018).
- Lloyd-Huhes, B.; Saunders, M.A. A drought climatology for Europe. Int. J. Climatol. 2002, 22, 1571–1592. [Google Scholar] [CrossRef] [Green Version]
- Łabędzki, L. Estimation of local drought frequency in central Poland using the standardized precipitation index SPI. Irrig. Drain. 2007, 56, 67–77. [Google Scholar] [CrossRef]
- Szalai, S.; Szinell, C. Comparison of two drought indices for drought monitoring in Hungary—A case study. In Drought and Drought Mitigation in Europe; Kluwer: Dordrecht, The Netherlands, 2000. [Google Scholar]
- Buttafuoco, G.; Caloiero, T.; Ricca, N.; Guagliardi, I. Assessment of drought and its uncertainty in a southern Italy area (Calabria region). Measurement 2018, 113, 205–210. [Google Scholar] [CrossRef]
- Caloiero, T.; Coscarelli, R.; Ferrari, E.; Sirangelo, B. Analysis of Dry Spells in Southern Italy (Calabria). Water 2015, 7, 3009–3023. [Google Scholar] [CrossRef] [Green Version]
- Sirangelo, B.; Caloiero, T.; Coscarelli, R.; Ferrari, E. Stochastic analysis of long dry spells in Calabria (Southern Italy). Theor. Appl. Climatol. 2017, 127, 711–724. [Google Scholar] [CrossRef]
- Palmer, W.C. Meteorlogical drought. US Weather Bur. 1965, 45, 1–58. [Google Scholar]
- Tsakiris, G.; Pangalounad, D.; Vangelis, H. A regional drought assessment based on the reconnaissance drought index (RDI). Water Resour. Manag. 2007, 21, 821–833. [Google Scholar] [CrossRef]
- McKee, T.B.; Doesken, N.J.; Kleist, J. The relationship of drought frequency and duration to time scales. In Proceedings of the 8th Conference on Applied Climatology, Anaheim, CA, USA, 17–22 January 1993; pp. 179–184. [Google Scholar]
- McKee, T.B.; Doesken, N.J.; Kleist, J. Drought monitoring with multiple time scales. In Proceedings of the 9th Conference on Applied Climatology, Dallas, TX, USA, 15–20 January 1995; pp. 233–236. [Google Scholar]
- Vicente-Serrano, S.M.; Beguería, S.; López-Moreno, J.I. A multi-scalar drought index sensitive to global warming: The standardized precipitation evapotranspiration index—SPEI. J. Clim. 2010, 23, 1696–1718. [Google Scholar] [CrossRef]
- Shafer, B.A.; Dezman, L.E. Development of a surface water supply index (SWSI) to assess the severity of drought conditions in snow pack runoff areas. In Proceedings of the 50th Annual Western Snow Conference, Reno, NV, USA, 19–23 April 1982; pp. 164–175. [Google Scholar]
- Nalbantis, I.; Tsakiris, G. Assessment of hydrological drought revisited. Water Resour. Manag. 2009, 23, 881–897. [Google Scholar] [CrossRef]
- Van Rooy, M.P. A rainfall anomaly index independent of time and space. Notos 1965, 14, 43–48. [Google Scholar]
- Shukla, S.; Wood, A.W. Use of a standardized runoff index for characterizing hydrologic drought. Geophys. Res. Lett. 2008, 35, L02405. [Google Scholar] [CrossRef]
- Tabari, H.; Abghari, H.; Hosseinzadeh Talaee, P. Temporal trends and spatial characteristics of drought and rainfall in arid and semi-arid regions of Iran. Hydrol. Process. 2012, 26, 3351–3361. [Google Scholar] [CrossRef]
- Bayissa, Y.A.; Moges, S.A.; Xuan, Y.; Van Andel, S.J.; Maskey, S.; Solomatine, D.P.; Griensven, A.; Van Tadesse, T. Spatio-temporal assessment of meteorological drought under the influence of varying record length: The case of Upper Blue Nile Basin, Ethiopia. Hydrol. Sci. J. 2015, 60, 1927–1942. [Google Scholar] [CrossRef]
- Capra, A.; Scicolone, B. Spatiotemporal variability of drought on a short–medium time scale in the Calabria Region (Southern Italy). Theor. Appl. Climatol. 2012, 3, 471–488. [Google Scholar] [CrossRef]
- Vicente-Serrano, S.M. Differences in spatial patterns of drought on different time sales: An analysis of the Iberian Peninsula. Water Resour. Manag. 2006, 20, 37–60. [Google Scholar] [CrossRef]
- Wu, H.; Hayes, M.J.; Wilhite, D.A.; Svoboda, M.D. The effect of the length of record on the standardized precipitation index calculation. Int. J. Climatol. 2005, 25, 505–520. [Google Scholar] [CrossRef] [Green Version]
- Guttman, N.B. Comparing the Palmer drought severity index and the standardized precipitation Index. J. Am. Water Res. Assoc. 1998, 34, 113–121. [Google Scholar] [CrossRef]
- Hayes, M.J.; Svoboda, M.; Wilhite, D.A.; Vanyarkho, O. Monitoring the 1996 drought using the SPI. Bull. Am. Meteorol. Soc. 1999, 80, 429–438. [Google Scholar] [CrossRef]
- Guttman, N.B. Accepting the standardized precipitation index: A calculating algorithm. J. Am. Water Resour. Assoc. 1999, 35, 311–323. [Google Scholar] [CrossRef]
- Cancelliere, A.; Di Mauro, G.; Bonaccorso, B.; Rossi, G. Drought forecasting using the Standardised Precipitation Index. Water Resour. Manag. 2007, 21, 801–819. [Google Scholar] [CrossRef]
- Khan, S.; Gabriel, H.F.; Rana, T. Standard precipitation index to track drought and assess impact of rainfall on watertables in irrigation areas. Irrig. Drain. Syst. 2008, 22, 159–177. [Google Scholar] [CrossRef]
- Manatsa, D.; Mukwada, G.; Siziba, E.; Chinyanganya, T. Analysis of multidimensional aspects of agricultural droughts in Zimbabwe using the Standardized Precipitation Index (SPI). Theor. Appl. Climatol. 2010, 102, 287–305. [Google Scholar] [CrossRef]
- Golian, S.; Mazdiyasni, O.; AghaKouchak, A. Trends in meteorological and agricultural droughts in Iran. Theor. Appl. Climatol. 2015, 119, 679–688. [Google Scholar] [CrossRef]
- Zhai, J.; Su, B.; Krysanova, V.; Vetter, T.; Gao, C.; Jiang, T. Spatial variation and trends in pdsi and spi indices and their relation to streamflow in 10 large regions of china. J. Clim. 2010, 23, 649–663. [Google Scholar] [CrossRef]
- Zhai, L.; Feng, Q. Spatial and temporal pattern of precipitation and drought in Gansu Province Northwest China. Nat. Hazards 2009, 49, 1–24. [Google Scholar] [CrossRef]
- Caloiero, T. Drought analysis in New Zealand using the standardized precipitation index. Environ. Earth Sci. 2017, 76, 569. [Google Scholar] [CrossRef]
- Caloiero, T. SPI Trend Analysis of New Zealand Applying the ITA Technique. Geosciences 2018, 8, 101. [Google Scholar] [CrossRef]
- Bordi, I.; Fraedrich, K.; Sutera, A. Observed drought and wetness trends in Europe: An update. Hydrol. Earth Syst. Sci. 2009, 13, 1519–1530. [Google Scholar] [CrossRef]
- Trnka, M.; Balek, J.; Štěpánek, P.; Zahradníček, P.; Možný, M.; Eitzinger, J.; Žalud, Z.; Formayer, H.; Turňa, M.; Nejedlík, P.; et al. Drought trends over part of Central Europe between 1961 and 2014. Clim. Res. 2016, 70, 143–160. [Google Scholar] [CrossRef] [Green Version]
- Spinoni, J.; Vogt, J.V.; Naumann, G.; Barbosa, P.; Dosio, A. Will drought events become more frequent and severe in Europe? Int. J. Climatol. 2018, 38, 1718–1736. [Google Scholar] [CrossRef]
- Livada, I.; Assimakopoulos, V.D. Spatial and temporal analysis of drought in Greece using the Standardized Precipitation Index (SPI). Theor. Appl. Climatol. 2007, 89, 143–153. [Google Scholar] [CrossRef]
- Sönmez, F.K.; Kömüscü, A.Ü.; Erkan, A.; Turgu, E. An analysis of spatial and temporal dimension of drought vulnerability in Turkey using the Standardized Precipitation Index. Nat. Hazards 2005, 35, 243–264. [Google Scholar] [CrossRef]
- Mendicino, G.; Senatore, A.; Versace, P. A Groundwater Resource Index (GRI) for drought monitoring and forecasting in a Mediterranean climate. J. Hydrol. 2008, 357, 282–302. [Google Scholar] [CrossRef]
- Buttafuoco, G.; Caloiero, T. Drought events at different timescales in southern Italy (Calabria). J. Maps 2014, 10, 529–537. [Google Scholar] [CrossRef] [Green Version]
- Buttafuoco, G.; Caloiero, T.; Coscarelli, R. Analyses of Drought Events in Calabria (Southern Italy) Using Standardized Precipitation Index. Water Resour. Manag. 2015, 29, 557–573. [Google Scholar] [CrossRef]
- Caloiero, T.; Coscarelli, R.; Ferrari, E.; Sirangelo, B. An Analysis of the Occurrence Probabilities of Wet and Dry Periods through a Stochastic Monthly Rainfall Model. Water 2016, 8, 39. [Google Scholar] [CrossRef]
- Caloiero, T.; Sirangelo, B.; Ferrari, E.; Coscarelli, R. Occurrence Probabilities of Wet and Dry Periods in Southern Italy through the SPI Evaluated on Synthetic Monthly Precipitation Series. Water 2018, 10, 336. [Google Scholar] [CrossRef]
- Edwards, D.; McKee, T. Characteristics of 20th Century Drought in the United States at Multiple Scale; Atmospheric Science Paper 634; Department of Atmospheric Science Colorado State University: Fort Collins, CO, USA, 1997. [Google Scholar]
- Bonaccorso, B.; Bordi, I.; Cancelliere, A.; Rossi, G.; Sutera, A. Spatial variability of drought: An analysis of SPI in Sicily. Water Resour. Manag. 2003, 17, 273–296. [Google Scholar] [CrossRef]
- Angelidis, P.; Maris, F.; Kotsovinos, N.; Hrissanthou, V. Computation of drought index SPI with Alternative Distribution Functions. Water Resour. Manag. 2012, 26, 2453–2473. [Google Scholar] [CrossRef]
- Thom, H.C.S. A note on the gamma distribution. Mon. Weather Rev. 1958, 86, 117–122. [Google Scholar] [CrossRef]
- Abramowitz, M.; Stegun, I.A. Handbook of Mathematical Functions with Formulas, Graphs, and Mathematical Tables; Dover Publications, INC.: New York, NY, USA, 1970. [Google Scholar]
- National Drought Mitigation Center (NDMC) University of Nebraska. Available online: http://drought.unl.edu (accessed on 4 July 2018).
- Mann, H.B. Nonparametric tests against trend. Econometrica 1945, 13, 245–259. [Google Scholar] [CrossRef]
- Kendall, M.G. Rank Correlation Methods; Charles Griffin & Company Limited: London, UK, 1962. [Google Scholar]
- Schneider, U.; Becker, A.; Finger, P.; Meyer-Christoffer, A.; Ziese, M. GPCC Full Data Monthly Product Version 2018 at 0.5°: Monthly Land-Surface Precipitation from Rain-Gauges Built on GTS-Based and Historical Data; Deutscher Wetterdienst: Offenbach am Main, Germany, 2018. [Google Scholar] [CrossRef]
- Beck, C.; Grieser, J.; Rudolf, B. A New Monthly Precipitation Climatology for the Global Land Areas for the Period 1951 to 2000. In Klimastatusbericht 2004; Deutscher Wetterdienst: Offenbach, Germany, 2005; pp. 181–190. [Google Scholar]
- Becker, A.; Finger, P.; Meyer-Christoffer, A.; Rudolf, B.; Schamm, K.; Schneider, U.; Ziese, M. A description of the global landsurface precipitation data products of the Global Precipitation Climatology Centre with sample applications including centennial (trend) analysis from 1901–present. Earth Syst. Sci. Data 2013, 5, 921–998. [Google Scholar] [CrossRef]
- Schneider, U.; Becker, A.; Finger, P.; Meyer-Christoffer, A.; Ziese, M.; Rudolf, B. GPCC’s new land-surface precipitation climatology based on quality-controlled in-situ data and its role in quantifying the global water cycle. Theor. Appl. Climatol. 2014, 115, 15–40. [Google Scholar] [CrossRef]
- Caloiero, T.; Caloiero, P.; Frustaci, F. Long-term precipitation trend analysis in Europe and in the Mediterranean basin. Water Environ. J. 2018. [Google Scholar] [CrossRef]
- Herweijer, C.; Seager, R. The global footprint of persistent extra-tropical drought in the instrumental era. Int. J. Climatol. 2008, 28, 1761–1774. [Google Scholar] [CrossRef] [Green Version]
- Briffa, K.R.; Jones, P.D.; Hulme, M. Summer moisture variability across Europe, 1892–1991: An analysis based on the Palmer drought severity index. Int. J. Climatol. 1994, 14, 475–506. [Google Scholar] [CrossRef]
- Van der Schrier, G.; Briffa, K.R.; Jones, P.D.; Osborn, T.J. Summer moisture variability across Europe. J. Clim. 2006, 19, 2818–2834. [Google Scholar] [CrossRef]
- Vicente-Serrano, S.M.; López-Moreno, J.I.; Lorenzo-Lacruz, J.; El Kenawy, A.; Azorin-Molina, C.; Morán-Tejeda, E.; Pasho, E.; Zabalza, J.; Begueria, S.; Angulo-Martinez, M. The NAO impact on droughts in the Mediterranean region. In Hydro-Logical, Socioeconomic and Ecological Impacts of the North Atlantic Oscillation in the Mediterranean Region Advances in Global Change Research; Springer: Dordrecht, The Netherlands, 2011. [Google Scholar]
- Hoerling, M.; Eischeid, J.; Perlwitz, J.; Quan, X.; Zhang, T.; Pegion, P. On the increased frequency of Mediterranean drought. J. Clim. 2012, 25, 2146–2161. [Google Scholar] [CrossRef]
- Spinoni, J.; Naumann, G.; Vogt, J.V.; Barbosa, P. The biggest drought events in Europe from 1950 to 2012. J. Hydrol. Reg. Stud. 2015, 3, 509–524. [Google Scholar] [CrossRef]
- Labudová, L.; Labuda, M.; Takáč, J. Comparison of SPI and SPEI applicability for drought impact assessment on crop production in the Danubian Lowland and the East Slovakian Lowland. Theor. Appl. Clim. 2017, 128, 491–506. [Google Scholar] [CrossRef]
- Woollings, T.; Hannachi, A.; Hoskins, B. Atlantic eddy-driven jet stream. Q. J. R. Meteorol. Soc. 2010, 136, 856–868. [Google Scholar] [CrossRef]
- Bader, J.; Mesquita, M.D.S.; Hodges, K.I.; Keenlyside, N.; Østerhus, S.; Miles, M. A review on Northern Hemisphere seaice, storminess and the North Atlantic Oscillation: Observations and projected changes. Atmos. Res. 2011, 101, 809–834. [Google Scholar] [CrossRef]
- Trigo, I.F.; Davies, T.D.; Bigg, G.R. Decline in Mediterranean rainfall caused by weakening of mediterranean cyclones. Geophys. Res. Lett. 2000, 27, 2913–2916. [Google Scholar] [CrossRef]
- Caloiero, T.; Coscarelli, R.; Ferrari, E.; Mancini, M. Precipitation change in Southern Italy linked to global scale oscillation indexes. Nat. Hazards Earth Syst. Sci. 2011, 11, 1683–1694. [Google Scholar] [CrossRef] [Green Version]
- Ferrari, E.; Caloiero, T.; Coscarelli, R. Influence of the North Atlantic Oscillation on winter rainfall in Calabria (southern Italy). Theor. Appl. Climatol. 2013, 114, 479–494. [Google Scholar] [CrossRef]
- Quadrelli, R.; Pavan, V.; Molteni, F. Wintertime variability of Mediterranean precipitation and its links with large-scale circulation anomalies. Clim. Dyn. 2001, 17, 457–466. [Google Scholar] [CrossRef]
- Mariotti, A.; Struglia, M.V.; Zeng, N.; Lau, K.M. The hydrological cycle in the Mediterranean region and implications for the water budget of the Mediterranean Sea. J. Clim. 2002, 15, 1674–1690. [Google Scholar] [CrossRef]
- Paredes, D.; Trigo, R.M.; Garcia-Herrera, R.; Trigo, I.F. Understanding precipitation changes in Iberia in early Spring: Weather typing and storm-tracking approaches. J. Hydrometeorol. 2005, 7, 101–113. [Google Scholar] [CrossRef]
- Jung, T.; Hilmer, M. The link between the North Atlantic Oscillation and Arctic sea ice export through Fram Strait. J. Clim. 2001, 14, 3932–3943. [Google Scholar] [CrossRef]
- Giannini, A.; Saravanan, R.; Chang, P. Oceanic forcing of Sahel rainfall on interannual to interdecadal time scales. Science 2003, 302, 1027–1030. [Google Scholar] [CrossRef] [PubMed]
Figure 1.
Mean annual rainfall distribution on the study area for the period 1951–2016.

Figure 2.
Temporal evolution of the percentage of grid points which fell within severe or extreme dry conditions (Standardized Precipitation Index SPI < −1.5) for the period 1951–2016. (a) 3-month SPI; (b) 6-month SPI; (c) 12-month SPI, and (d) 24-month SPI.
Figure 2.
Temporal evolution of the percentage of grid points which fell within severe or extreme dry conditions (Standardized Precipitation Index SPI < −1.5) for the period 1951–2016. (a) 3-month SPI; (b) 6-month SPI; (c) 12-month SPI, and (d) 24-month SPI.

Figure 3.
Spatial distribution of the grid points presenting positive or negative rainfall trends (seasonal scale). The trend analysis has been conducted at a seasonal scale, considering the 3-month SPI values in February for winter, in May for spring, in August for summer, and in November for autumn. Colored squares indicate significant positive or negative trends while white squares refer to a non-significant trend.

Figure 4.
Spatial distribution of the grid points presenting positive or negative rainfall trends (autumn-winter and spring-summer periods). Colored squares indicate significant positive or negative trends while white squares refer to a non-significant trend.
Figure 4.
Spatial distribution of the grid points presenting positive or negative rainfall trends (autumn-winter and spring-summer periods). Colored squares indicate significant positive or negative trends while white squares refer to a non-significant trend.

Figure 5.
Spatial distribution of the grid points presenting positive or negative rainfall trends (annual scale). Colored squares indicate significant positive or negative trends while white squares refer to a non-significant trend.
Figure 5.
Spatial distribution of the grid points presenting positive or negative rainfall trends (annual scale). Colored squares indicate significant positive or negative trends while white squares refer to a non-significant trend.


Table 1.
Climate classification according to the Standardized Precipitation Index (SPI) values.
| SPI Value | Class | Probability (%) |
|---|---|---|
| SPI ≥ 2.00 | Extremely wet | 2.3 |
| 1.50 ≤ SPI < 2.00 | Severely wet | 4.4 |
| 1.00 ≤ SPI < 1.50 | Moderately wet | 9.2 |
| 0.00 ≤ SPI < 1.00 | Mildly wet | 34.1 |
| −1.00 ≤ SPI < 0.00 | Mild drought | 34.1 |
| −1.50 ≤ SPI < −1.00 | Moderate drought | 9.2 |
| −2.00 ≤ SPI < −1.50 | Severe drought | 4.4 |
| SPI < −2.00 | Extreme drought | 2.3 |
© 2018 by the authors. Licensee MDPI, Basel, Switzerland. This article is an open access article distributed under the terms and conditions of the Creative Commons Attribution (CC BY) license (http://creativecommons.org/licenses/by/4.0/).
Share and Cite
MDPI and ACS Style
Caloiero, T.; Veltri, S.; Caloiero, P.; Frustaci, F. Drought Analysis in Europe and in the Mediterranean Basin Using the Standardized Precipitation Index. Water 2018, 10, 1043. https://doi.org/10.3390/w10081043
AMA Style
Caloiero T, Veltri S, Caloiero P, Frustaci F. Drought Analysis in Europe and in the Mediterranean Basin Using the Standardized Precipitation Index. Water. 2018; 10(8):1043. https://doi.org/10.3390/w10081043
Chicago/Turabian StyleCaloiero, Tommaso, Simone Veltri, Paola Caloiero, and Francesco Frustaci. 2018. "Drought Analysis in Europe and in the Mediterranean Basin Using the Standardized Precipitation Index" Water 10, no. 8: 1043. https://doi.org/10.3390/w10081043
Note that from the first issue of 2016, this journal uses article numbers instead of page numbers. See further details here.