Conceptualization and Schematization of Mesoscale Sustainable Drainage Systems: A Full-Scale Study


1
Water and Environmental Engineering, Department of Chemical Engineering, Lund University, P.O. Box 124, SE-221 00 Lund, Sweden
2
VA SYD, P.O. Box 191, SE-201 21 Malmö, Sweden
*
Author to whom correspondence should be addressed.
Water 2018, 10(8), 1041; https://doi.org/10.3390/w10081041
Submission received: 18 June 2018
/
Revised: 23 July 2018
/
Accepted: 3 August 2018
/
Published: 6 August 2018
(This article belongs to the Special Issue The Challenges of Water Management and Governance in Cities)
Abstract
:Sustainable Drainage Systems (SuDS) can be considered the joint product of water engineering and urban planning and design since these systems must comply with hydraulic, hydrologic, and social-ecological functions. To enhance this joint collaboration, a conceptual model of mesoscale SuDS is introduced based on the observed rainfall-runoff responses from two catchments with SuDS and a pipe-bound catchment. The model shows that in contrast to pipe systems, SuDS disaggregates the catchment into a group of discrete mini catchments that have no instant connection to the outlet. These mini catchments start to connect to each other (and perhaps to the outlet) as the rainfall depth increases. It is shown that the sequence of stormwater control measures (SCMs as individual components of SuDS) affects the system’s overall performance depending on the volumetric magnitude of the rainfall. The concept is useful in the design and implementation of mesoscale SuDS retrofits, which include several SCMs with different retention and detention capacities within a system.
1. Introduction
Sustainable Drainage Systems (SuDS) within the context of green infrastructure are becoming more accepted and popular in urban landscapes. Numerous studies indicate that these systems, besides delivering multiple ecosystem services and promoting public health [1,2,3], have large retention capacities for the management of rainfall events up to the design magnitude [4]. It has also been pointed out that SuDS have positive effects on flood mitigation [5,6]. Therefore, SuDS are occupying more space in urban landscapes either as an alternative solution or as a complement to the existing combined or separate wastewater collecting infrastructure. The large retention capacity associated with SuDS is achieved by introducing extended pervious areas, which allows increased infiltration along with larger retention and retention volumes as well as slow transport of runoff towards the outlet point [7]. In other words, the management of storm water with SuDS utilizes urban spaces and, therefore, affects their functionality. This means that the urban surfaces occupied by SuDS have to comply with social-ecological qualities besides fulfilling their hydraulic role in an urban drainage perspective. Therefore, the planning and designing of SuDS has to be brought about collaboratively by water engineers and urban planners [8,9,10].
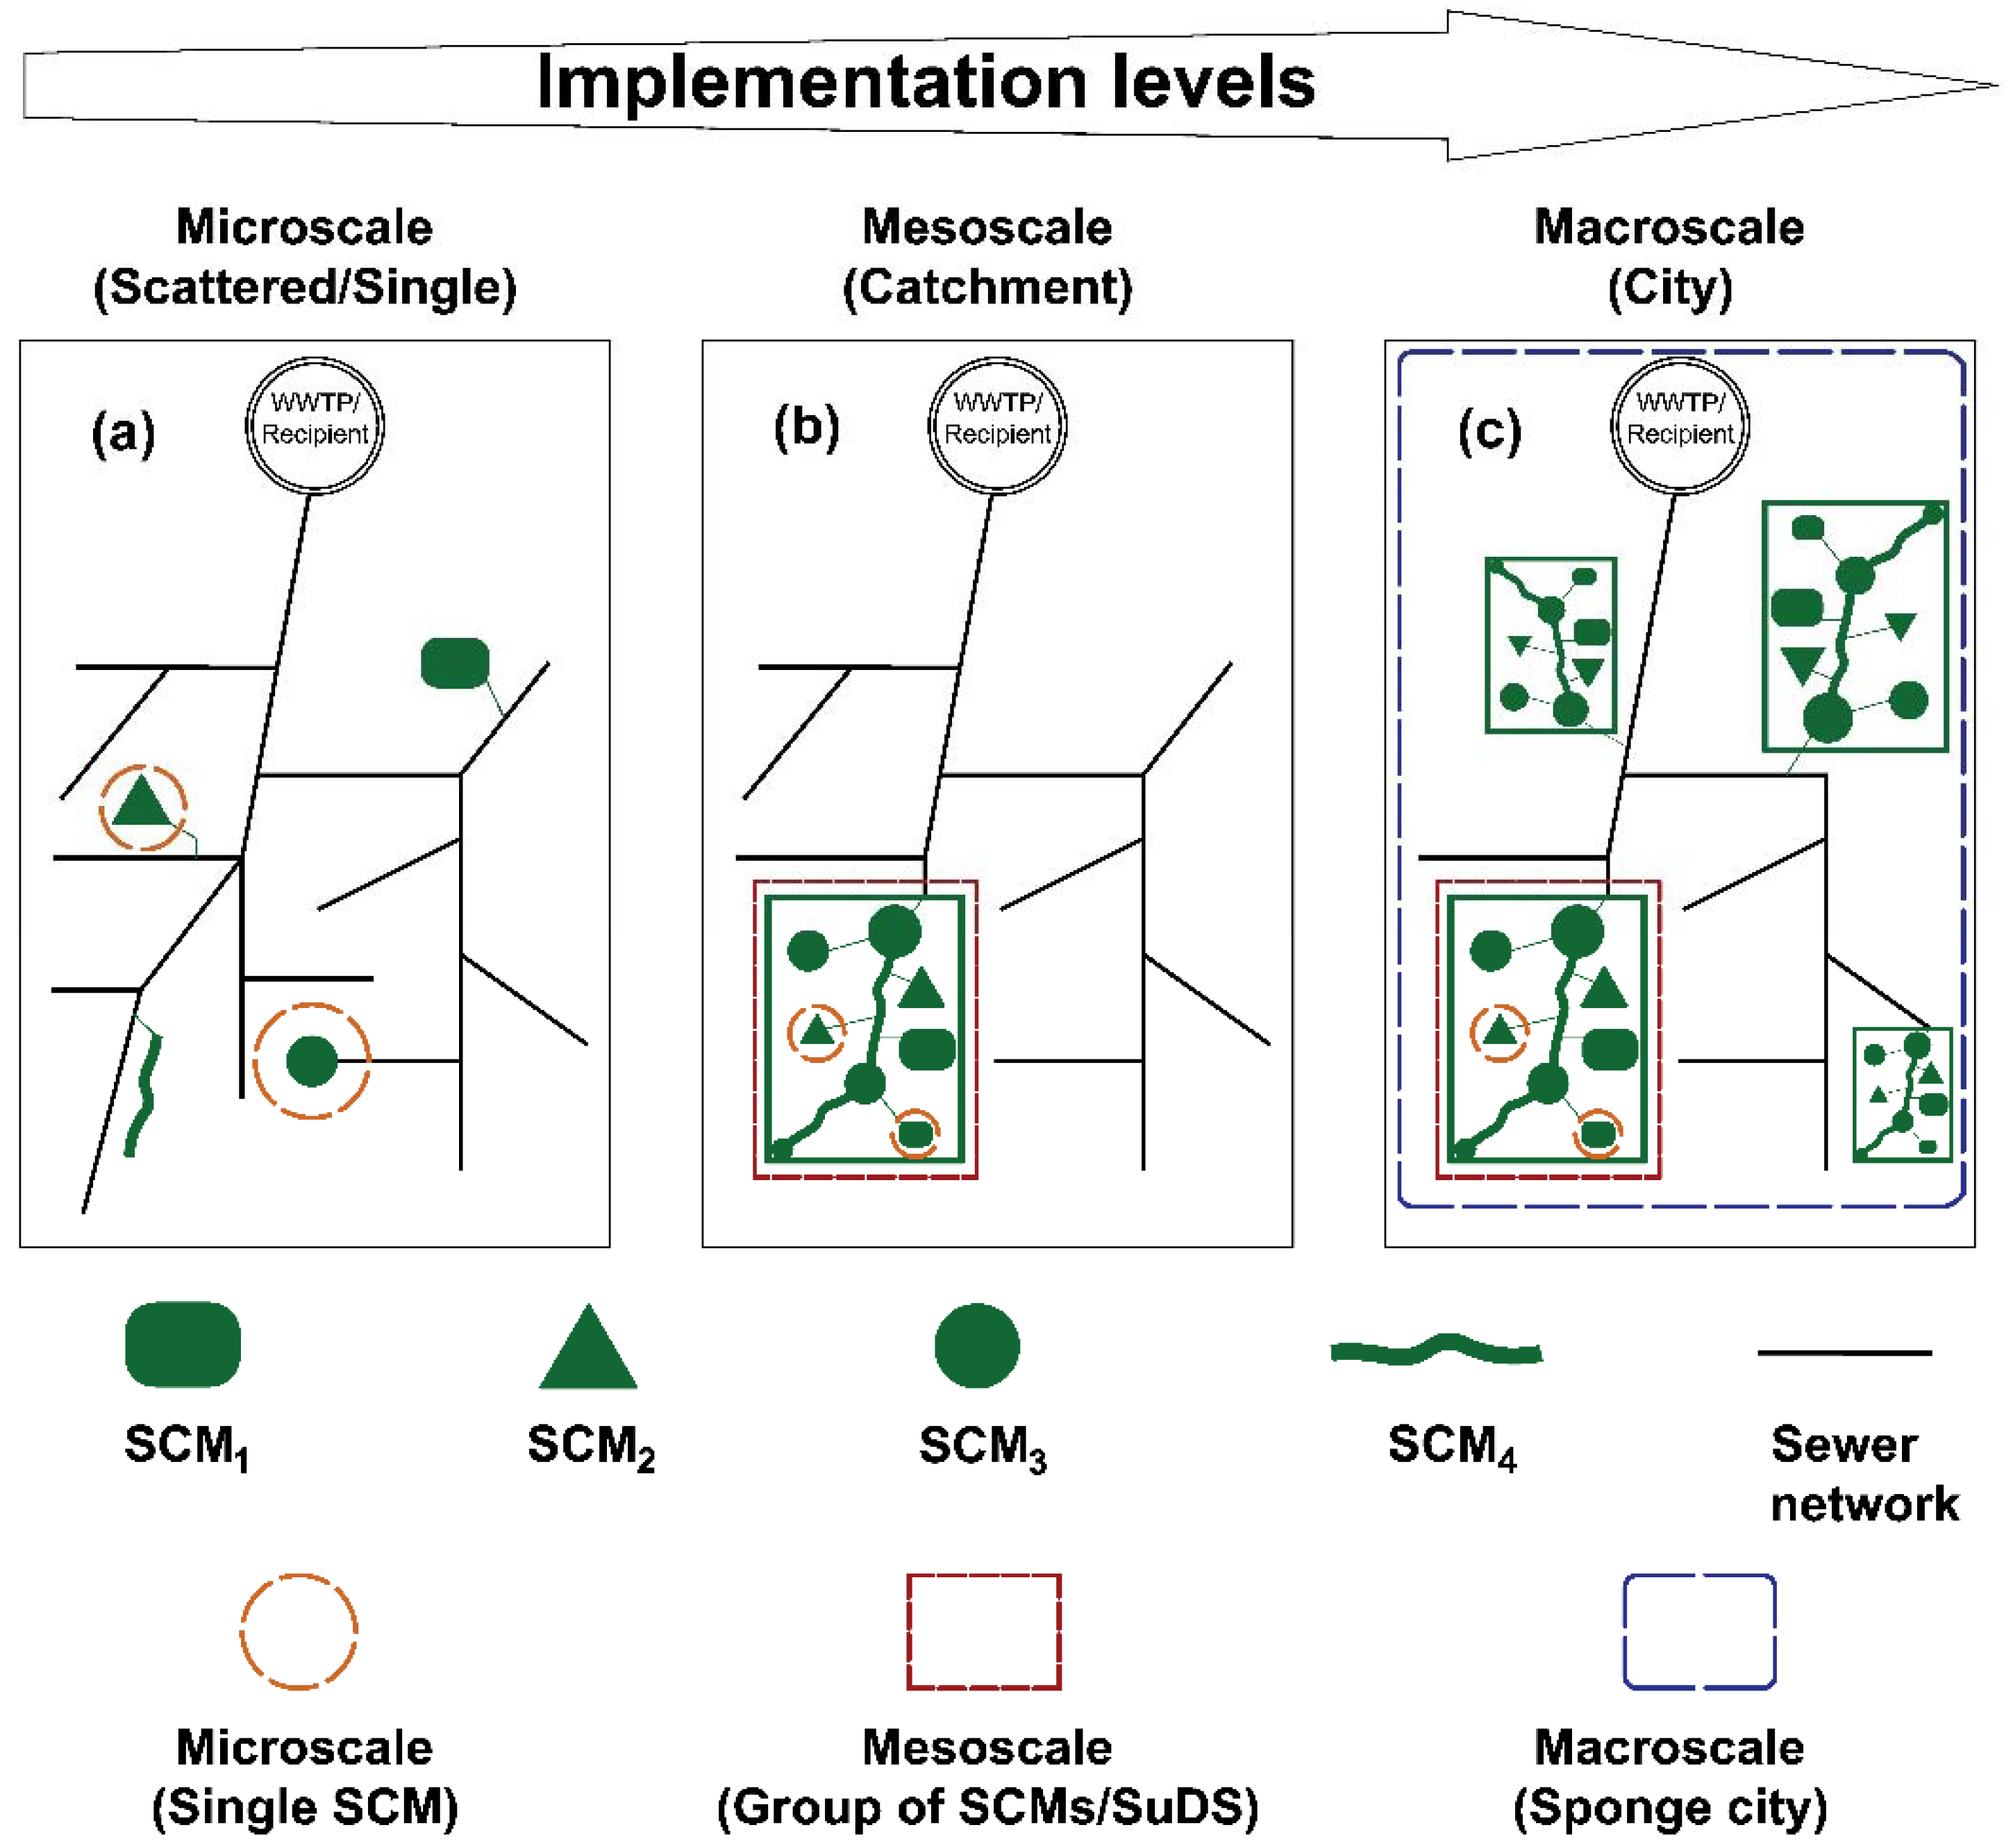
SuDS in urban areas can be implemented at three different levels, i.e., microscale, mesoscale, and macroscale, which was proposed by Haghighatafshar et al. [11]. A graphical illustration of these three levels is presented in Figure 1. A microscale implementation of SuDS (Figure 1a) consists of scattered individual stormwater control measures (SCMs) from which the excess discharge is directly connected to the urban drainage pipe-network (either separated or combined sewer networks). The procedure for designing an individual SCM is already established and widely practiced based on applying existing methods such as the Rational Method or the Time-Area Method. Details of the design process for individual SCMs can be found in e.g., Water Sensitive Urban Design [12].
Mesoscale SuDS (Figure 1b) is implemented at the catchment level. This means that a group of interconnected SCMs are integrated in an urban catchment. In this type of implementation, SCMs are connected to each other so that the collected stormwater could flow from an upstream SCM to a downstream SCM. Mesoscale, in this context, has been referred to as “SuDS management train” by [13]. The extensive implementation of SuDS over the entire city catchments could be considered a macroscale approach (Figure 1c) through which the city could be transformed to a sponge city [14]. In contrast to microscale, studies regarding the hydraulic performance of SuDS at meso-scales and macroscales, as the train of several individual SCMs, are comparatively rare in the literature, e.g., [13,15,16].
In order to facilitate the implementation of SuDS, it is necessary to provide tools and models to enhance the communication between the urban water engineers and urban planners [8]. This can be done by characterizing SCMs as well as understanding their cumulated affect in a larger system, which is reported to be challenging and empirically less attended [17].
One of the early standard frameworks for implementation of SCMs was introduced by Stahre [7] in Sweden in the city of Malmö. Peter Stahre developed administrative procedures where it was outlined how different SCMs could be implemented on private and public land, respectively. As a result, several SCMs where introduced in the late 1990s in Malmö as part of the drainage system. A list of the implemented SCMs/SuDS in Malmö was presented by Haghighatafshar et al. [18]. The most prominent of these implementations is the neighborhood Augustenborg in Malmö, which in contrast to others, is located in the densely constructed and populated part of the city. The implemented SuDS were, to some extent, demonstration facilities showing the potential and the benefits of a new game-changing type of planning process where aesthetically designed open drainage systems were part of the urban landscape in accordance with the motto “make space for the water”. While some potentially suitable measures were tentatively suggested at each level from upstream to downstream, the hydraulic and hydrologic performance of the suggested SCMs and of the entire system were not addressed. With the more intense rainfall events that have been experienced in many parts of the world as well as an elevated densification of our cities, the interest in SCMs especially in already built areas has grown [6,11].
The aim of this study is to introduce a new conceptual function-oriented description of the SuDS at a mesoscale level. The suggested model is based on observed rainfall-runoff data from the perspective of connectedness of surfaces and, to what extent, they contribute to the observed runoff. Consequently, the concept is applied to schematize the existing SuDS in Augustenborg as a demonstration. This approach aims to bridge an engineering design to urban planning and design by providing a simple hydraulic scheme for mesoscale SuDS.
2. Methodology
This study is based on rainfall-runoff measurements in an urban catchment of about 20 ha in which the runoff from most surfaces is managed through combinations of SCMs. All the implemented SCMs in the study area are surface-based (open) stormwater solutions. The study area known as Augustenborg was originally drained through the underground pipe-system of the city. For two years, flow measurements were carried out at the most downstream of catchments where the excess runoff is diverted into the major wastewater collecting system of the city. The following subsections present the adopted parametrical assessment method, a brief description of the study area, and the employed measurement instrument.
2.1. The Study Area—Augustenborg
Augustenborg is located in the inner city of Malmö, Sweden and is one of the most renowned SuDS retrofits. The area is often regarded as a unique example of an integrated collaboration of urban planners and urban water engineers. In this scenario, an area about 20 ha, which was originally drained with a combined sewer network, is managed via interconnected combinations of SCMs (i.e., mesoscale). The area was retrofitted in the late 1990s and has been in operation for about 20 years now. Augustenborg has been associated with many tentatively positive effects over the years such as, among other benefits, mitigation of basement flooding [19]. However, the effect and the in-depth understanding of the function of the SCMs have never been described in detail and the ideas have not been reproduced elsewhere despite the very positive verdict. One prerequisite for the reproduction is understanding the functionality so that the results, rather than the layout, can be transferred to other places. There is, therefore, a need to develop concepts that discuss SuDS and their functionality in a city-wide perspective to help urban planners and water engineers systematically design and reshape the urban landscapes through a shared perspective. An enhanced communication between engineers and planners can help alleviate some of the institutional shortcomings [20] for the widespread adoption of SCMs.
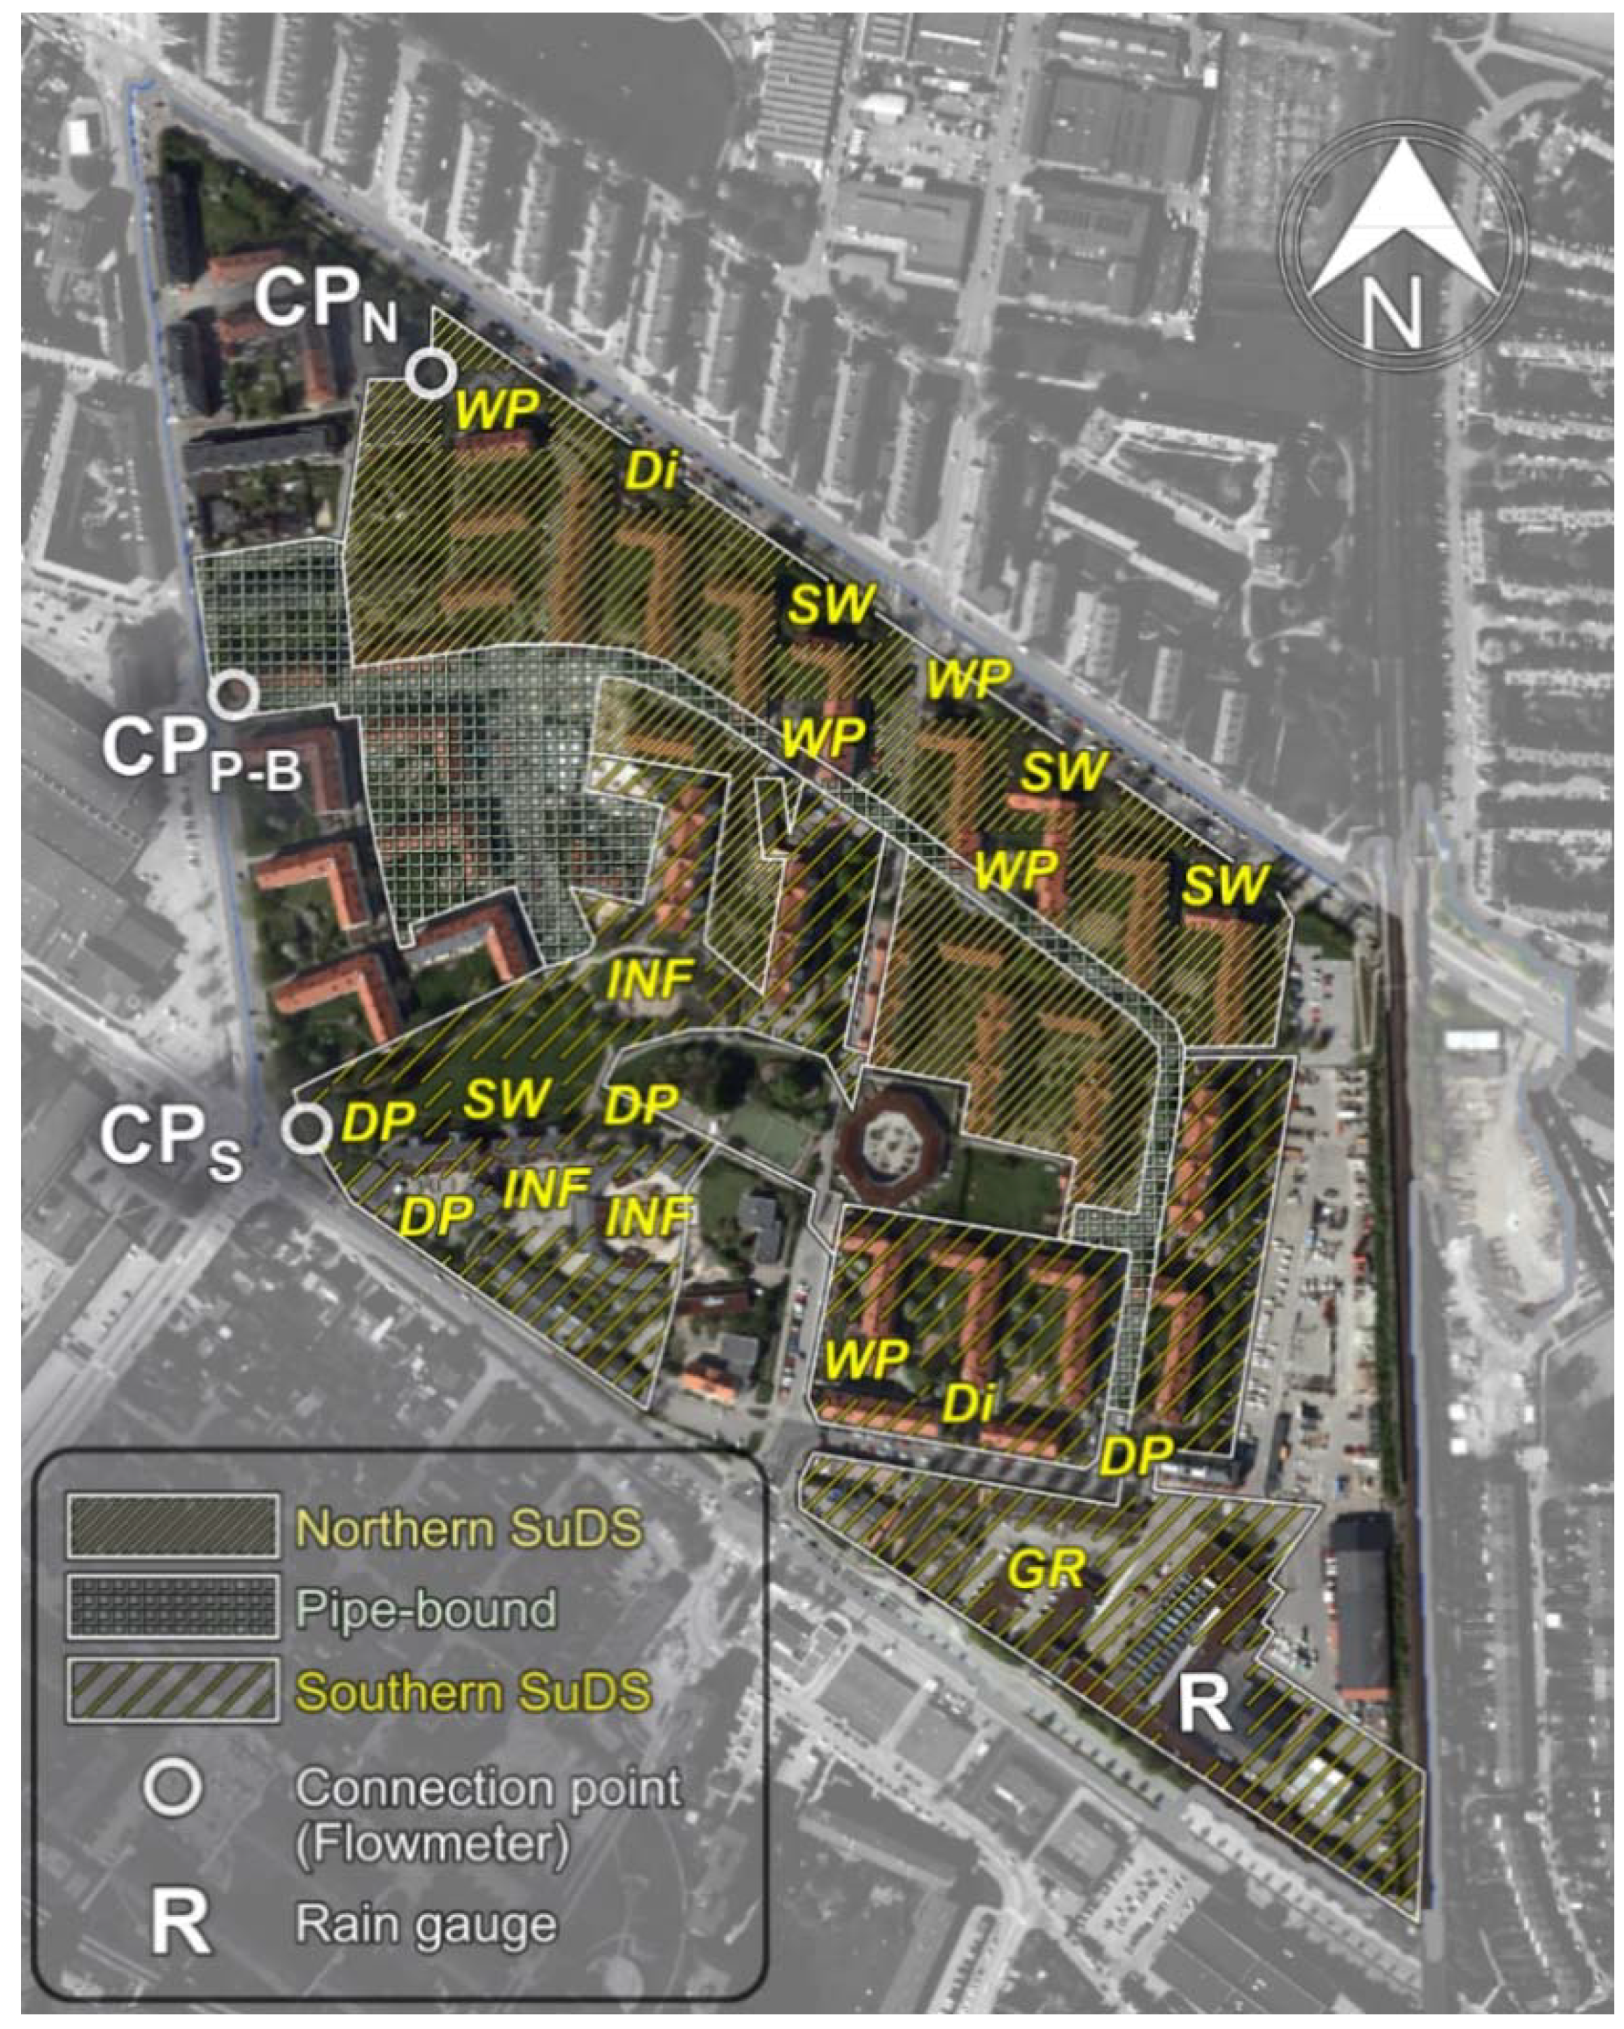
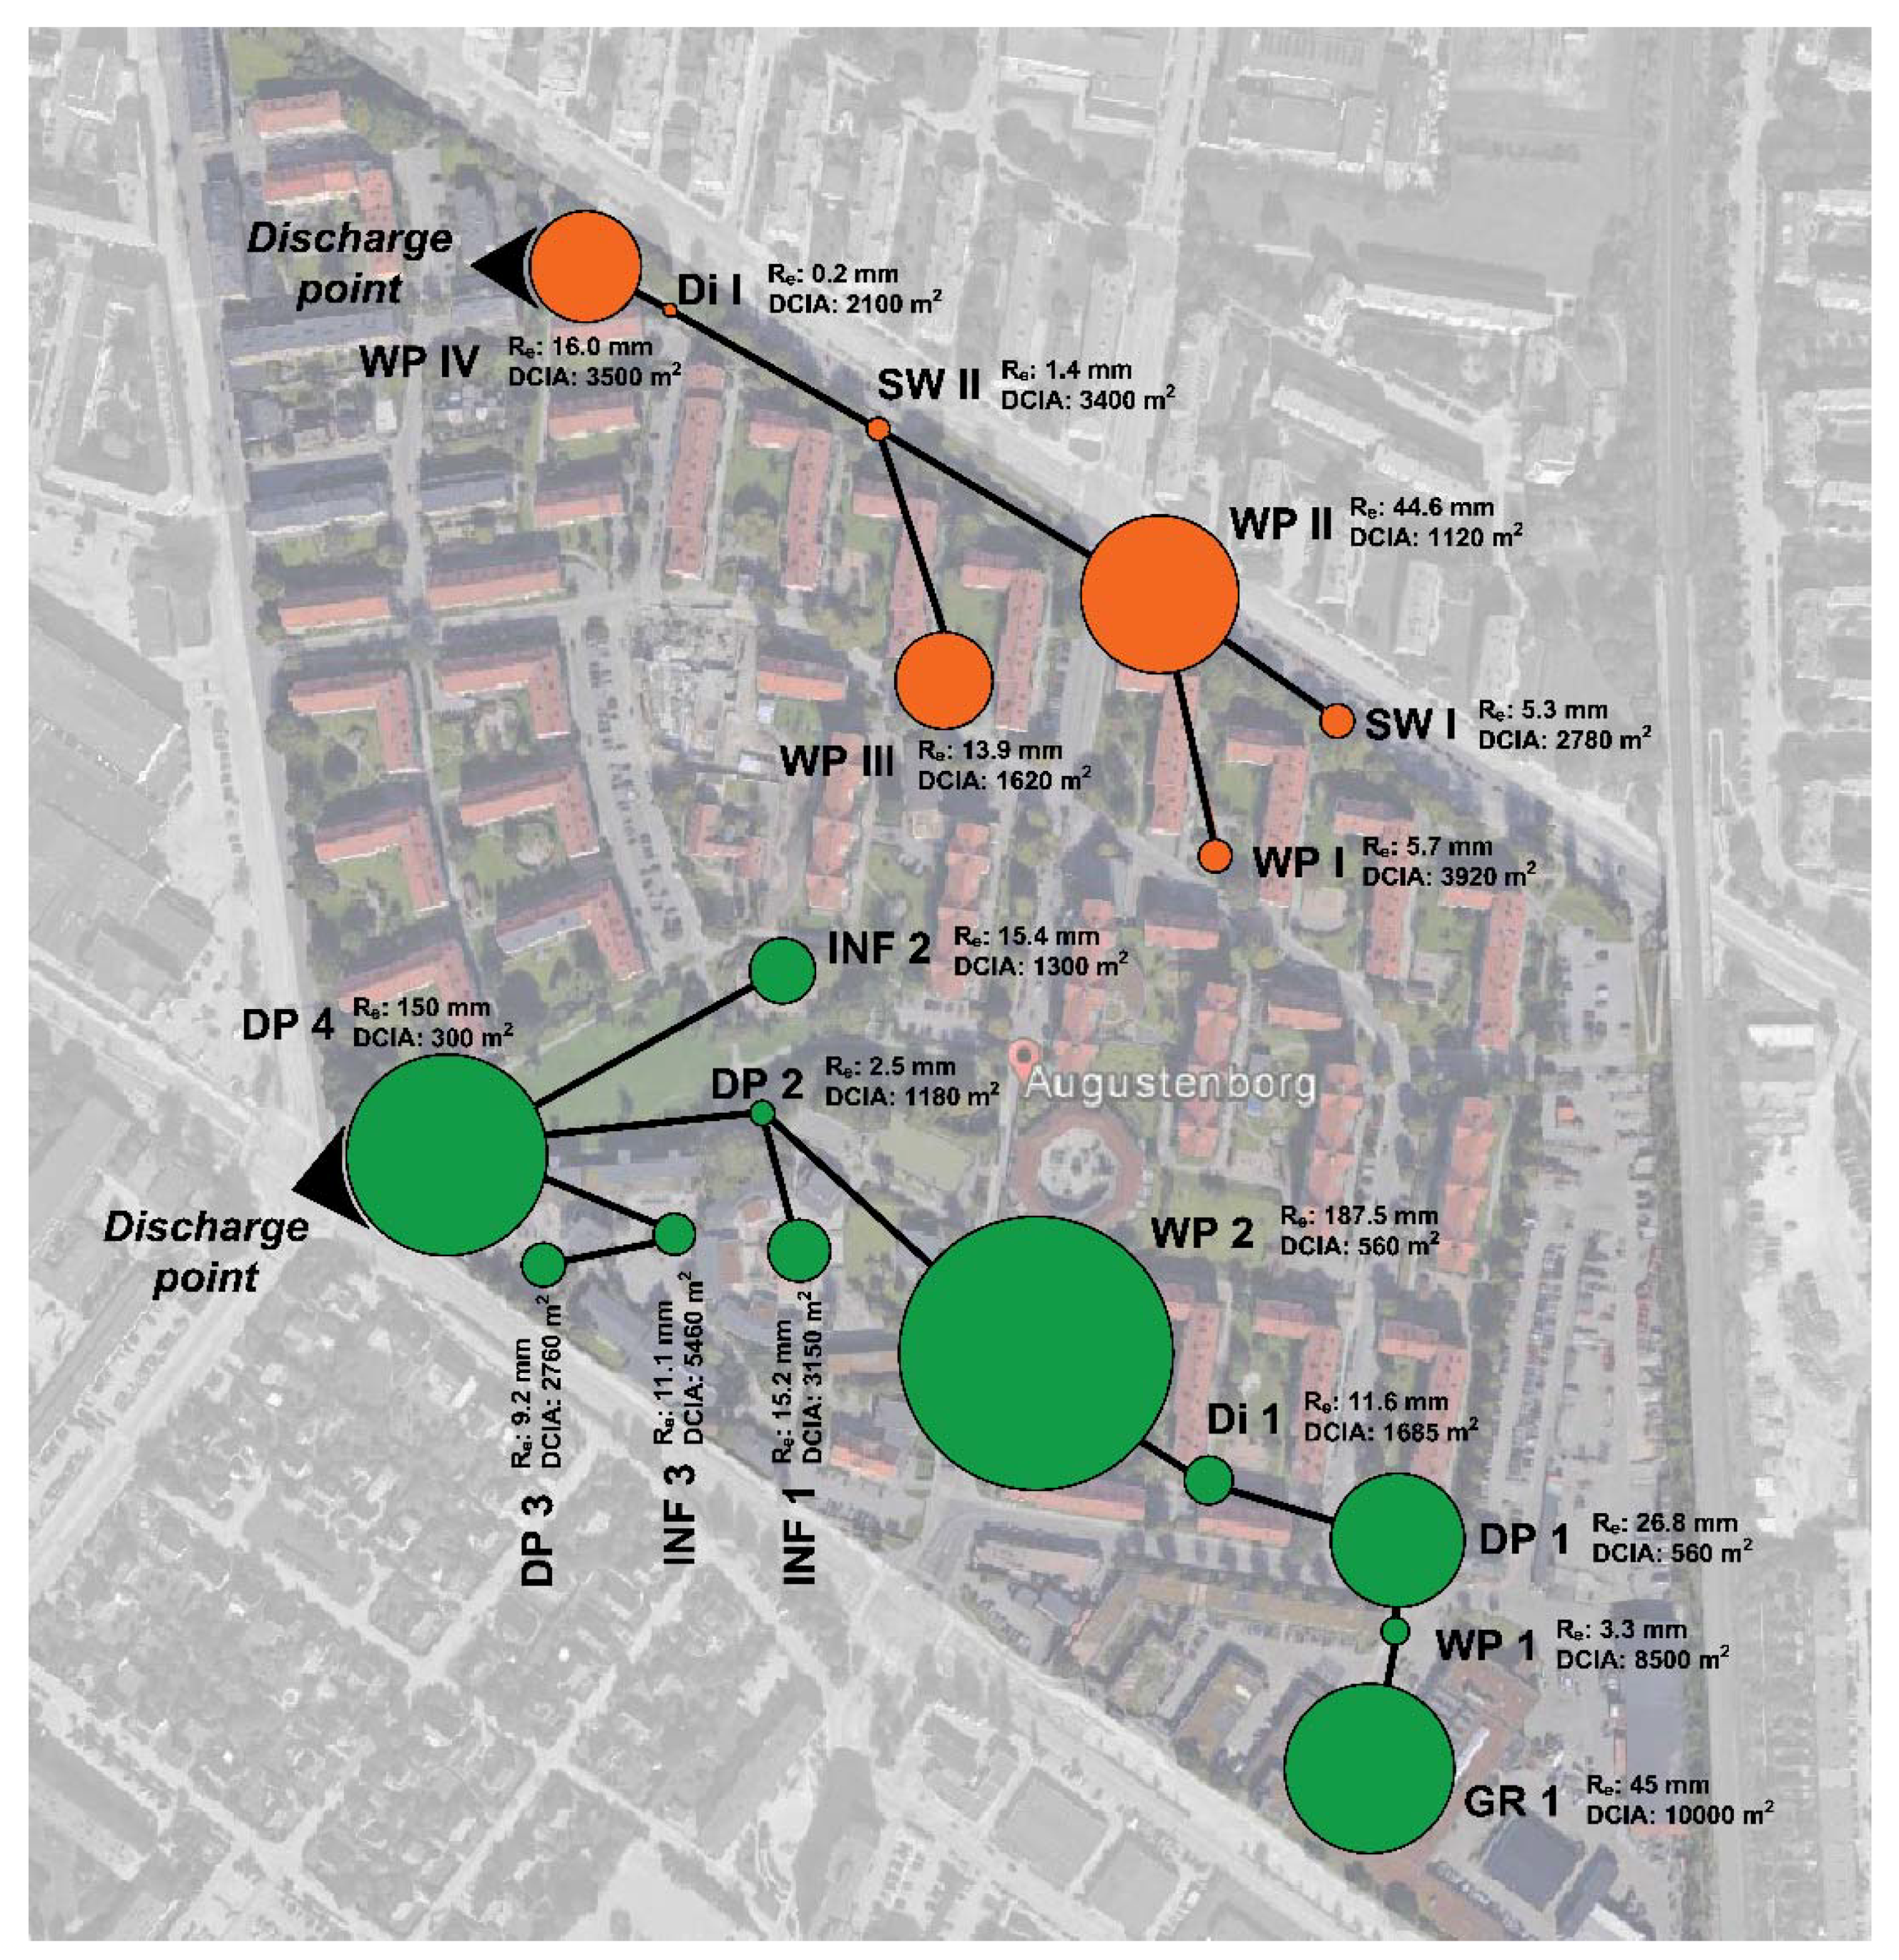
The Augustenborg area, which is shown in Figure 2, handles the storm water runoff through three different systems with each serving its unique catchment; i.e., the pipe-system (3.5 ha), the Northern SuDS (6.3 ha), and the Southern SuDS (9.5 ha). Figure 2 also shows the location of the flow and rainfall monitoring points as well as the systems’ connection points to the municipal wastewater collection network of Malmö.
Catchments in all three stormwater subsystems consist of various types of surfaces such as tile roofs, green roofs, asphalt surfaces, concrete surfaces, grass, and sand covered areas. A Geographical Information System (GIS) analysis of different land uses in each of the subsystems in Augustenborg, using orthophotos of the area, shows that about 50% of the catchment in both Northern and Southern SuDS is occupied by surfaces assumed to be impervious from an engineering point of view (i.e., tile roofs, asphalt, and concrete) while the corresponding value in the pipe-bound catchment is above 70%. Green roofs make up a considerable part in the Southern SuDS (about 11%) while it is almost negligible in the pipe-bound catchment as well as the Northern SuDS. A schematic representation of different land uses in the area are presented in Table 1. The numbers are based on a GIS-analysis of the land use and the digital elevation model (DEM) of Augustenborg by Nordlöf [21].
Different types of the implemented SCMs in the Northern and Southern SuDS are shown in Figure 2. The Northern SuDS consists of a major flow-path of swales and a stormwater ditch to which some stormwater ponds are also connected. Outflow from the Northern systems occurs in the form of overflow from the final pond (Figure 2 (CPN)). In contrast, the Southern SuDS includes several relatively large retention ponds (with larger areas/freeboards) with a considerable area of green roofs at the most upstream parts of the catchment (Figure 2 (GR)). Outflow from the Southern SuDS is the result of overflow from the final pond in the system (Figure 2 (CPS)). Some photos of the SCMs in Augustenborg are presented in Appendix A.
2.2. On-Site Measurements
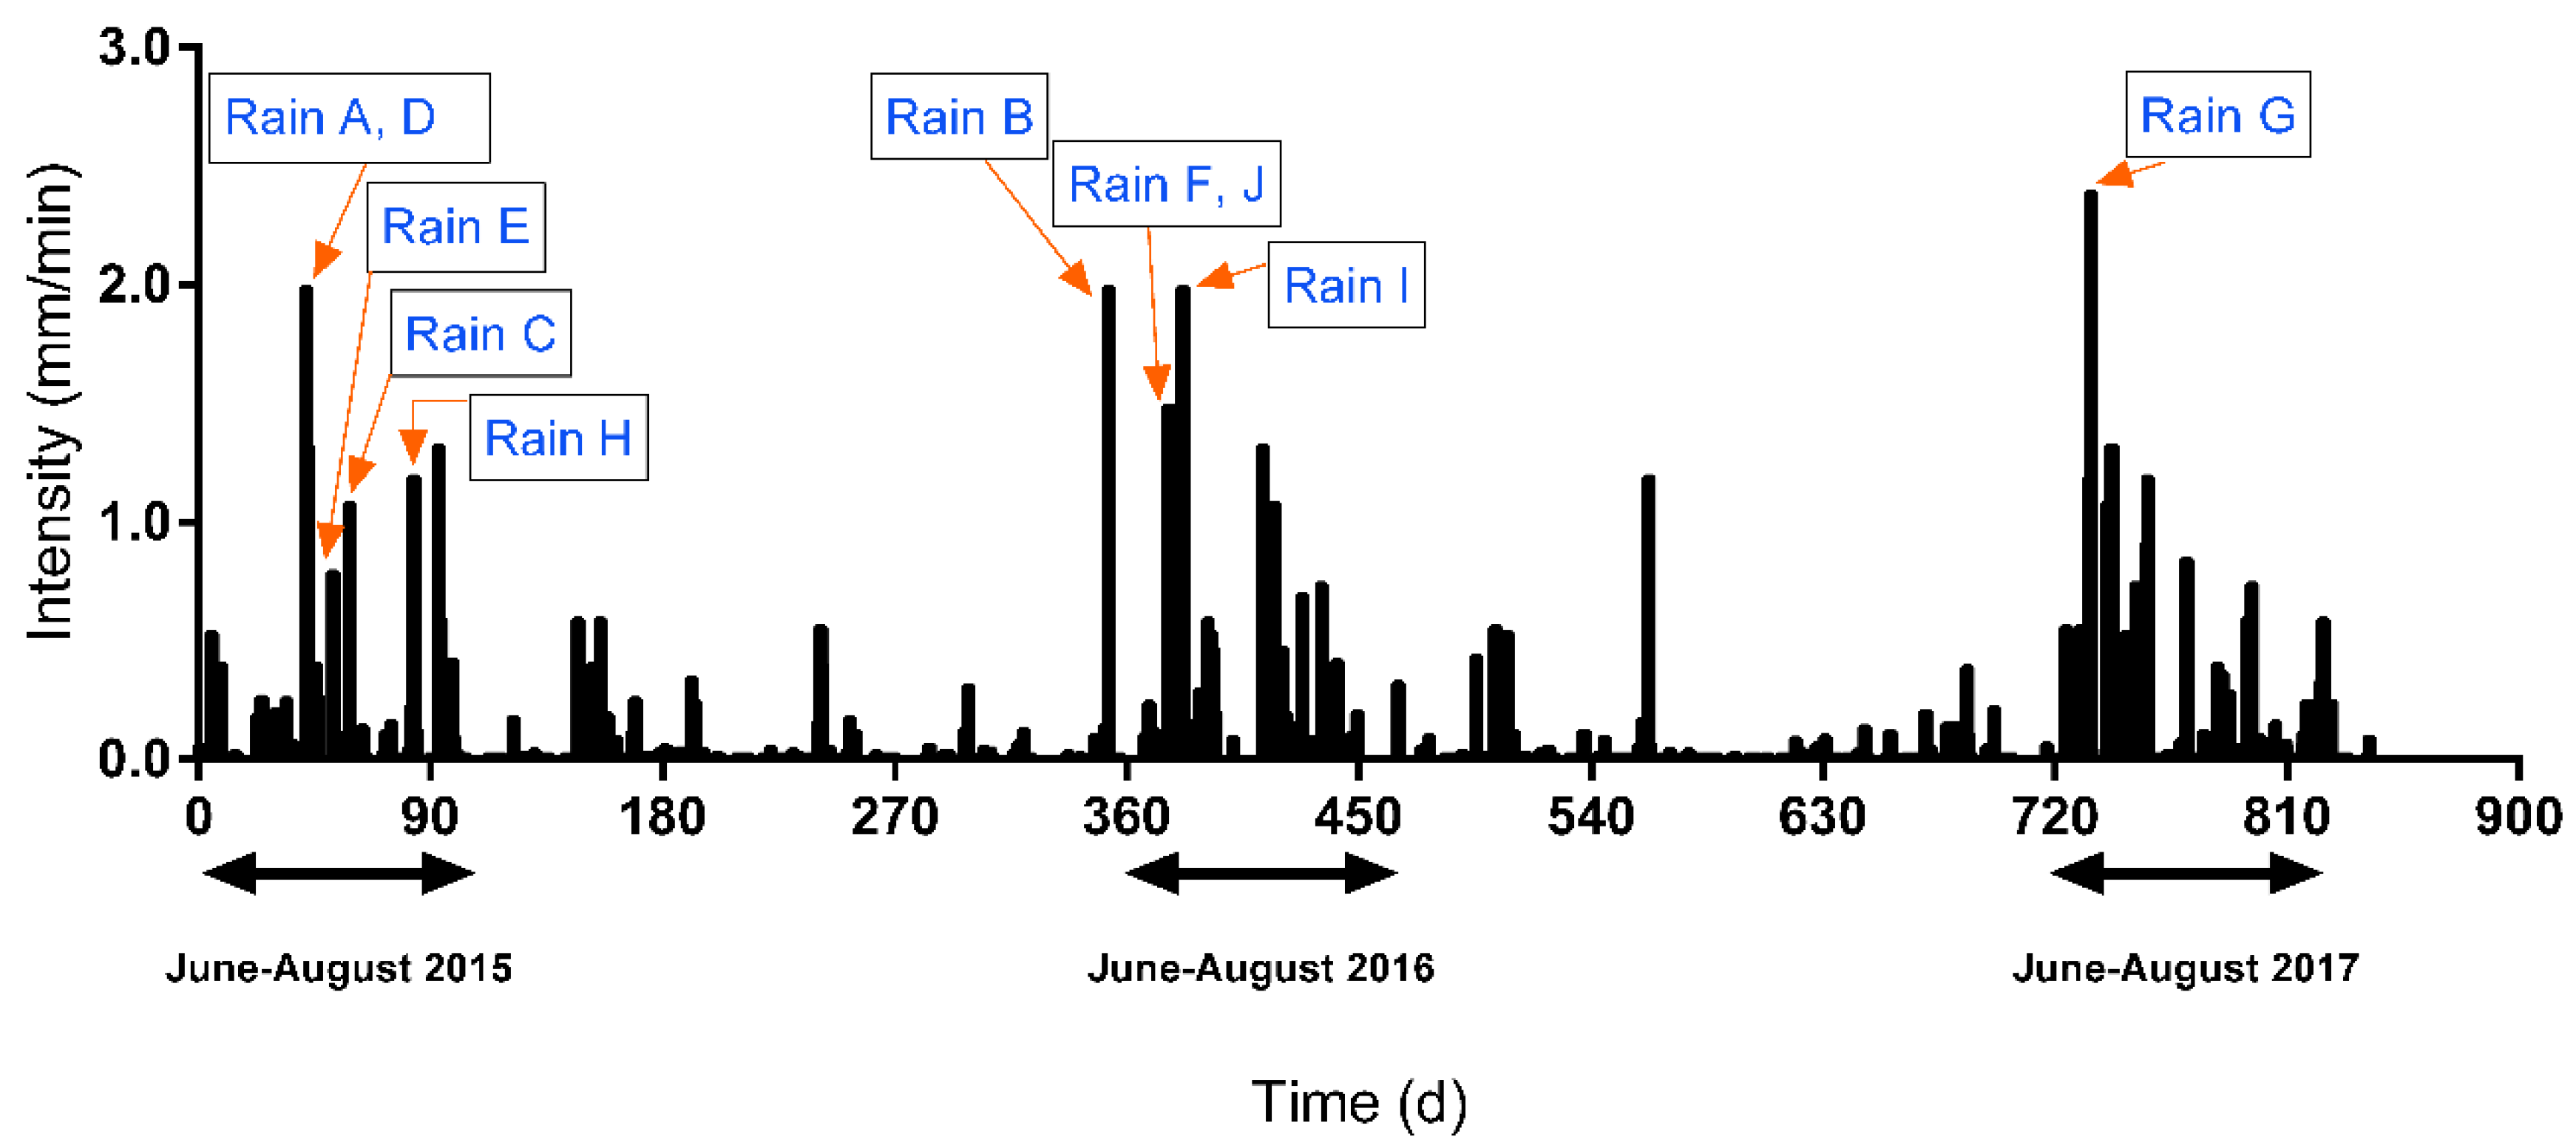
Discharges from the sub-catchments were monitored and logged at connection points (marked as CP in Figure 2). The flow was measured using Mainstream Portable AV-Flowmeters with velocity and level sensors. Flow-monitoring was carried out for a period of over two years, which is shown in Figure 3. A total of 10 rainfall events (denoted A–J) with reliable corresponding flow measurements were selected. The selected rainfalls were all volumetrically considered, which means that they led to a discharge from at least one of the SuDS in Augustenborg. As seen in Figure 3, all selected rainfalls belong to the period of May–August during which most intense rainfalls were observed. Details of the selected rainfall events are shown in Table 2. The rainfall was monitored and logged by a Casella CEL tipping bucket rain gauge with 0.2 mm resolution, which was installed at the south-east part of the area.
2.3. Runoff-Equivalent Impervious Area
The parts of the impervious surfaces in a catchment that are hydraulically connected to the drainage network within the context of pipe-systems are known as directly connected to an impervious area (DCIA) [22]. DCIA is often regarded as an effective impervious area (EIA) in an interchangeable manner [22,23,24], which implies that the effectiveness of the surfaces from a runoff contribution point of view is reflected in DCIA. DCIA has widely been employed to understand the rainfall-runoff patterns in urban basins. Lee and Heaney [25] report that connectedness of the impervious area has the most noticeable effect on urban hydrology. It has also been shown that mild changes of imperviousness are reflected as amplified runoff responses. For instance, grass areas contribute to runoff as soon as rain intensity exceeds the infiltration rate [22]. It is also important to consider that the routed runoff from ineffective impervious areas onto the pervious surfaces would lead to rapid consumption of percolation capacity, which makes the previous surface react as impervious [26]. The generated runoff under such scenarios is then not only contributed by DCIA, but also other types of impervious and pervious surfaces start to contribute.
Using the same indicators for functionality of various types of stormwater handling systems makes it easy to compare and understand the role of these systems in urban runoff management. While DCIA can be quantified through GIS maps of high spatial resolution as well as intensive in-situ assessment of the catchment connected to the pipe network [27], it is not convenient to apply the same method to SuDS since the boundaries between the “catchment” and the “system” cannot be clearly drawn in case of SuDS. Therefore, a lumped parameter representing the runoff-equivalent impervious area (REIA) is introduced in this paper to explain the activeness of the surfaces. This parameter, REIA, is the equivalent surface area with 100% contribution to runoff, which is calculated based on the observed accumulated outflow from systems. It should be noted that REIA and DCIA could be identical parameters in case of pipe-bound conventional drainage systems. The difference between these two parameters lies in their conceptual definitions through which REIA could be used for evaluating the efficiency of SuDS as alternative solutions for urban runoff management and is estimated using Equation (1).
in which REIA is expressed in m2, Vout is the total volume of the observed runoff outflow at the most downstream point (m3), and R is the rainfall depth (m). Total runoff volume was measured until the discharge was either zero or reached a minimum before the subsequent rainfall. The ratio between the observed REIA and the GIS-based quantified total impervious area (TIA) is then considered as the contribution coefficient of the system (Equation (2)).
3. Results and Discussion
3.1. Development of the Conceptual Model
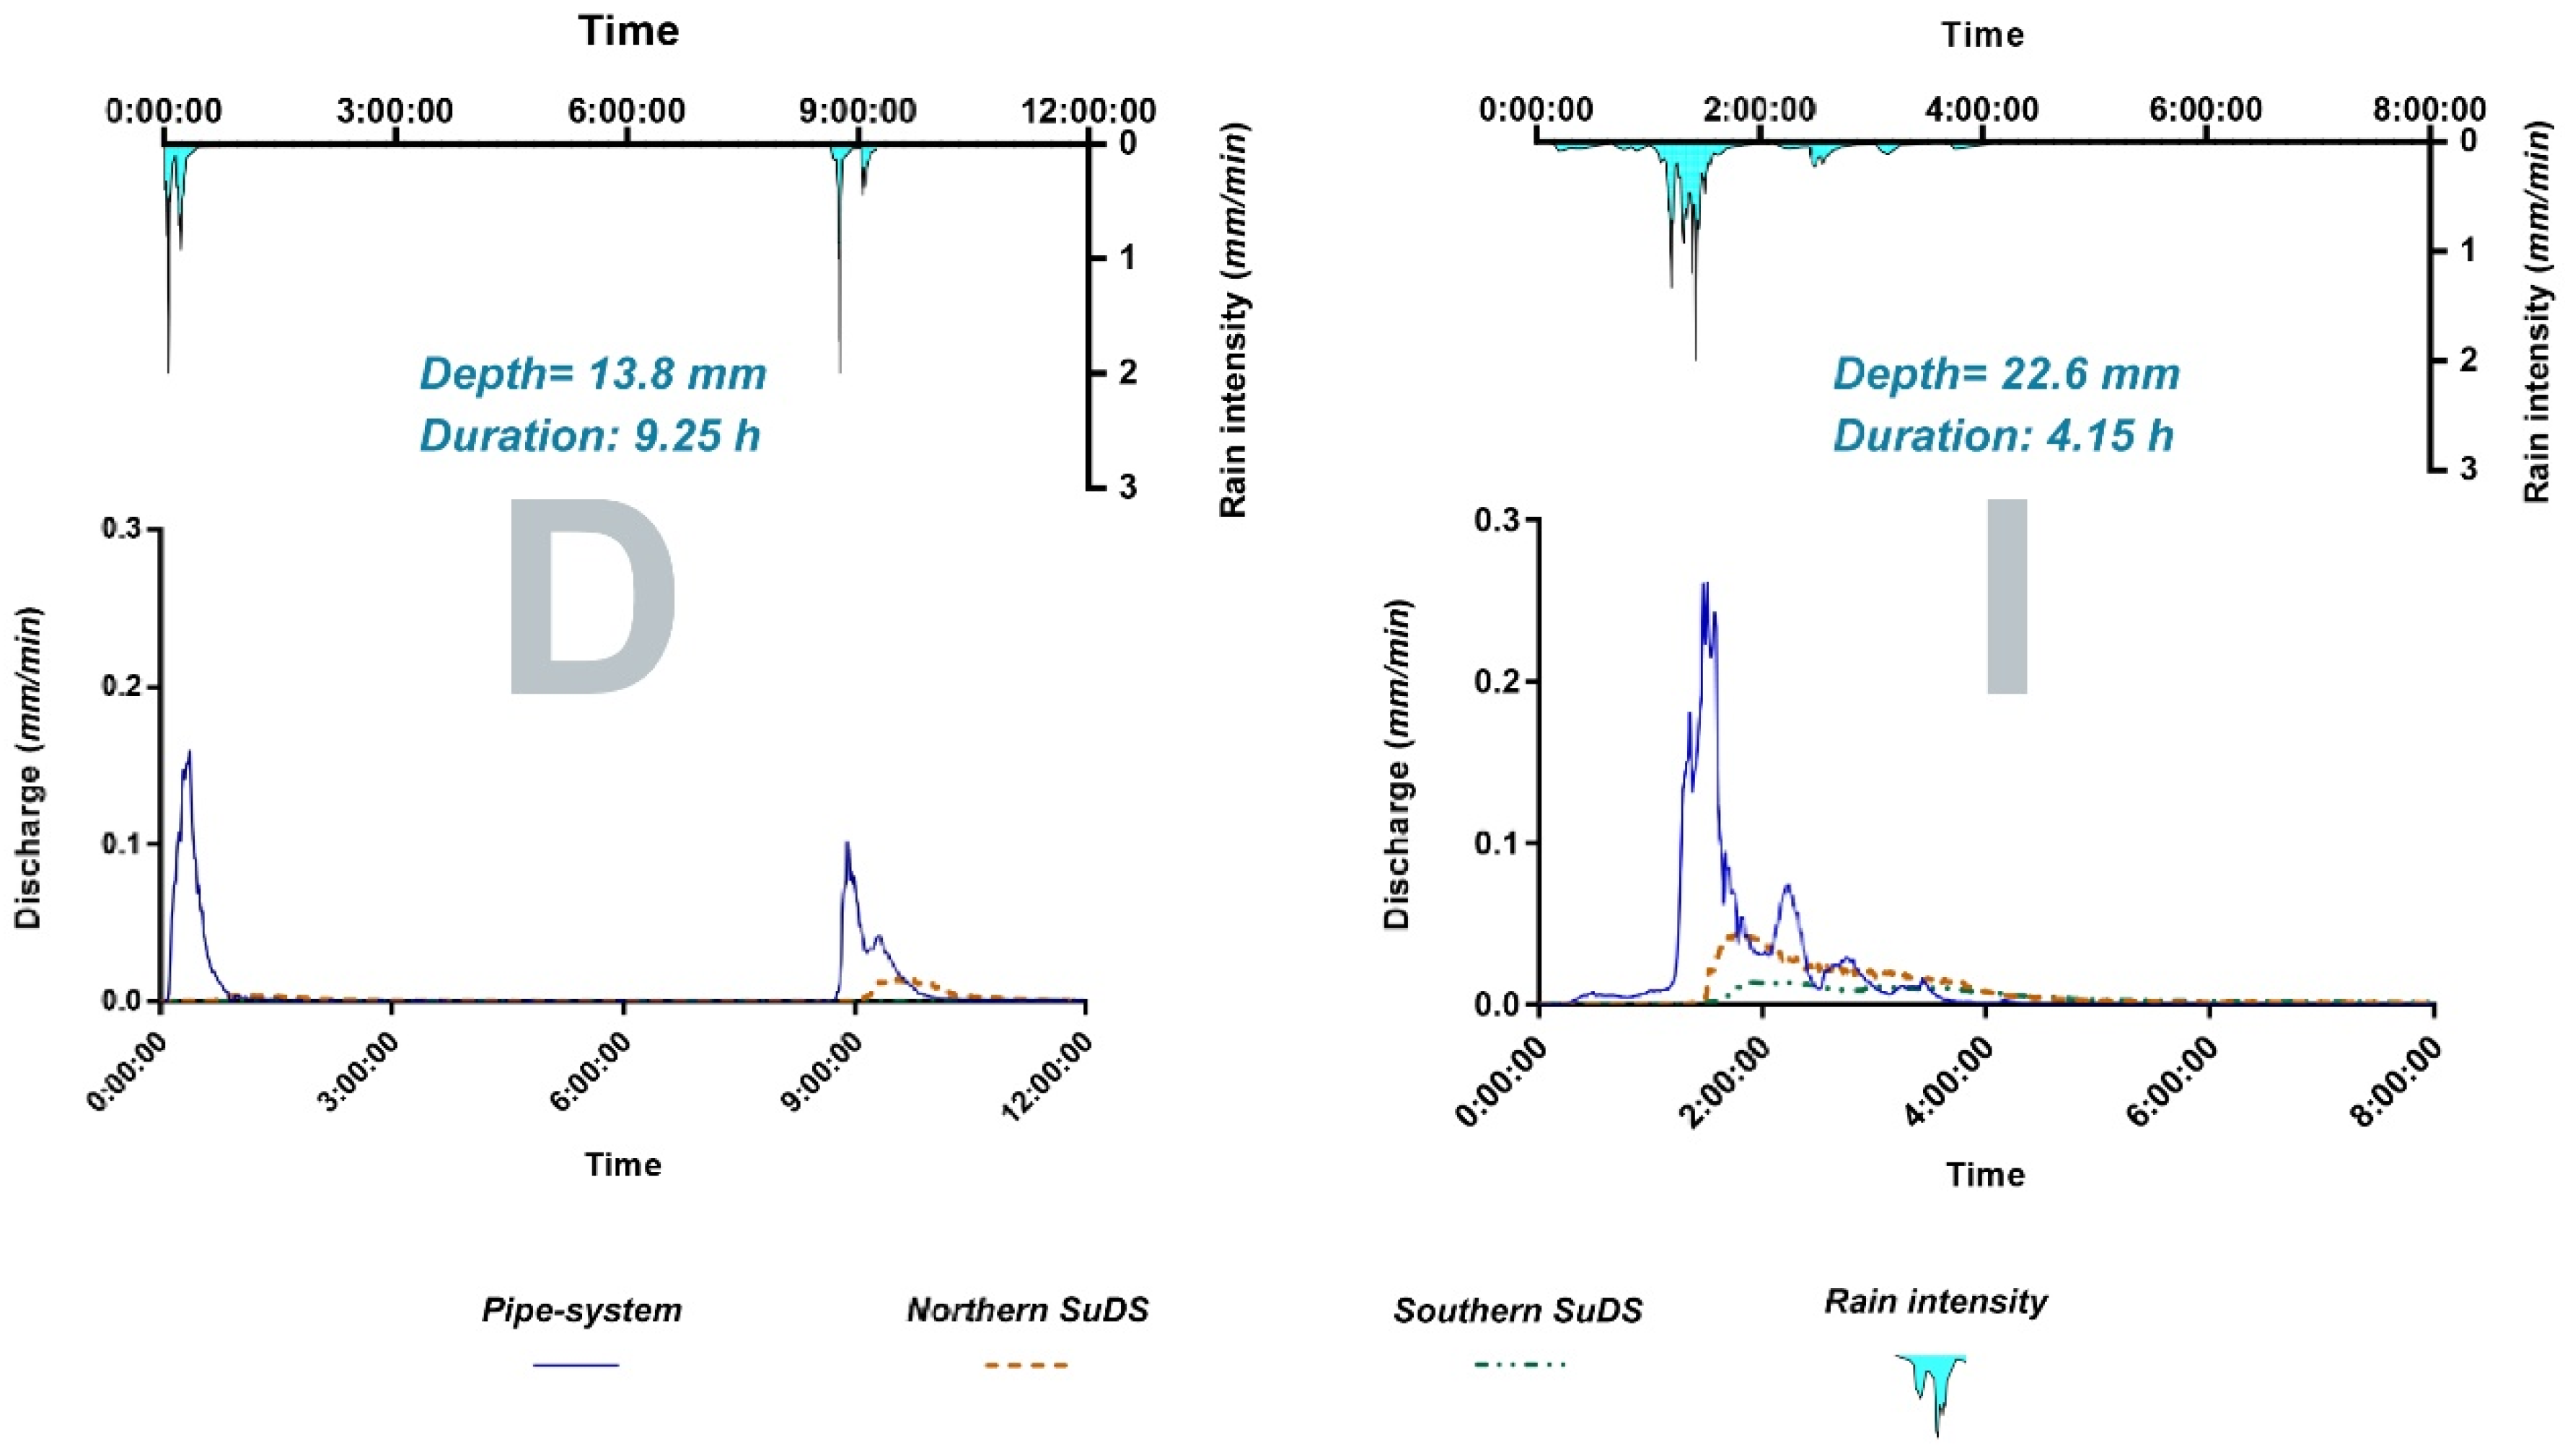
All 10 rainfall-runoff datasets (hyetographs and hydrographs) included in this study are provided as supplementary material. Figure 4 shows two examples of the observed rainfall-runoff events. Rainfall I (Figure 4(I)) is the most intensive rainfall event with a recurrence interval of about two years according to Dahlström (2010) [28]. It has one peak with a large depth that leads to discharges from both the Northern and the Southern SuDS. Rainfall D (Figure 4(D)), however, consists of two peaks while the discharge occurs only from the Northern SuDS and only in connection to the second peak.
Analysis of the hydrographs, which are the normalized outflows against the total catchment area, shows that the pipe system is very sensitive to rain peaks even in smaller magnitudes. In other words, there is always an observed peak in the hydrograph, which corresponds to a certain peak monitored in the rain pattern (see Figure 4(D) and Figure 4(I)). The correlation between the rain intensity and the outflow from the pipe-system indicates that pipe-systems are flow oriented and should be designed in accordance with flow capacity. In contrast to the pipe-system, the outflow from SuDS is observed to be a function of the rainfall depth rather than rainfall intensity. For instance, as seen in Figure 4(D), outflow from the Northern SuDS occurs in connection with the second peak observed at about 8 h 45 min after the start of the event while there is no outflow from the system at the first peak in the rain (at about 30 min after the start of the event). This means that the first part of the rainfall (60 min from the start, depth = 8 mm) is retained in the SuDS and to some extent fills the existing capacity while the second peak, although lower (depth = 6 mm), exceeds the threshold and initiates an outflow from the Northern SuDS.
The monitored hydrographs indicate an almost negligible delay in the flow initiation in the pipe network followed by relatively shorter lag times, i.e., 5–20 min depending on the rainfall pattern. The observed lag time for Northern SuDS and Southern SuDS was found to be about 20–100 min and 90–190 min, respectively.
The observed range of accumulated rainfall required for the initiation of runoff in the pipe system is found to be 0.8 mm to 2.2 mm, which aligns with findings of Albrecht [29] who reported a runoff initiation threshold of 0.8 mm to 2.3 mm for cool and hot weather, respectively. The almost immediate initiation of flow in the pipe system can be an indication that the major part of the flow is contributed by the DCIA, which lies close to the measurement point. In contrast to the pipe system, the small contribution coefficient in the catchments with SuDS (see Table 2) agrees well with the observed long periods of delay in the flow initiation, which is an indication of larger retention capacity of the SuDS catchments.
The larger retention capacity in the SuDS can be accredited to storage, evapotranspiration, and direct and indirect infiltration. The term indirect infiltration is assigned to the infiltration that takes place when the runoff from impervious surfaces is diverted to pervious surfaces for infiltration. In contrast, direct infiltration is when the rain falls on a pervious surface and is infiltrated directly.
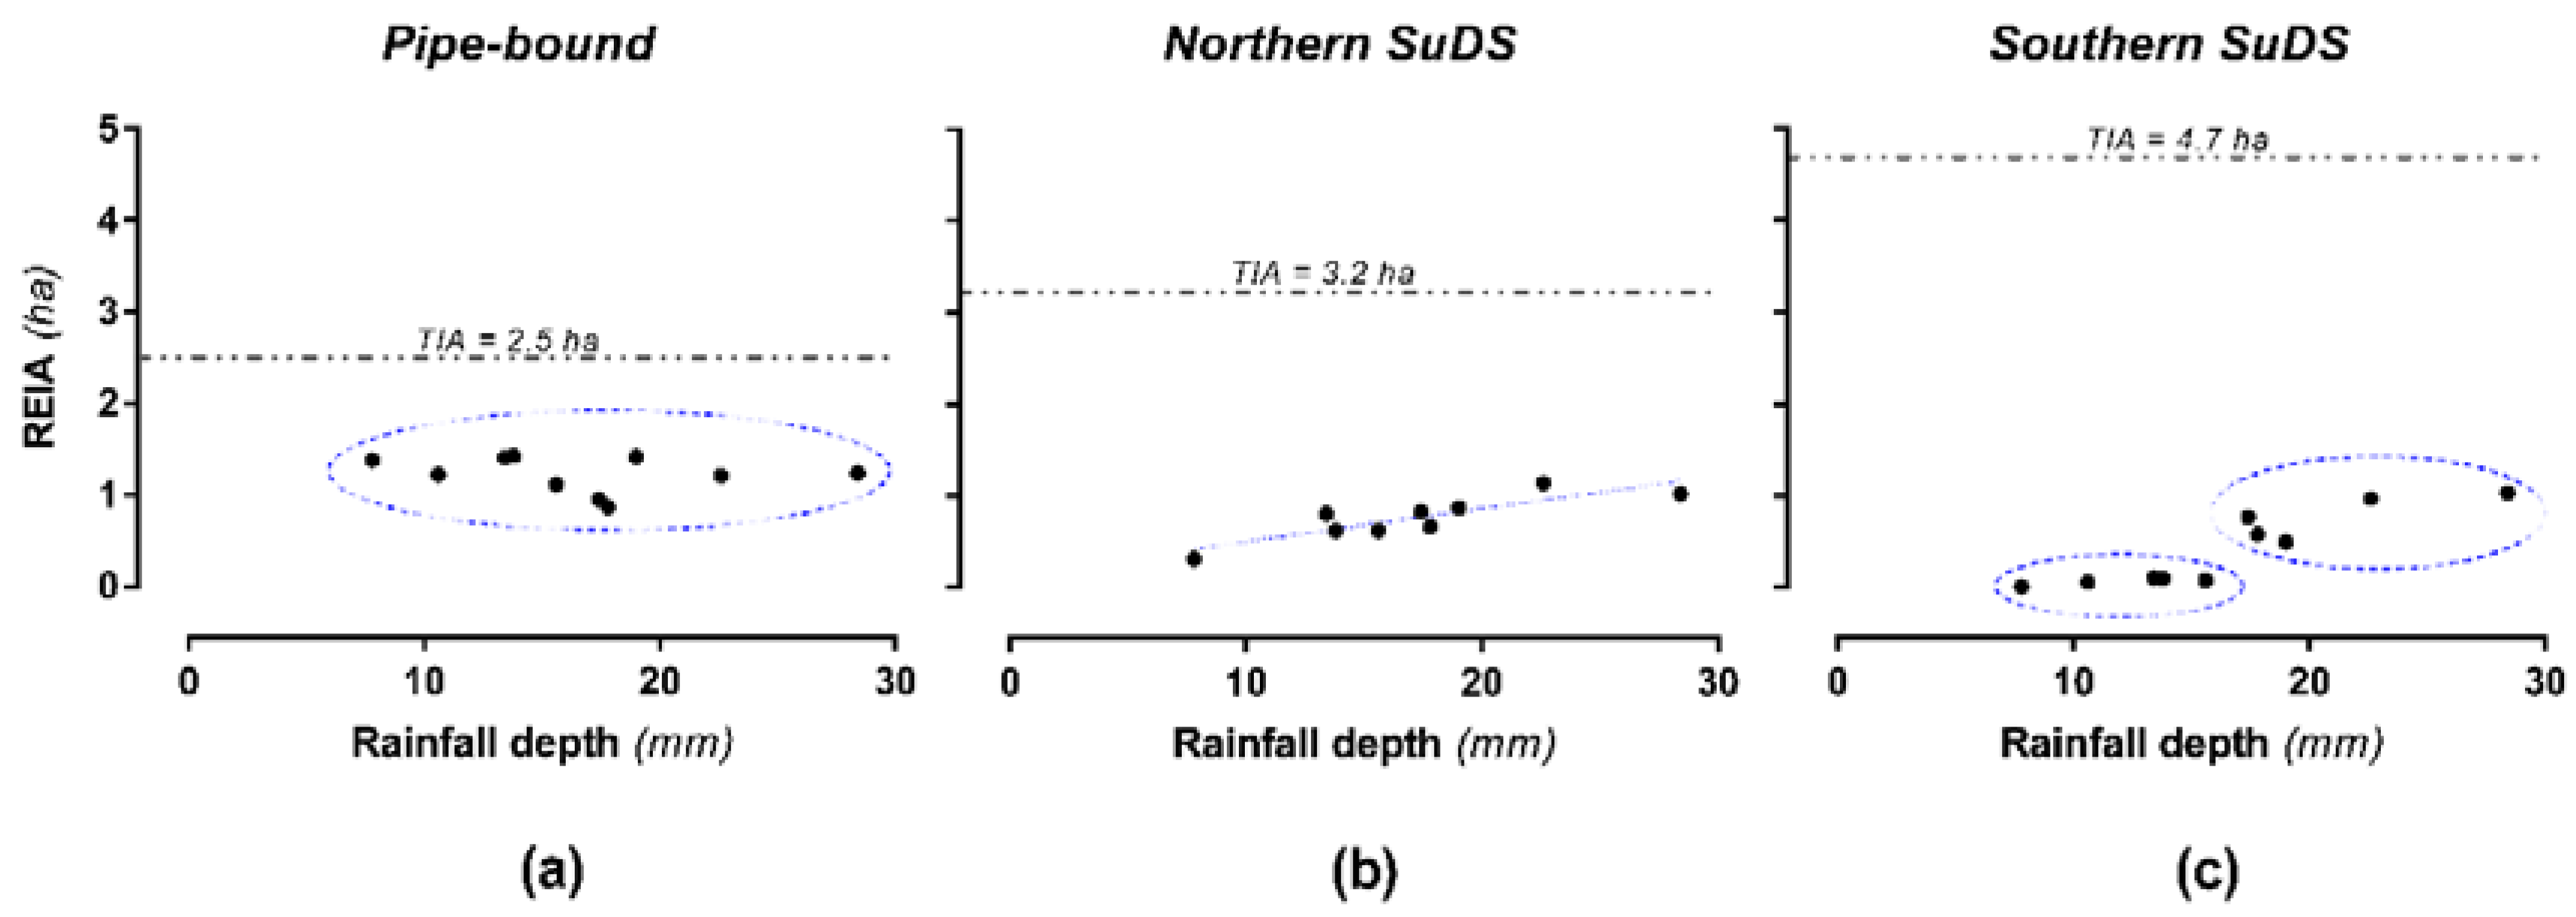
Table 2 summarizes the total discharge volumes (Vout) and their corresponding contribution coefficients for the catchments in Augustenborg for 10 rainfall events were monitored for two years. Figure 5 presents the graphical illustration of the calculated REIA values for the subsystems in Augustenborg. As observed in Table 2, the contribution coefficient for the catchment with pipe-system is about 50% (i.e., 0.48 ± 0.08%) of the TIA. This is in agreement with the published literature in which the proportion of contributing surfaces (also regarded as EIA) is reported to vary from 14% to 60% depending on the physical characteristics of the catchment such as slopes, gutters, curbs, and more [30,31,32,33].
The contribution coefficient is considerably lower in the catchments with SuDS implementations (varying values) but note that the two SuDS (Northern and Southern) differ with respect to how they react under different rain depths. The REIA in the Northern SuDS tends to increase gradually when the rainfall depth increases (Figure 5b) while, in the Southern SuDS, the REIA is generated first when the rainfall depth exceeds a larger threshold of about 17 mm (Figure 5c). It was also observed that the outflow from the SuDS in Augustenborg is not only levelled out and flat (no intensive peaks as seen in Figure 4) but is also much smaller in accumulative volume when compared to the pipe system (compare the contribution coefficients given in Table 2). This implies that the retention capacity including surface storage, infiltration and evapotranspiration in catchments with SuDS in Augustenborg is higher than the pipe-bound catchment.
The observed gradual increase in the REIA for the Northern SuDS (REIA from 0.3 ha to 1.1 ha corresponds to rainfall depths of 8 mm to 23 mm, which is shown in Figure 5b) means that the contributing proportion of the catchment grows as the rainfall depth increases. The corresponding projection of this observation in the field could be considered if the system is constituted of a network of several small disaggregated (discrete) individual mini catchments with each having a certain retention volume. These discrete mini catchments are filled gradually as the rainfall depth grows. Wventually, when their threshold is exceeded, overflow to the corresponding immediate downstream mini catchment. Accordingly, if the rainfall depth is large enough, the number of connected mini catchments increases and the accumulated overflows might finally contribute to the final discharge from the system.
The same conceptual model is also valid for the REIA trend observed for the Southern SuDS. As seen in Figure 5c and Table 2, the calculated REIA is almost negligible for rainfall depths up to about 16 mm while a dramatic increase is observed in the case of 17 mm of rainfall. The same concept presented above (discrete mini catchments) explains the observed phenomenon. A possible explanation for this very abrupt alteration in behavior (sudden jump in REIA from 16 mm to 17 mm of rainfall) could be associated with the relatively large retention volume at the most downstream part of the Southern SuDS (see Figure A1(DP 4)). Another possible explanation could be that some other mini catchments further upstream join the rest of the system when a threshold is exceeded. Both hypotheses could generate a relatively large outflow volume considering the possible connectedness of the catchment at that stage after the initial 16 mm has filled up the capacity up to the system’s threshold. However, application of the concept to the systems in Augustenborg could possibly reveal what hypothesis is a valid explanation for the observed phenomenon.
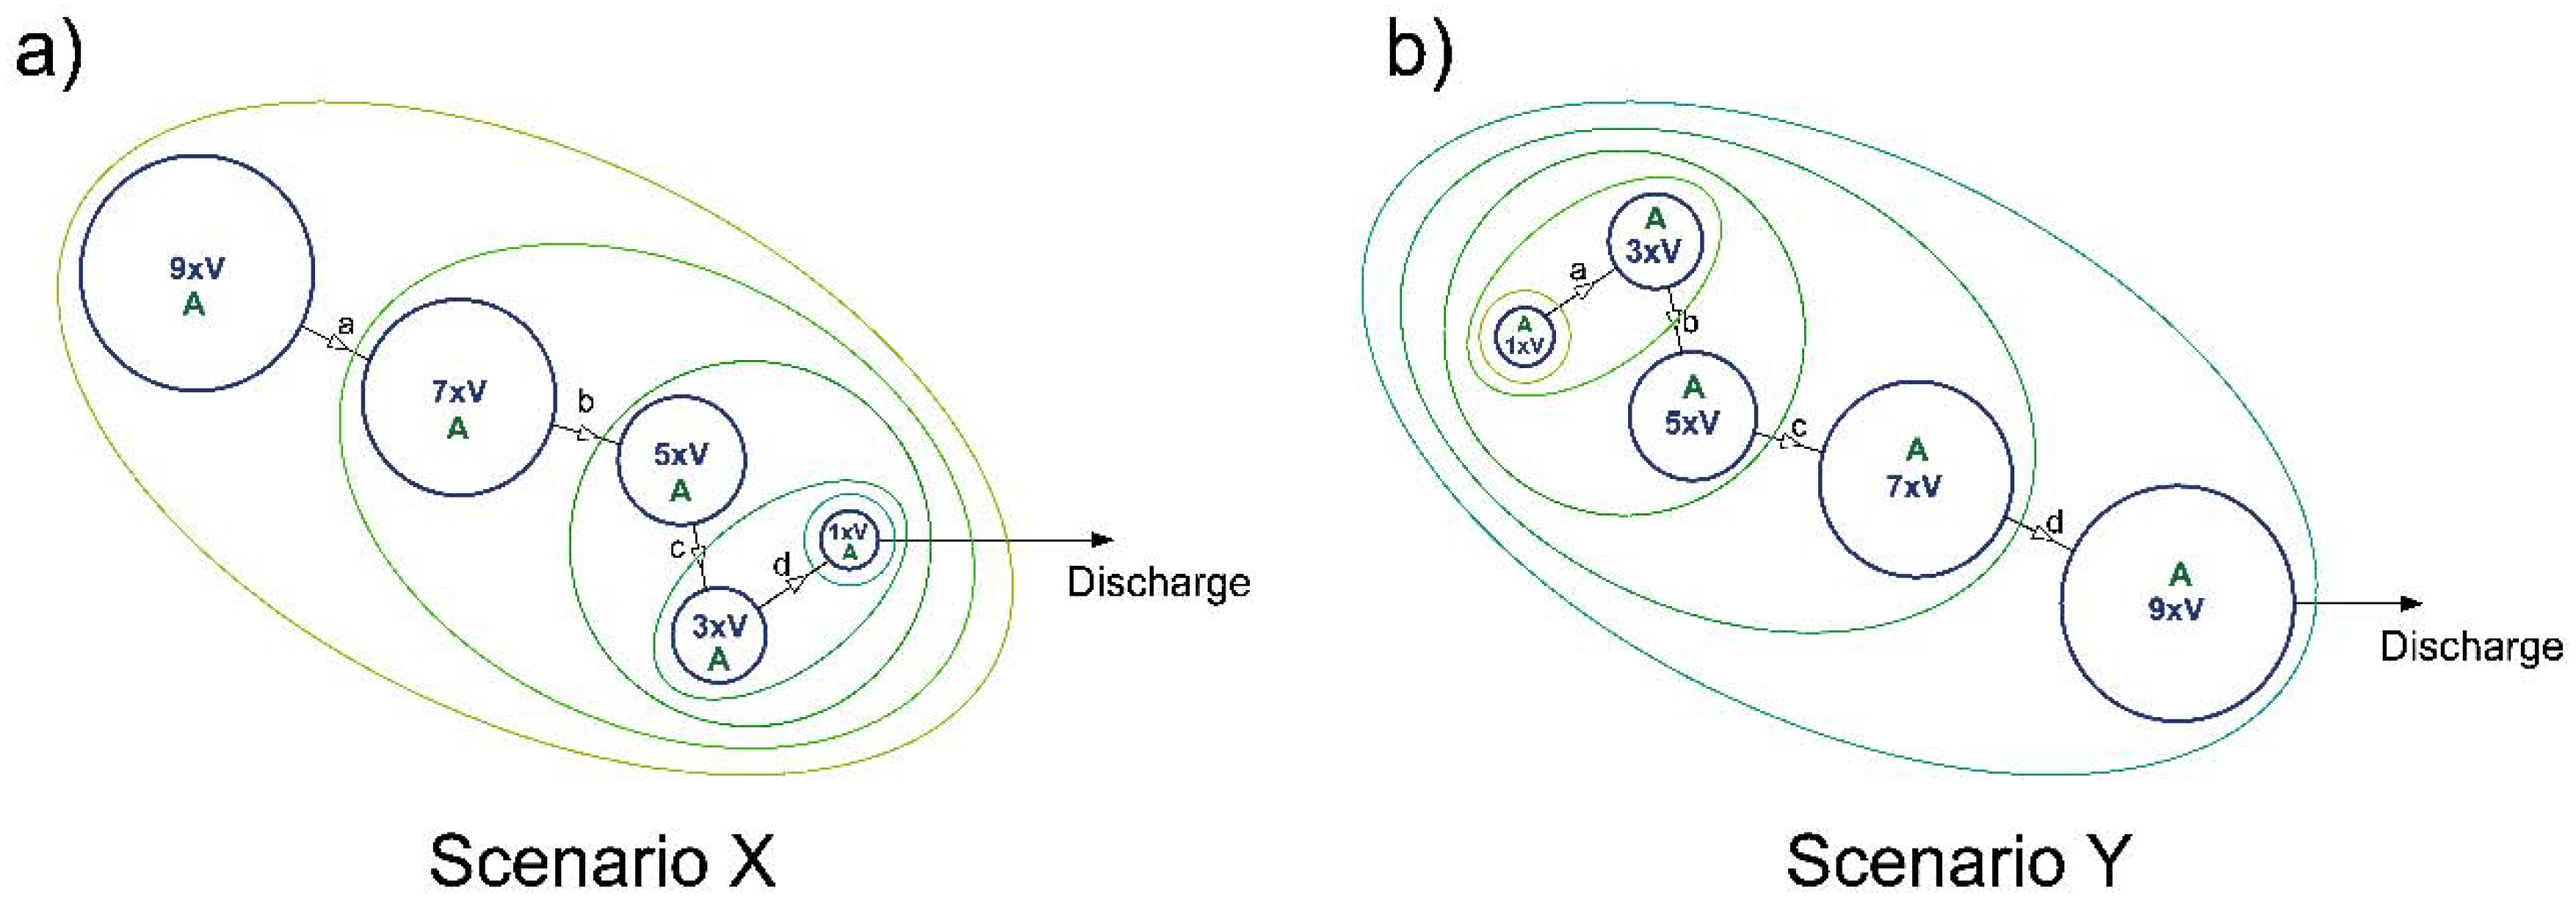
A schematic illustration of the conceptual model is presented in Figure 6. In this illustration, five retention cells (SCMs) with each having a connected mini catchment area = A are presented. The constant connected area, A, for each SCM is assumed to promote the comprehensibility of the conceptual model. Each of these SCMs has a certain retention capacity as different multiples of an assumed unit capacity (i.e., V [mm]). The retention capacity of each SCM is reflected in the size of the schematic circles in Figure 6. As evident in Figure 6, both illustrated models have identical total retention capacity (=25 × V), but the circumstances under which a discharge is initiated from the systems depend on the spatial distribution of the mini catchments with respect to their retention capacity. It is important to note that retention capacity, V, in this context is considered the sum of surface storage, retention, and losses in the form of infiltration and evapotranspiration.
Figure 6a (Scenario X) is comparable to Northern SuDS in Augustenborg. The mini catchments with smaller retention capacities are placed close to the discharge point. A consequence of this configuration is that a discharge from the system will be observed as soon as the most downstream mini catchment (1 × V) is saturated in capacity, which is when the rain depth exceeds 1 × V. As the rainfall depth continues to increase, more mini catchments are connected to each other and contribute more to the final discharge. The growth direction of the contributing catchments in this case is downstream-to-upstream, i.e., links are activated from d towards a (Table 3).
In Figure 6b (Scenario Y), comparable to the situation in Southern SuDS, the final discharge would not flow out unless a certain rain depth is obtained. In the specific example, the outflow from the model presented as Scenario Y is initiated when a rainfall larger than 5 × V mm is applied on the system while all rainfalls up to 5 × V mm would result in higher connectedness of the system without any downstream discharges. In this type of setup, the connectedness of the system propagates from the upstream towards the downstream, i.e., links are activated from a towards d (Table 3).
In the presented conceptual model, if a longer lag time is desired for the system, it is more beneficial that the SCMs with higher retention or retention capacity are placed downstream.
Additionally, relatively smaller volumes of discharge can also be expected for rainfalls up to a certain magnitude (see the data for rainfall 6 × V in Table 3). These advantages become especially important and effective when the final recipient for the SuDS is the municipal sewer system, which is the case in Augustenborg. In the municipal sewer system, the bought time in terms of longer lag times may be enough for the receiving pipe-bound stormwater network to maintain some pressure relief.
Figure 6 along with Table 3 illustrate the basic concept behind the functionality and behavior of SuDS in a full-scale urban catchment by demonstrating two straightforward examples under simplified circumstances in which connectedness grows along a single pathway. Basically, the SCMs can be visualized as a flow train of interconnected bowls with physical properties that, at least from theoretical point of view, should be quantifiable. Once the properties have been determined, the functionality of the flow train is set.
However, in contrast with the unique setups of the concept (Figure 6), each SCM in a real implementation of mesoscale SuDS is assigned to a specific mini catchment varying in area and characteristics. In addition to the local retention depth available storage depth in the freeboard, storage depth in the infiltration layer, in the SCM, the area of the connected catchment is also important in the overall retention performance of the SCM. It is also assumed that the effect of evapotranspiration is negligible in case of short term individual rainfall events. Therefore, it is excluded from the model. Consequently, in order to be able to compare the retention capacity of each SCM, the effective retention of each SCM is calculated, according to Equation (3).
in which is the effective retention capacity of the SCM i (mm), is the storage depth in the freeboard of the SCM (mm), is the storage depth in the infiltration layer, is the area occupied by the SCM (m2), and is the directly connected impervious area to the SCM (m2). Please notice that DCIA (mainly tile roofs and some asphalt in the Northern SuDS [21]) is used to simplify the model since it is anticipated that DCIA is the dominant parameter for runoff volume, which is reported by Shuster et al. [19].
3.2. Remarks on the Schematized Augustenborg
The developed conceptual model is used to characterize the processes in the Northern and Southern SuDS in Augustenborg. Figure 7 shows the conceptualized representations of Northern (top) and Southern (bottom) SuDS in Augustenborg based on the effective retention depth (Equation (3)) of SCMs.
In Table 4, all the different SCMs have been systematically assigned names and properties accordingly. The details of the characterized SCMs shown in Figure 7 are also presented in Table 4. Equation (3) and Equation (4) were subsequently employed to build a model to estimate the discharges from the SCMs along all the flow paths in the Northern and Southern SuDS. The model was built in an Excel spreadsheet.
More information about the type of the implemented SCMs are shown in Figure 2 (also in Appendix A). The information regarding the characteristics of the SCMs (, , and ) as well as their corresponding mini catchment () is collected from the hydrodynamic model of the area, which was developed by Haghighatafshar et al. [11], the on-site measurements, and the GIS maps. These parameters are relatively easy to estimate and can be measured on site.
As seen in Table 4, it is obvious that water ponds, (Dry Ponds and Wet Ponds) are the backbone of the systems regarding effective retention, which account for a total effective retention depth of 80 mm and 380 mm in the Northern and Southern SuDS, respectively. The second most important feature in terms of effective retention are the infiltration areas that contribute with approximately 42 mm of effective retention in the Southern SuDS. In case of infiltration areas, effective retention capacity in most cases has two components, which include a storage volume that can be determined from the geometrical properties of the basin and measured on site, and the infiltration capacity (i.e., the function of the underlying soil properties).
The ditches and the swales, however, have a limited storage volume since they add up to 7 mm and 12 mm of effective retention depth to the Northern and Southern SuDS, respectively. For the observed rain events, these components act as connection nodes between the different ponds and also provide a connected and diverse blue-green landscape. Despite relatively large retention at the most downstream pond in the Northern SuDS (WP IV), a discharge is initiated as soon as rainfall depth reaches around 7 mm. This rapid fill-up of retention capacity is due to the two upstream SCMs, i.e., Di I and SW II, from which the discharged volume overrides the remaining free capacity in WP IV and leads to a discharge. By comparing the conceptual approach with the onsite SCMs in the Northern SuDS, it can be claimed that using swales with large DCIA as the backbone of SuDS for the conveyance of runoff from upstream SCMs to downstream SCMs without introducing substantial retention structures on the flow path leads to decreased overall effectiveness of SuDS in runoff reduction. This aligns with findings of Qin et al. [34] who found that the retention capacity of swales is very limited and, therefore, is saturated quickly. Generally, ponds and infiltration basins with an overflow threshold (freeboard) have a pronounced role in the overall runoff retention when compared to other SCMs.
At this point, it is important to make clear that, although different SCMs can relatively easily be translated to effective retention volumes, the concept of SuDS needs to be studied through a combination of SCMs to be understood and adopted by the city planners as well as the individual house-owners. This is the key to the success of this technique. In order to better understand the response pattern of the different combinations of SCMs, it is beneficial to expand our knowledge on how SuDS as the flow train of different SCMs can be introduced in the best way.
At this stage, the conceptual model provides a better understanding of hydraulics that prevail in mesoscale SuDS implementations, which can promote the required dialogue between different actors at the planning phase. However, in the prospect of future studies, the concept can be further developed to estimate the discharge hydrographs from mesoscale SuDS. A mathematically simple representation of the hydraulics in mesoscale SuDS could result in computationally faster models. Such fast models can then be used for large-scale simulations as an alternative to the computationally costly and time-consuming 2-dimensional distributed hydrodynamic models. Fast and cheap models are needed to study the upscaling effects of SuDS on the city-level.
4. Conclusions
Extensive rainfall-runoff measurements at two urban catchments with SuDS along with one pipe-bound catchment were used to investigate the systems’ responses at different rainfalls. Runoff measurements at the most downstream point of each catchment showed that, in contrast with the SuDS, the flow from the pipe-system was directly affected by the rainfall intensity. However, the total runoff volume was still a function of the total rain depth. In order to describe this transformation that takes place in a SuDS, a conceptual model was introduced from the viewpoint of catchments’ runoff-equivalent impervious area. In the model, implementation of SuDS disintegrates the catchment area into a group of discrete and disaggregated mini catchments. These mini catchments establish connections with each other depending on the volume of the rain event. The dynamics of the conceptual model demonstrated that the order and placement of different stormwater control measures within the framework of SuDS with different retention capacities affects the overall performance of the system. The conceptualization of SuDS establishes a new platform for further evaluation and discussion of these systems at mesoscale. The model promotes the communication between urban planners and water engineers. This, in turn, can lead to the design of SuDS in which hydraulic performance alongside aesthetical and architectural quality is taken into consideration.
Supplementary Materials
The following are available online at https://www.mdpi.com/2073-4441/10/8/1041/s1, Figure S1: Rainfall A, Figure S2: Rainfall B, Figure S3: Rainfall C, Figure S4: Rainfall D, Figure S5: Rainfall E, Figure S6: Rainfall F, Figure S7: Rainfall G, Figure S8: Rainfall H, Figure S9: Rainfall I, and Figure S10: Rainfall J.
Author Contributions
Conceptualization, J.J., H.A. and S.H. Methodology, S.H., K.J., and J.J. Investigation, J.J. and H.A. Resources, K.J., J.J., and H.A. Data Curation, S.H. and H.A. Writing-Original Draft Preparation, S.H. Writing-Review & Editing, S.H., J.J., H.A., and K.J. Supervision, K.J., J.J., and H.A. Visualization, S.H. Project Administration, S.H. Funding Acquisition, K.J., J.J., and H.A.
Funding
This research was financially supported by VA SYD, Sweden Water Research, J. Gustaf Richert Foundation (grant number 2015-00181) at SWECO as well as the Swedish Water and Wastewater Association (Svenskt Vatten) via VA-teknik Södra (grant number 15-108).
Acknowledgments
The authors thank the personnel at VA SYD for their practical support in the installation of flowmeters and the collection of data. Tomas Wolf and John Hägg, VA SYD, are especially acknowledged for their invaluable contribution to the setup and the maintenance of the measurement system. Professor Magnus Larson, Division of Water Resources Engineering at the Department of Building and Environmental Technology, Lund University is also sincerely acknowledged for his thoughtful input to the final manuscript.
Conflicts of Interest
The authors declare no conflict of interest.
Appendix A
Figure A1.
The photos of some of the implemented SCMs in Augustenborg. Different types of SCMs are shown in the figure as follows: (DP 4) dry pond, (Di I & 1) stormwater ditch, (SW I & II) swale, (WP 2, II & IV) wet pond, (INF 3) infiltration basin, (GR) green roof. The major runoff directions in the Northern and Southern systems are SW I → WP IV and GR → DP 4, respectively. Pictures for INF 3, WP 2, Di 1, and SW I & II are taken by Henrik Thorén (Rambøll). Background picture: GSD-Orthophoto, courtesy of The Swedish Mapping, Cadastral and Land Registration Authority, ©Lantmäteriet (2015).

References
- Meerow, S.; Newell, J.P. Spatial planning for multifunctional green infrastructure: Growing resilience in Detroit. Landsc. Urban Plan. 2017, 159, 62–75. [Google Scholar] [CrossRef]
- Tzoulas, K.; Korpela, K.; Venn, S.; Yli-Pelkonen, V.; Kaźmierczak, A.; Niemela, J.; James, P. Promoting ecosystem and human health in urban areas using Green Infrastructure: A literature review. Landsc. Urban Plan. 2007, 81, 167–178. [Google Scholar] [CrossRef] [Green Version]
- Wolch, J.R.; Byrne, J.; Newell, J.P. Urban green space, public health, and environmental justice: The challenge of making cities ‘just green enough. Landsc. Urban Plan. 2014, 125, 234–244. [Google Scholar] [CrossRef]
- Palla, A.; Gnecco, I. Hydrologic modeling of Low Impact Development systems at the urban catchment scale. J. Hydrol. 2015, 528, 361–368. [Google Scholar] [CrossRef]
- Ahiablame, L.; Shakya, R. Modeling flood reduction effects of low impact development at a watershed scale. J. Environ. Manag. 2016, 171, 81–91. [Google Scholar] [CrossRef] [PubMed]
- Jato-Espino, D.; Charlesworth, S.; Bayon, J.; Warwick, F. Rainfall–Runoff Simulations to Assess the Potential of SuDS for Mitigating Flooding in Highly Urbanized Catchments. Int. J. Environ. Res. Public Health 2016, 13, 149. [Google Scholar] [CrossRef] [PubMed]
- Stahre, P. Sustainability in Urban Storm Drainage—Planning and Examples, 1st ed.; Svenskt Vatten: Malmö, Sweden, 2006. [Google Scholar]
- Sörensen, J.; Persson, A.; Sternudd, C.; Aspegren, H.; Nilsson, J.; Nordström, J.; Jönsson, K.; Mottaghi, M.; Becker, P.; Pilesjö, P.; et al. Re-Thinking Urban Flood Management—Time for a Regime Shift. Water 2016, 8, 332. [Google Scholar] [CrossRef]
- Mottaghi, M.; Aspegren, H.; Jönsson, K. Integrated urban design and open storm drainage in our urban environments: Merging drainage techniques into our city’s urban spaces. Water Pract. Technol. 2016, 11, 118–126. [Google Scholar] [CrossRef]
- Fletcher, T.D.; Shuster, W.; Hunt, W.F.; Ashley, R.; Butler, D.; Arthur, S.; Trowsdale, S.; Barraud, S.; Semadeni-Davies, A.; Bertrand-Krajewski, J.-L.; et al. SUDS, LID, BMPs, WSUD and more—The evolution and application of terminology surrounding urban drainage. Urban Water J. 2015, 12, 525–542. [Google Scholar] [CrossRef]
- Haghighatafshar, S.; Nordlöf, B.; Roldin, M.; Gustafsson, L.-G.; la Cour Jansen, J.; Jönsson, K. Efficiency of blue-green stormwater retrofits for flood mitigation—Conclusions drawn from a case study in Malmö, Sweden. J. Environ. Manag. 2018, 207, 60–69. [Google Scholar] [CrossRef] [PubMed]
- Healthy Land and Water. WSUD Water Sensitive Urban Design—Technical Design Guidelines for South East Queensland; Healthy Land and Water: Brisbane, Australia, 2006. [Google Scholar]
- Charlesworth, S.; Warwick, F.; Lashford, C. Decision-Making and Sustainable Drainage: Design and Scale. Sustainability 2016, 8, 782. [Google Scholar] [CrossRef]
- Liu, H.; Jia, Y.; Niu, C. “Sponge city” concept helps solve China’s urban water problems. Environ. Earth Sci. 2017, 76, 473. [Google Scholar] [CrossRef]
- Jarden, K.M.; Jefferson, A.J.; Grieser, J.M. Assessing the effects of catchment-scale urban green infrastructure retrofits on hydrograph characteristics. Hydrol. Process. 2016, 30, 1536–1550. [Google Scholar] [CrossRef]
- Loperfido, J.V.; Noe, G.B.; Jarnagin, S.T.; Hogan, D.M. Effects of distributed and centralized stormwater best management practices and land cover on urban stream hydrology at the catchment scale. J. Hydrol. 2014, 519, 2584–2595. [Google Scholar] [CrossRef]
- Jefferson, A.J.; Bhaskar, A.S.; Hopkins, K.G.; Fanelli, R.; Avellaneda, P.M.; McMillan, S.K. Stormwater management network effectiveness and implications for urban watershed function: A critical review. Hydrol. Process. 2017, 31, 4056–4080. [Google Scholar] [CrossRef]
- Haghighatafshar, S.; la Cour Jansen, J.; Aspegren, H.; Lidström, V.; Mattsson, A.; Jönsson, K. Storm-water management in Malmö and Copenhagen with regard to Climate Change Scenarios. J. Water Manag. Res. 2014, 70, 159–168. [Google Scholar]
- Sörensen, J.; Mobini, S. Pluvial, urban flood mechanisms and characteristics—Assessment based on insurance claims. J. Hydrol. 2017, 555, 51–67. [Google Scholar] [CrossRef]
- Burns, M.J.; Fletcher, T.D.; Walsh, C.J.; Ladson, A.R.; Hatt, B.E. Hydrologic shortcomings of conventional urban stormwater management and opportunities for reform. Landsc. Urban Plan. 2012, 105, 230–240. [Google Scholar] [CrossRef]
- Nordlöf, B. 1D/2D Modeling of the Open Stormwater System of Augustenborg Using MIKE FLOOD by DHI; Project Report Available at Water and Environmental Engineering at the Department of Chemical Engineering; Lund University: Lund, Sweden, 2016. [Google Scholar]
- Shuster, W.D.; Bonta, J.; Thurston, H.; Warnemuende, E.; Smith, D.R. Impacts of impervious surface on watershed hydrology: A review. Urban Water J. 2005, 2, 263–275. [Google Scholar] [CrossRef]
- Yao, L.; Wei, W.; Chen, L. How does imperviousness impact the urban rainfall-runoff process under various storm cases? Ecol. Indic. 2016, 60, 893–905. [Google Scholar] [CrossRef] [Green Version]
- Bell, C.D.; McMillan, S.K.; Clinton, S.M.; Jefferson, A.J. Hydrologic response to stormwater control measures in urban watersheds. J. Hydrol. 2016, 541, 1488–1500. [Google Scholar] [CrossRef]
- Lee, J.G.; Heaney, J.P. Estimation of Urban Imperviousness and its Impacts on Storm Water Systems. J. Water Resour. Plan. Manag. 2003, 129, 419–426. [Google Scholar] [CrossRef]
- Leopold, L.B. Lag times for small drainage basins. CATENA 1991, 18, 157–171. [Google Scholar] [CrossRef]
- Ebrahimian, A.; Gulliver, J.S.; Wilson, B.N. Effective impervious area for runoff in urban watersheds. Hydrol. Process. 2016, 30, 3717–3729. [Google Scholar] [CrossRef]
- Dahlström, B. Regnintensitet—En Molnfysikalisk Betraktelse (in Swedish) [English: Rain Intensity—A Cloud-Physical Contemplation]; Svenskt Vatten AB: Stockholm, Sweden, 2010. [Google Scholar]
- Albrecht, J.C. Alterations in the Hydrologic Cycle Induced by Urbanization in Northern New Castle County, Delaware: Magnitudes and Projections; University of Delaware: Newark, DE, USA, 1974. [Google Scholar]
- Arnell, V. Estimating Runoff Volumes from Urban Areas. J. Am. Water Resour. Assoc. 1982, 18, 1–21. [Google Scholar] [CrossRef]
- Miller, R.A. Characteristics of Four Urbanized Basins in South Florida; Open-File Report 79–694; United States Geological Survey: Reston, VA, USA, 1979. [Google Scholar]
- Dinicola, R.S. Characterization and Simulation of Rainfall-Runoff Relations for Headwater Basins in Western King and Snohomish Counties, Washington; Water-Resources Investigations Report 89–4052; United States Geological Survey: Reston, VA, USA, 1990. [Google Scholar]
- Alley, W.M.; Veenhuis, J.E. Effective impervious area in urban runoff modelling. J. Hydraul. Eng. 1983, 109, 313–319. [Google Scholar] [CrossRef]
- Qin, H.; Li, Z.; Fu, G. The effects of low impact development on urban flooding under different rainfall characteristics. J. Environ. Manag. 2013, 129, 577–585. [Google Scholar] [CrossRef] [PubMed] [Green Version]
Figure 1.
Different levels of implementation for SuDS/SCMs, (a) Microscale, (b) Mesoscale, and (c) Macroscale.
Figure 1.
Different levels of implementation for SuDS/SCMs, (a) Microscale, (b) Mesoscale, and (c) Macroscale.

Figure 2.
The locations of rainfall and runoff monitoring points as well as the catchment delineation in Augustenborg. The unmarked areas within the borders of the Augustenborg area are directly drained into the existing municipal pipe-bound combined sewer network. Connection points marked as CPN, CPP-B, and CPS are the discharge points for the Northern retrofit, the pipe-bound catchment, and the Southern retrofit, respectively. Note that the flow is in the north-west direction, i.e., towards the connection points [21]. For SCM types, see Figure A1. Background picture: GSD-Orthophoto, courtesy of The Swedish Mapping, Cadastral and Land Registration Authority, ©Lantmäteriet (2015). [This figure—slightly modified—is adopted from Haghighatafshar et al. [11] with permission].

Figure 3.
Hyetograph over the period of the study.

Figure 4.
Two examples from the monitored hyetographs and hydrographs during this study. See rainfalls D and I in Table 2. The details of all rainfall-runoff observations are provided as supplementary material (available online).
Figure 4.
Two examples from the monitored hyetographs and hydrographs during this study. See rainfalls D and I in Table 2. The details of all rainfall-runoff observations are provided as supplementary material (available online).

Figure 5.
Calculated REIA in case of the observed rainfalls for all three catchments in Augustenborg compared to the TIA (based on field surveys and GIS maps as given in Nordlöf [21]): (a) Pipe-bound; (b) Northern SuDS; (c) Southern SuDS.
Figure 5.
Calculated REIA in case of the observed rainfalls for all three catchments in Augustenborg compared to the TIA (based on field surveys and GIS maps as given in Nordlöf [21]): (a) Pipe-bound; (b) Northern SuDS; (c) Southern SuDS.

Figure 6.
Conceptual illustration of two extreme setups for construction of SuDS with different components. Please note that all the shown mini catchments have the same area, i.e., A, while the size of the circles represents the retention capacity of SCMs: (a) Scenario X; (b) Scenario Y.
Figure 6.
Conceptual illustration of two extreme setups for construction of SuDS with different components. Please note that all the shown mini catchments have the same area, i.e., A, while the size of the circles represents the retention capacity of SCMs: (a) Scenario X; (b) Scenario Y.

Figure 7.
Conceptual illustration of Northern SuDS (top) and Southern SuDS (bottom) in Augustenborg. Each SCM is represented as a circle. The size of the circle corresponds to the effective retention capacity of the SCM, i.e., . Please notice that the SCMs belonging to the Northern SuDS are indexed with Roman numerals while SCMs in the Southern SuDS are numbered with Arabic numerals. The size of the circle representing SCM is an indicator of its effective detention depth (sizes are not proportionally correct). The background picture is acquired from Google Earth.


Table 1.
Distribution of different types of surfaces in the catchments in Augustenborg extracted from Reference [21].
Table 1.
Distribution of different types of surfaces in the catchments in Augustenborg extracted from Reference [21].
| Surface Type | Pipe-Bound | Northern SuDS | Southern SuDS | |||
|---|---|---|---|---|---|---|
| ha | % | ha | % | ha | % | |
| Tile roof | 0.5 | 15 | 1.7 | 27 | 1.7 | 17 |
| Asphalt/Concrete | 2.0 | 56 | 1.5 | 24 | 3.0 | 32 |
| Grass area | 1.0 | 28 | 2.9 | 46 | 3.0 | 31 |
| Green roof | 0.0 | 0 | 0.0 | 0 | 1.0 | 11 |
| Sand | 0.0 | 1 | 0.1 | 1 | 0.8 | 8 |
| Gravel | 0.0 | 0 | 0.1 | 2 | 0.1 | 1 |
| Total | 3.5 | 100 | 6.3 | 100 | 9.5 | 100 |
Table 2.
Calculated REIAs and their corresponding contribution coefficients for 10 rain events.
| Rainfall Event ID | Rainfall Depth (mm) | Rainfall Duration (h) | Vout (m3) | Contribution Coefficient—Equation (2) (-) | ||||
|---|---|---|---|---|---|---|---|---|
| Pipe-System (3.5 ha) | Northern SuDS (6.3 ha) | Southern SuDS (9.5 ha) | Pipe-System (3.5 ha) | Northern SuDS (6.3 ha) | Southern SuDS (9.5 ha) | |||
| A | 7.8 | 0.45 | 107.47 | 24.28 | 0.00 | 0.55 | 0.10 | 0 |
| B | 10.6 | 3.37 | 129.56 | n/a | 5.40 | 0.49 | n/a | 0.01 |
| C | 13.4 | 2.18 | 189.55 | 107.78 | 14.00 | 0.57 | 0.25 | 0.02 |
| D | 13.8 | 9.25 | 197.15 | 86.22 | 12.76 | 0.57 | 0.19 | 0.02 |
| E | 15.6 | 4.78 | 174.31 | 96.43 | 11.14 | 0.45 | 0.19 | 0.02 |
| F | 17.4 | 3.90 | 165.17 | 142.27 | 132.66 | 0.38 | 0.25 | 0.16 |
| G | 17.8 | 15.5 | 154.73 | 117.23 | 101.4 | 0.35 | 0.20 | 0.12 |
| H | 19.0 | 22.7 | 268.9 | 164.49 | 93.75 | 0.57 | 0.27 | 0.11 |
| I | 22.6 | 4.15 | 273.23 | 258.04 | 215.89 | 0.48 | 0.35 | 0.20 |
| J | 28.4 | 9.14 | 352.19 | 288.53 | 293.02 | 0.50 | 0.32 | 0.22 |
Table 3.
Response matrix of the conceptual model in the case of scenarios X and Y (see Figure 6).
Table 3.
Response matrix of the conceptual model in the case of scenarios X and Y (see Figure 6).
| Rain Depth (mm) | Scenario X | Scenario Y | ||||
|---|---|---|---|---|---|---|
| Active Links | Discharge (mm) | Contributing Area | Active Links | Discharge (mm) | Contributing Area | |
| <1 × V | - | - | - | - | - | |
| 2 × V | - | 1 × V | A | a | - | - |
| 3 × V | - | 2 × V | A | a, b | - | - |
| 4 × V | d | 4 × V | 2 × A | a, b, c | - | - |
| 5 × V | d | 6 × V | 2 × A | a, b, c, d | - | - |
| 6 × V | d, c | 9 × V | 3 × A | a, b, c, d | 5 × V | 5 × A |
| 9 × V | d, c, b | 20 × V | 4 × A | a, b, c, d | 20 × V | 5 × A |
| 10 × V | d, c, b, a | 25 × V | 5 × A | a, b, c, d | 25 × V | 5 × A |
Table 4.
Characteristics of the SCMs in the Northern and the Southern SuDS in Augustenborg. The sequence of the SCMs with respect to flow path (upstream-downstream) is illustrated in Figure 7.
Table 4.
Characteristics of the SCMs in the Northern and the Southern SuDS in Augustenborg. The sequence of the SCMs with respect to flow path (upstream-downstream) is illustrated in Figure 7.
| System | SCM ID | Storage, | SCM Area, ASCM (m2) | DCIA (m2) | ||
|---|---|---|---|---|---|---|
| Northern SuDS | SW I | 5 | 15 | 740 | 2780 | 5.3 |
| WP I | 250 | 0 | 90 | 3920 | 5.7 | |
| WP II | 250 | 0 | 200 | 1120 | 44.6 | |
| WP III | 250 | 0 | 90 | 1620 | 13.9 | |
| SW II | 5 | 15 | 240 | 3400 | 1.4 | |
| Di I | 5 | 0 | 80 | 2100 | 0.2 | |
| WP IV | 350 | 0 | 160 | 3500 | 16.0 | |
| Southern SuDS | GR 1 | 0 | 45 | 10,000 | 10,000 | 45 |
| WP 1 | 200 | 0 | 140 | 8500 | 3.3 | |
| DP 1 | 105 | 45 | 100 | 560 | 26.8 | |
| Di 1 | 200 | 0 | 98 | 1685 | 11.6 | |
| WP 2 | 150 | 0 | 700 | 560 | 187.5 | |
| INF. 1 | 35 | 25 | 800 | 3150 | 15.2 | |
| DP 3 | 105 | 45 | 170 | 2760 | 9.2 | |
| INF. 2 | 0 | 25 | 800 | 1300 | 15.4 | |
| DP 2 | 0 | 15 | 200 | 1180 | 2.5 | |
| INF. 3 | 500 | 25 | 115 | 5460 | 11.1 | |
| DP 4 | 25 | 25 | 900 | 300 | 150.0 |
© 2018 by the authors. Licensee MDPI, Basel, Switzerland. This article is an open access article distributed under the terms and conditions of the Creative Commons Attribution (CC BY) license (http://creativecommons.org/licenses/by/4.0/).
Share and Cite
MDPI and ACS Style
Haghighatafshar, S.; La Cour Jansen, J.; Aspegren, H.; Jönsson, K. Conceptualization and Schematization of Mesoscale Sustainable Drainage Systems: A Full-Scale Study. Water 2018, 10, 1041. https://doi.org/10.3390/w10081041
AMA Style
Haghighatafshar S, La Cour Jansen J, Aspegren H, Jönsson K. Conceptualization and Schematization of Mesoscale Sustainable Drainage Systems: A Full-Scale Study. Water. 2018; 10(8):1041. https://doi.org/10.3390/w10081041
Chicago/Turabian StyleHaghighatafshar, Salar, Jes La Cour Jansen, Henrik Aspegren, and Karin Jönsson. 2018. "Conceptualization and Schematization of Mesoscale Sustainable Drainage Systems: A Full-Scale Study" Water 10, no. 8: 1041. https://doi.org/10.3390/w10081041
Note that from the first issue of 2016, this journal uses article numbers instead of page numbers. See further details here.