1. Introduction
According to the Council Directive of the European Communities concerning the optimal quality for natural surface water, the average threshold value for the chloride concentration is 5.642 mmol/L (200 mg/L) [
1,
2]. In natural surface waters, the chloride concentration depends not only on geological and geographical background conditions, but on ecological circumstances as well [
3]. On the one hand, high chloride concentrations in water are not known to have toxic effects on humans, although large amounts may act corrosively and be harmful to plant life. Chlorides are present in both fresh and salt water and, are essential elements of life [
4]. On the other hand, salinization of fresh water and dry periods pose a serious problem for the surrounding areas of river and stream basins.
A high chloride concentration may be due to environmental contamination. In the present study, the experimental settings are validated to consolidate the determined chloride concentrations in natural surface water [
5].
In our analytical chemistry labs, the accuracy of low-cost automated potentiometric measurements e.g., determination of common salt concentration, has increased over time [
6]. In fundamental and applied chemistry research in general, it is of the utmost importance to record and process physicochemical parameters e.g., the pH of a buffer solution, with the highest accuracy and precision. For these measurements, the concentration of hydrogen ions was measured by a hydrogen ion selective electrode [
7]. These results encouraged us to measure chloride ions in fresh water using a Silver/Sulfide Solid State ion selective electrode in an adapted potentiometric titration setup.
A powerful semi-automated analytical setup was developed for monitoring multiple variables using a low-cost multifunction Data Acquisition Board (DAQ) [
8] and a homemade LabVIEW™ program. In this study, the chloride concentration in a temperature-controlled, unknown NaCl solution, as well as in natural surface water, is determined. On a hardware level, the semi-automated setup is equipped with a temperature sensor and an electronic valve controlled by the DAQ, while a pH/mV potentiometer and a cryostat to maintain a pre-set temperature are connected with the computer via a RS 232 interface port. On the software level, in this laboratory environment, the potential, E(Ag
+), is monitored during a potentiometric precipitation titration of a primary standard NaCl solution with a standard AgNO
3 solution using a pH/mV potentiometer. At the end point of the titration, E(Ag
+) and the added volume of the AgNO
3 (V(Ag
+)) are determined by the Virtual Instrument (VI) numerical first derivative tool in the LabVIEW™ 2015 SP 1 (version 15.0.1) software. Via the well-known titration formula (c(Cl
−)) can be calculated. Via the calibration curve, E(Ag
+) versus –log (c(Ag
+)) for different thermostatically controlled AgNO
3 standard solutions, the equilibrium concentration of Ag
+ i.e., [Ag
+] at the end point is derived, and thus, the solubility product of silver chloride (K
sp) at 298 K.
In view of an increase of accuracy in determining the endpoint in the precipitation titration curve by the Gran plot mathematical approach, a homemade LabVIEW program is developed.
Thus, the envisaged Cl
− concentration (c(Cl
−)) in standard conditions and in fresh river water is indirectly calculated from the measured E(Ag
+) data as a function of V(Ag
+). Note that for the Gran plot equations [
9], the above-mentioned calibration curve is still crucial to convert the measured E(Ag
+) values into [Ag
+]. The Gran method is validated by comparing the independently obtained analytical concentrations of silver and chloride ions and indirectly K
sp, via the LabVIEW VI tool, based on a single measuring point at the end, and the Gran plot strategy for a range of experimental titration data near the end point. This not only confirms the reliability of the tailor-made Gran plot program, but also the reproducibility of the experimental conditions of the semi-automated setup for the potentiometric determination of the chloride concentration in fresh river water [
10].
To summarize, our method enables the simultaneous determination of the free/analytical concentrations of chloride and silver ions, and the solubility product at a given temperature, in one single experiment.
It is shown that the values of the experimentally determined chloride concentration and the related solubility product of silver chloride by the Gran method are more reproducible and consistent for a series of titrations than by the VI method, thus emphasizing an accurate performance of the used semi-automated potentiometric setup for the analysis of fresh river water.
2. Materials and Methods
2.1. Chemicals
Forty milliliters natural surface water of the Demer river (50°55′28.7″ N, 5°23′22.8″ E), a tributary of the international Scheldt river basin district, was sampled using a dedicated vessel [
11,
12]. Solid silver nitrate, AnalaR Normapur
®, sodium chloride, AnalaR Normapur
® and, Ionic Strength Adjuster solution (ISA, 5 M NaNO
3) for silver measurements, Cat. No. 940011, Thermo Scientific were supplied by VWR International, Oud-Heverlee, Belgium. Water was purified by an arium
® 611DI|611UV apparatus (VWR International, Oud-Heverlee, Belgium).
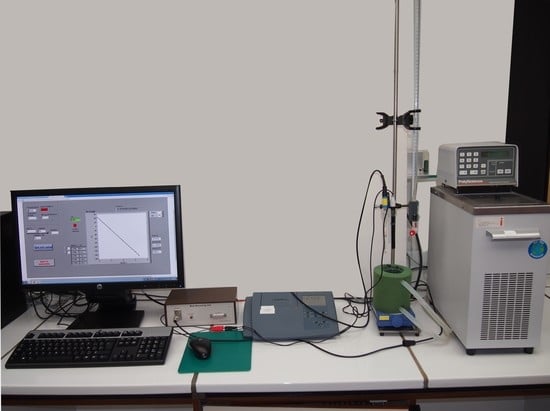
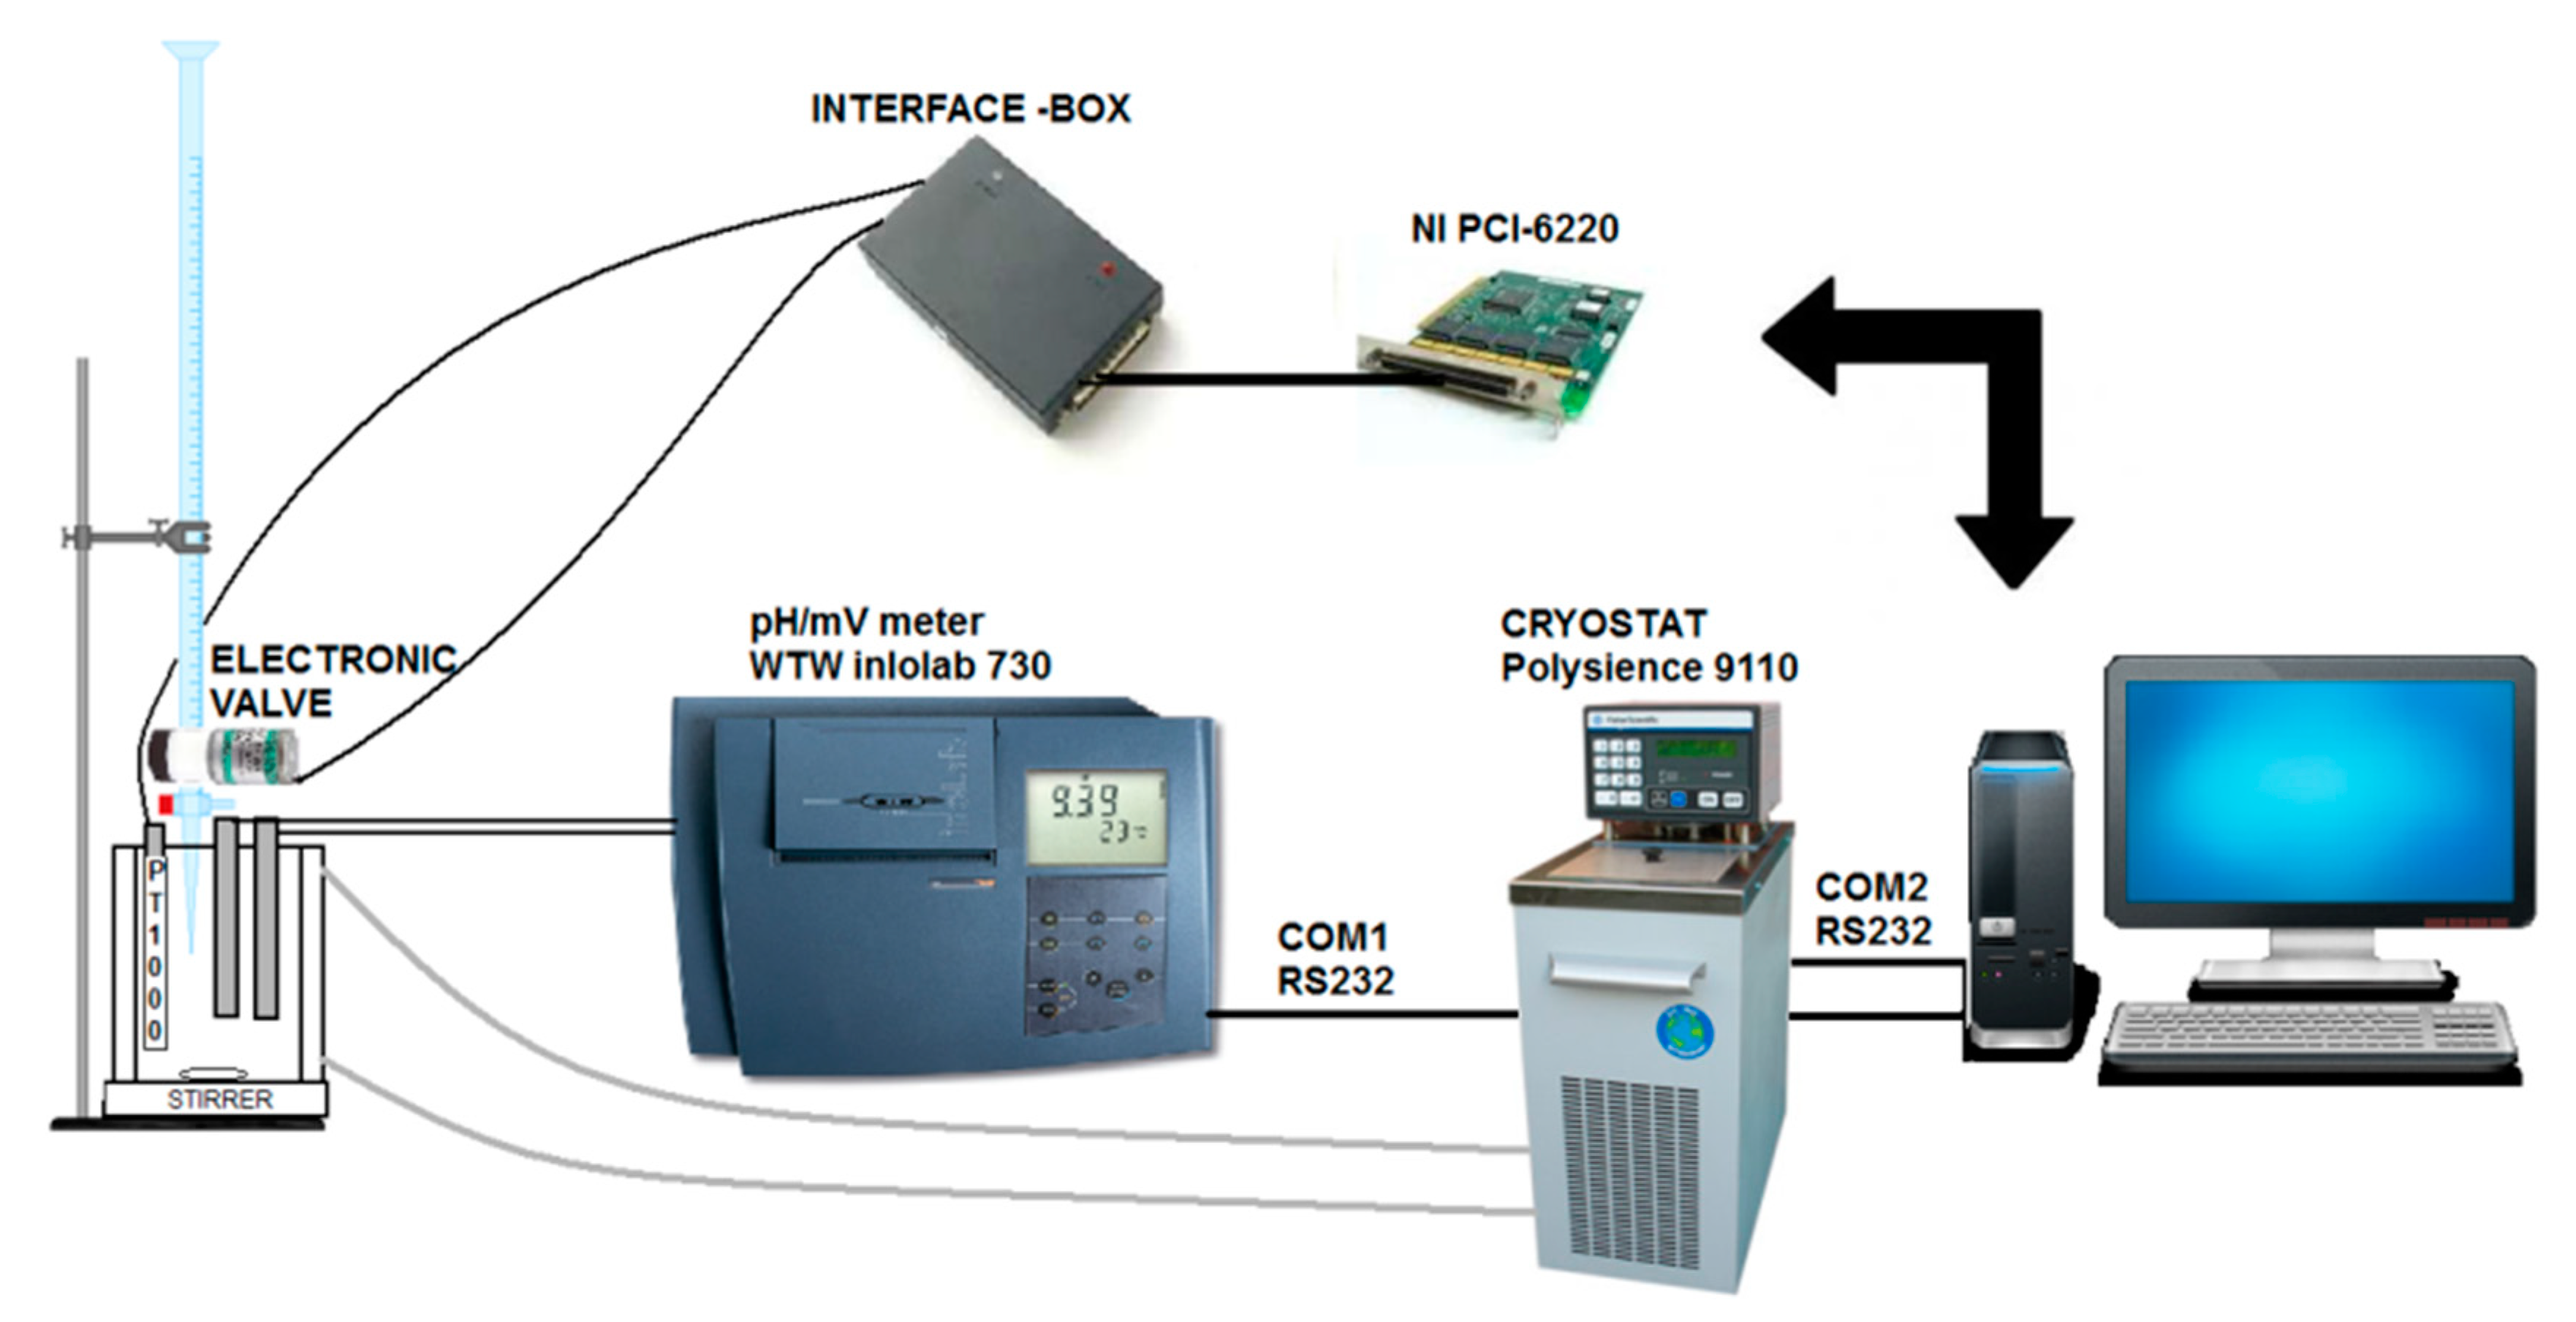
2.2. Equipment and General Setup
In the framework of the presented study, the traditional manual configuration of a titration is customized to a semi-automated setup (
Figure 1 and
Figure S1).
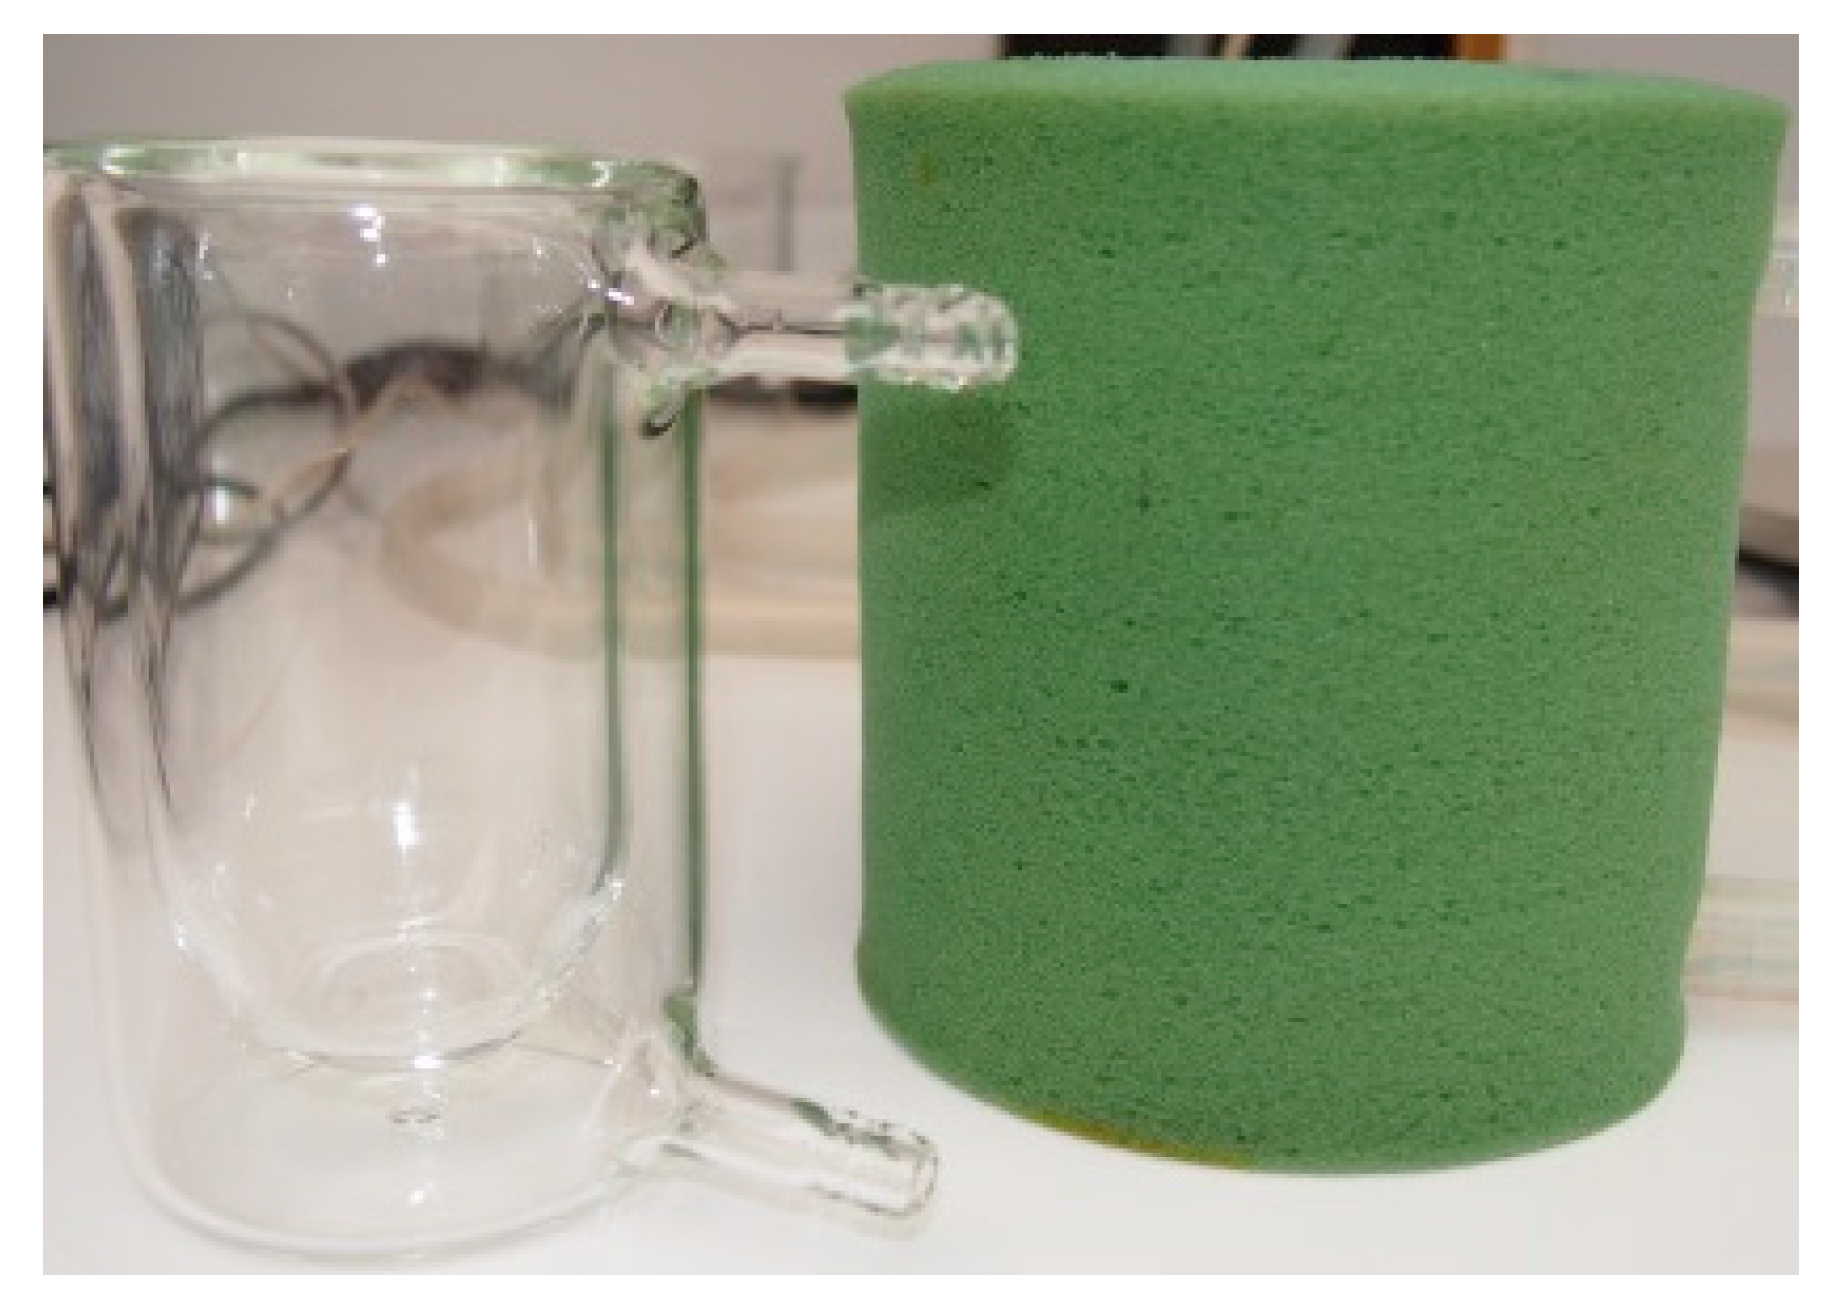
A homemade double-walled titration vessel insulated with a polyurethane jacket (
Figure 2) was connected to a cryostat (
Figure S2) (Polyscience Digital Temperature Controller (model 9110), VWR International, Oud-Heverlee, Belgium).
The computer was extended with a multifunction NI PCI-6220-DAQ board, a homemade power supply interface box and the National Instruments Software Platform Bundle Spring 2016 (NI corp.) [
8]. A temperature sensor, PT1000 (Schott type W 5780 NN supplied by VWR International, Oud-Heverlee, Belgium) to measure the temperature of the solution in the vessel (
Figure S3) was connected via DAQ built into a HP Compaq Elite 8300 Micro tower working with the operating system Microsoft Windows 10. The temperature of the water in the cryostat, connected via a RS 232 interface port, and thus, also of solution in the insulated titration vessel, was automatically set to 298 K. The temperature was monitored to allow the cryostat to respond to the least temperature change.
The sodium chloride solution in the first part of the experiment, and the filtered surface water in the second part, were added with a 20 mL (±0.03 mL, 20 °C) bulb pipette, BLAUBRAND® to the insulated titration vessel placed on a magnetic stirrer (type IKA Mini-MR standard 100–240 V, 50/60 Hz, 0–1500 rpm, supplied by VWR International, Oud-Heverlee, Belgium). The surface water was filtered on GN-6 Metricel® S-Pack membrane Disc Filters Prod. No. 66278, using Sentino™ Magnetic Filter Funnels, Part Number 4271, PALL® Life Sciences to remove insoluble organic and inorganic particles. The solution in the insulated titration vessel was constantly stirred with a magnetic stirring rod at a low velocity to minimize the capture of carbon dioxide from the air.
A 50 mL (±0.05 mL, 20 °C) burette BLAUBRAND
® filled with the silver nitrate solution was manually assembled just above the stopcock using inert silicone glue-elastosil (supplied by VWR International, Oud-Heverlee, Belgium) to an electronic valve, 2-way solenoid valve, normally open, STV-02-M6(1/4U)KG-12 V DC, Metrohm, Antwerpen, Belgium. A Silver/Sulfide Solid State Half-Cell Ion Selective Electrode (ISE) Orion 9416SC Thermo Scientific [
13] (supplied by Thermo Fisher Scientific, Geel, Belgium) and a Ceramic Hg/Hg
2SO
4 reference electrode (+15 °C … +40 °C), SI Analytics B 3610+ (supplied by VWR International, Oud-Heverlee, Belgium), introduced in the vessel, are connected to a potentio pH/mV meter WTW inoLab
® pH 730 BNC-1A20-210 (supplied by VWR International, Oud-Heverlee, Belgium). The voltage measurements of the potentiometer were converted by the DAQ, controlled by a homemade LabVIEW™ program.
2.3. Volume Control of Titrant Reagent in the Semi-Automated Setup
Volume control of the titrant reagent is crucial in the semi-automated setup, since the measurements during the titration are executed in function of the added volume. Therefore, a 50 mL burette was equipped with a controlled electronic valve, as described in the general setup. The isolated solenoid diaphragm valve was chosen for its inertness to most chemicals, alkaline as well as acid. Highly inert material, polytetrafluoroethylene (PTFE), was used for the parts in contact with the fluid, resulting in a design that can be used for a wide range of fluids.
The solenoid diaphragm valve has a function ‘Normal Open’ to fill the burette with the titrant reagent. To close the valve, the controlling electronic power supply circuit of the homemade interface box (
Figure 3) provides 12 V DC across the solenoid (COIL).
To calibrate the volume of the droplets dripping from the burette, a LabVIEW program was written to automatically drip a predetermined number of droplets of the solution into the vessel in a set time frame (3 droplets/0.8 s). The volume was manually read from the burette and registered into the program. This procedure needs to be repeated at the beginning of each experiment.
2.4. Automated Registration of the Ag+-ion Activity
For the automated registration of the Ag+ ion activity at the Ag/S2− electrode with respect to the Hg/Hg2SO4 electrode, voltage (mV) data were read out by the computer via RS232 communication with the potentio pH/mV meter.
2.5. The Homemade LabVIEW Program
Currently, in our lab, the LabVIEW run time engine 2013 [
8] is installed as a communication tool between the homemade LabVIEW program and the DAQ. The homemade program using LabVIEW
© software (supplied by National Instruments Belgium nv, Zaventem, Belgium), combines different tasks: Controlling the valve, calculating the added volume via calibration volume droplets of the titrant, reading the potentio mV meter and data processing.
2.6. Methodology
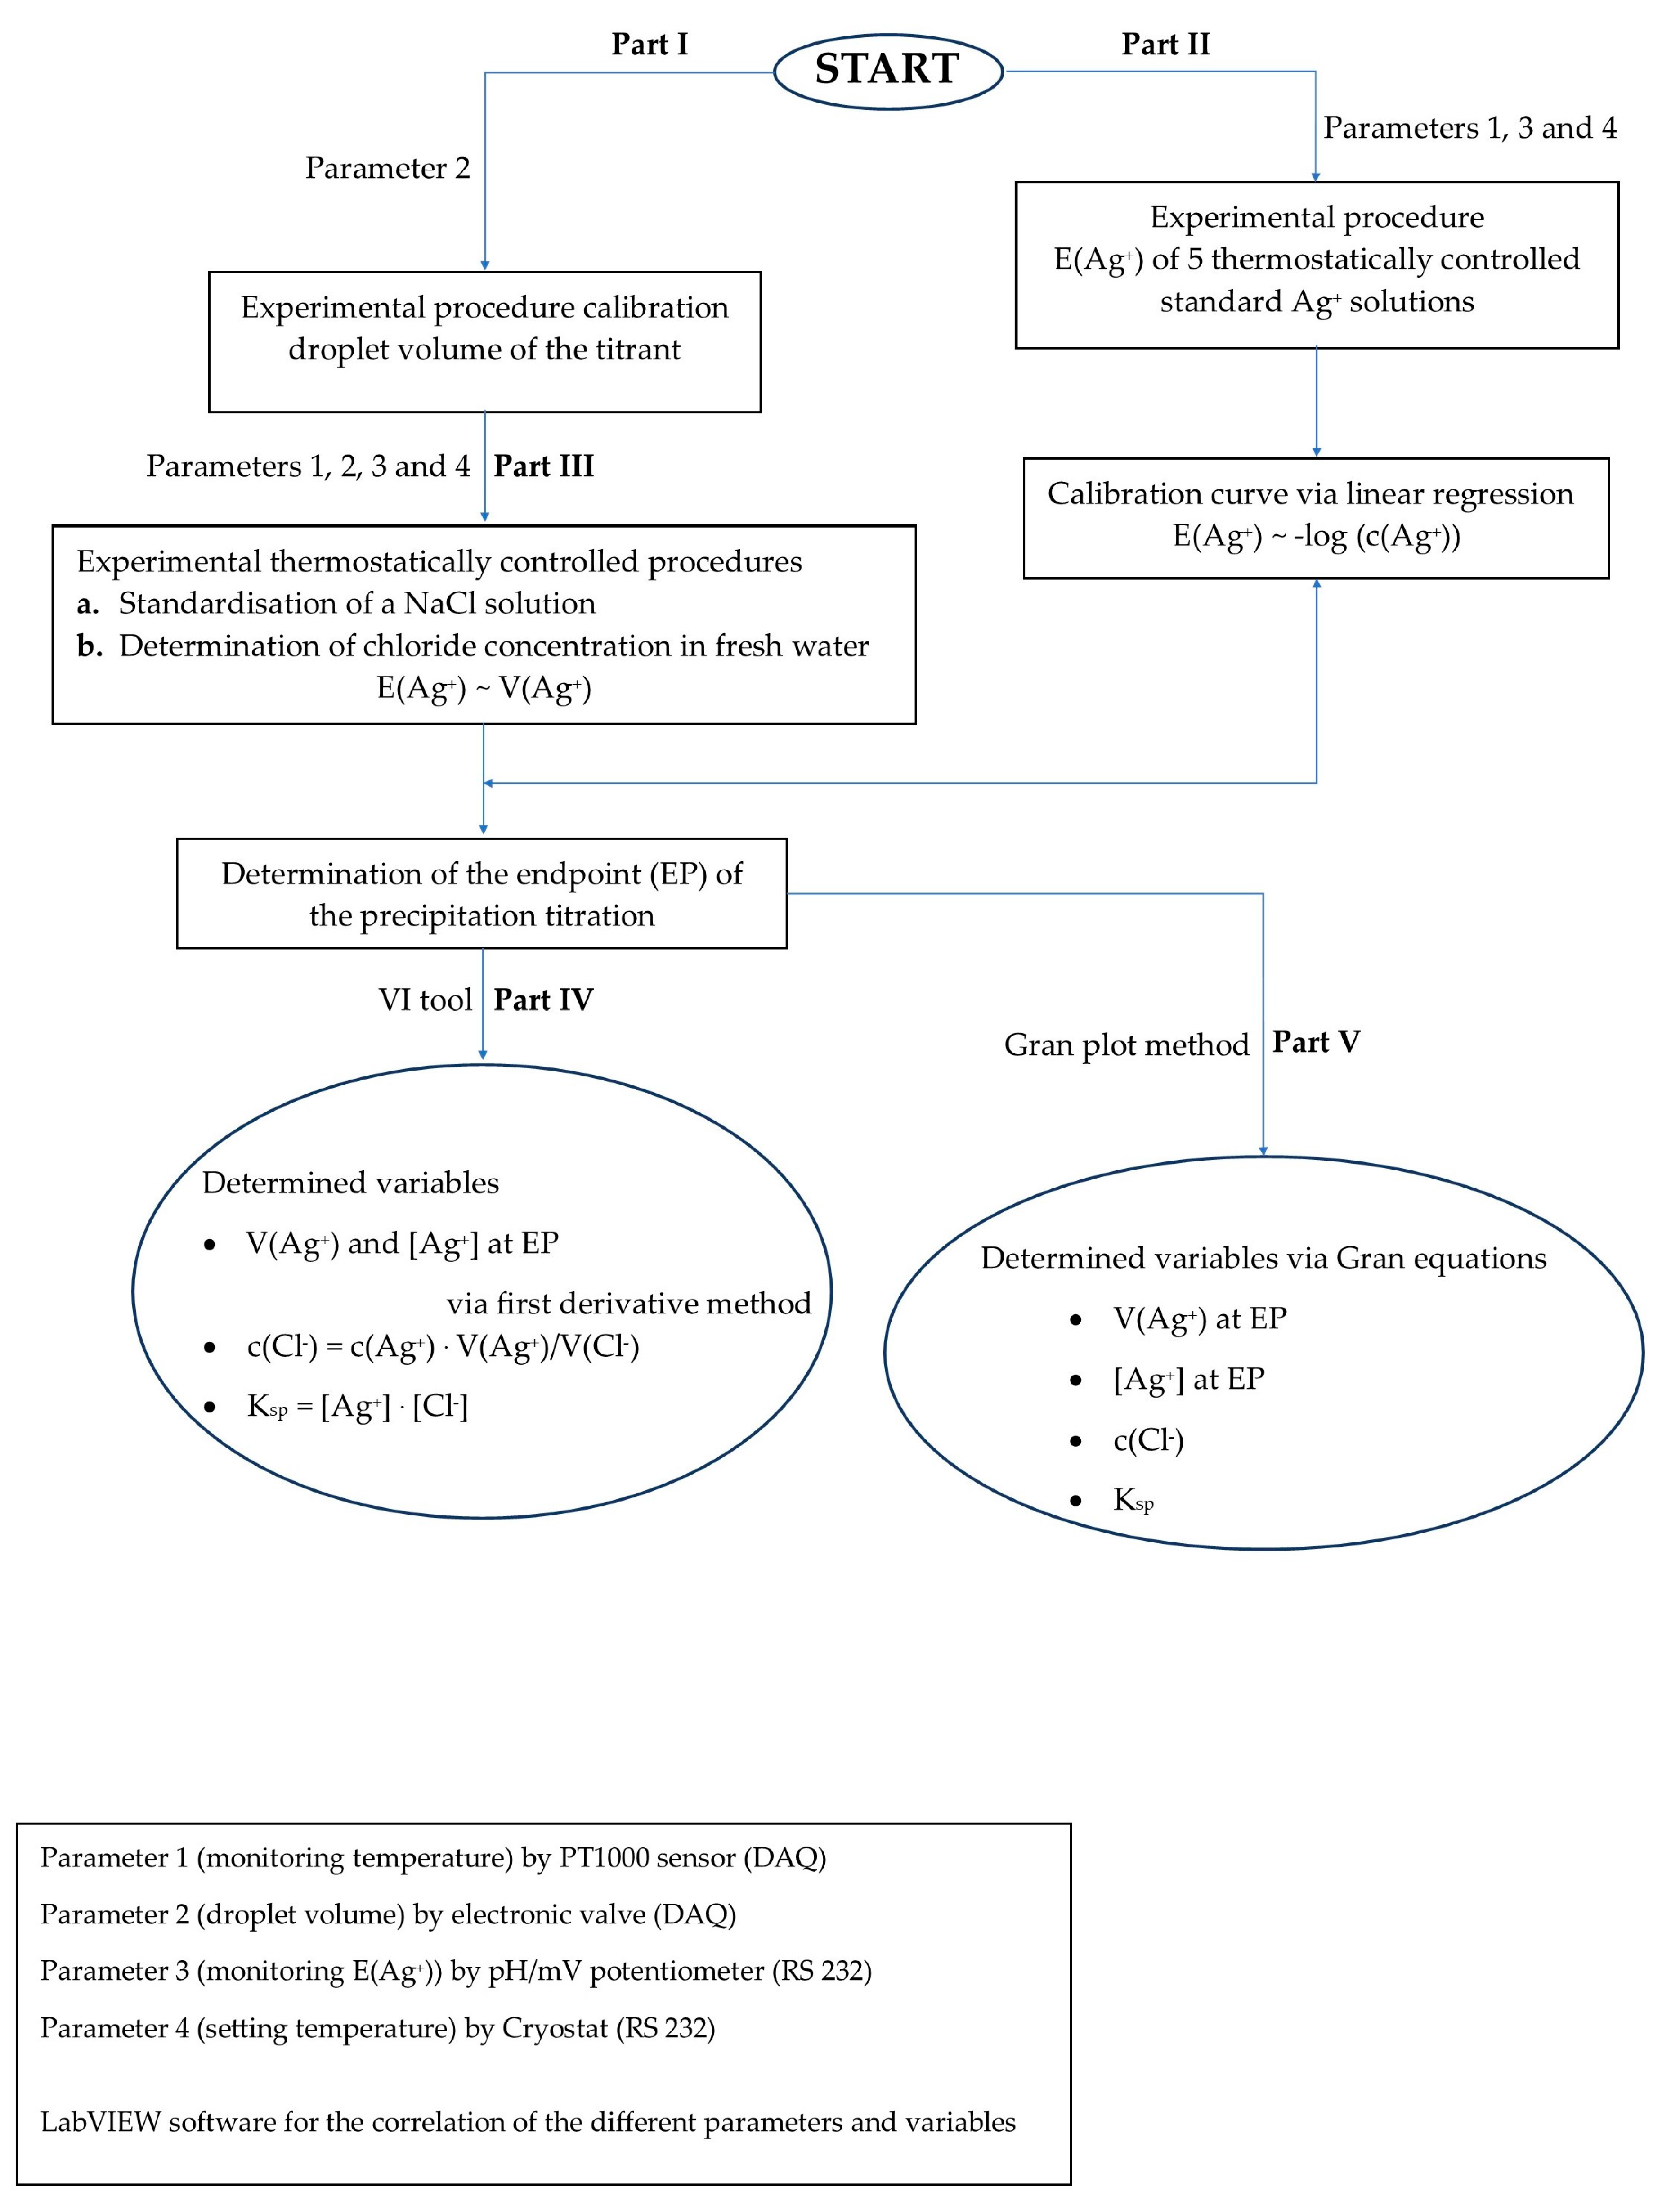
In
Scheme 1, the methodology is outlined. In
Part I of the experimental procedure, a calibration of the droplet volume was performed by the homemade LabVIEW program controlling the normally open valve connected to the burette. The valve opens and closes automatically five times while the AgNO
3 solution is dripping out. The volume poured out was read from the burette, and the program calculated the mean droplet volume from a triplicate measurement. In
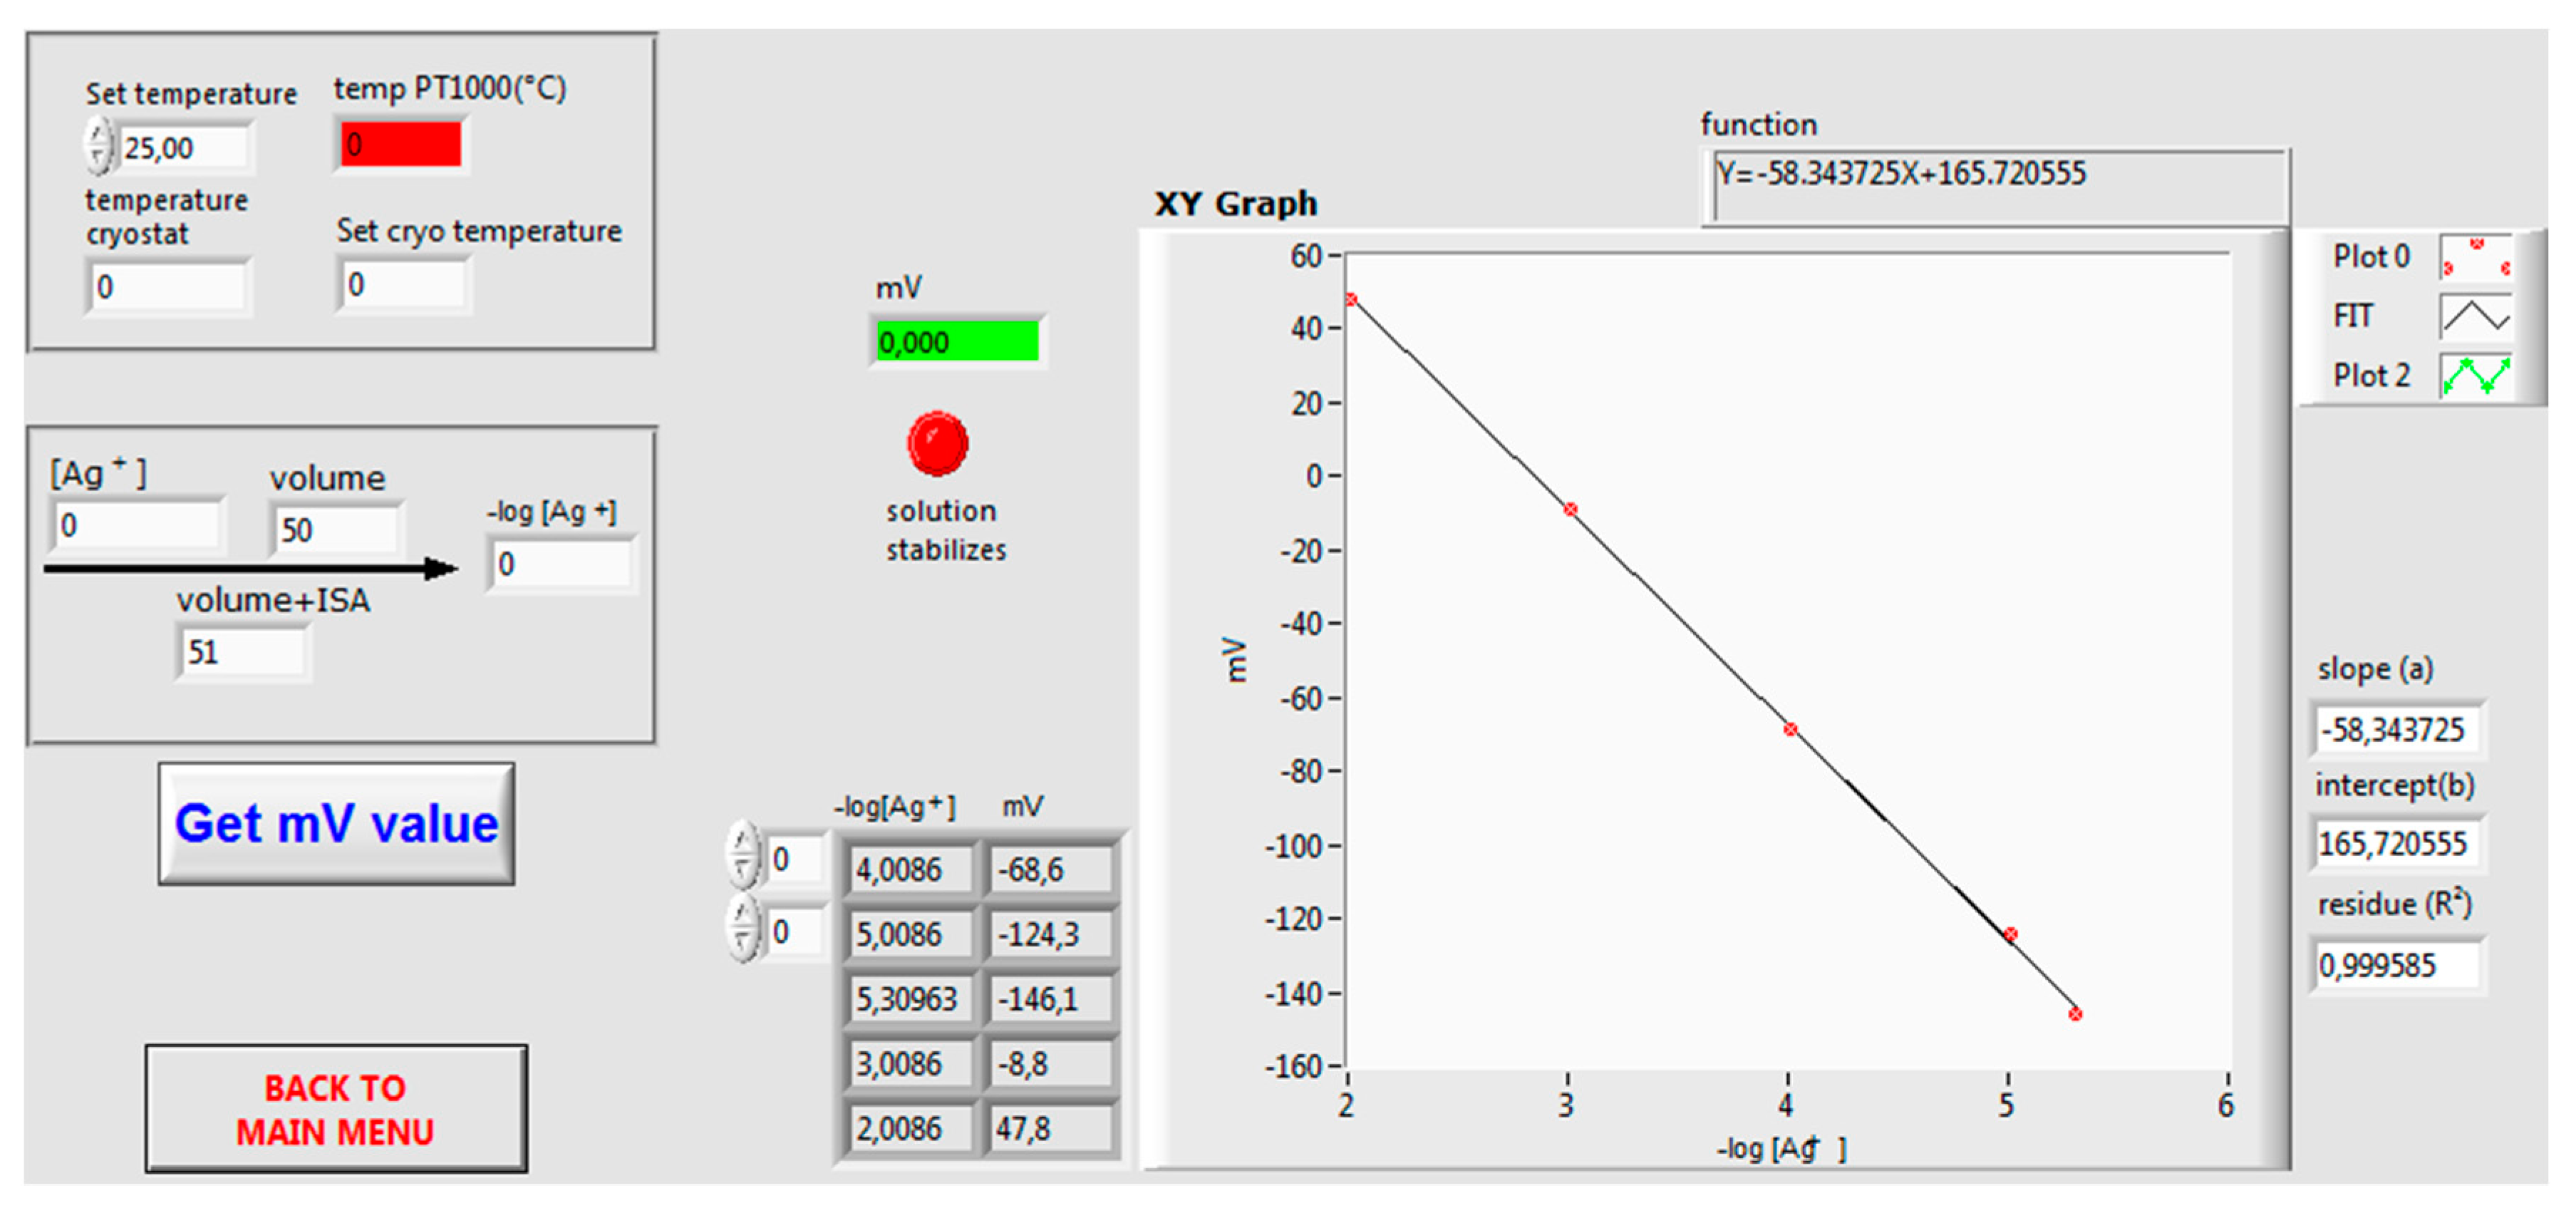
Part II of the experimental procedure, the linear regression line (Nernst equation) E(Ag
+) versus –log c(Ag
+) was constructed via the modelling LabVIEW tool, starting from the mV-measurements of five different, thermostatically controlled (298 K) standard AgNO
3 solutions adjusted with ISA (1 volume ISA/50 volumes ionic solution) (
Figure 4). The Ag
+ activity of a series of AgNO
3 solutions in the homemade double walled vessel was measured via the Ag/S
2− electrode.
Subsequently, in
Part III of the experimental procedure, 40 mL of a thermostatically controlled 0.005 M NaCl solution adjusted with ISA was titrated with an unknown 0.01 M AgNO
3 solution (
Scheme 1 Part III a). Finally, 40 mL of a filtered, thermostatically controlled sample of natural surface river water adjusted with ISA solution was titrated with the standardized 0.01 M AgNO
3 solution while stirring at a constant rate (
Scheme 1 Part III b).
The registered titration curve (E versus V(AgNO3)) was processed by the home made LabView program via the VI method (Part IV) and the Gran plot method (Part V). Particularly, in Part IV, the VI tool was used to determine the different variables, V(Ag+) and [Ag+] at endpoint (EP), c(Cl−) (via titration formula), and Ksp. In Part V, the former variables were calculated via the Gran equations and accompanying Gran plot.
3. Results & Discussion
The experimental setup for a manual precipitation titration was modified to create a semi-automated setup by using a computer configuration enhanced with a DAQ. A homemade LabVIEW program controlled the hyphenated peripherals i.e., the electronic valve for volume measurements, the temperature-dependent resistance sensor, a potentio pH/mV meter and the cryostat for maintaining a constant temperature in the homemade vessel. Hereby, different experimental conditions and variables are optimized simultaneously. In this improved environment, the analytical chloride concentration was determined in a sample of fresh river water via a potentiometric silver chloride precipitation titration as described above.
Subsequently, a standard silver nitrate solution was used as a titrant for the determination of the analytical chloride concentration in an unknown NaCl solution, and finally in fresh river water.
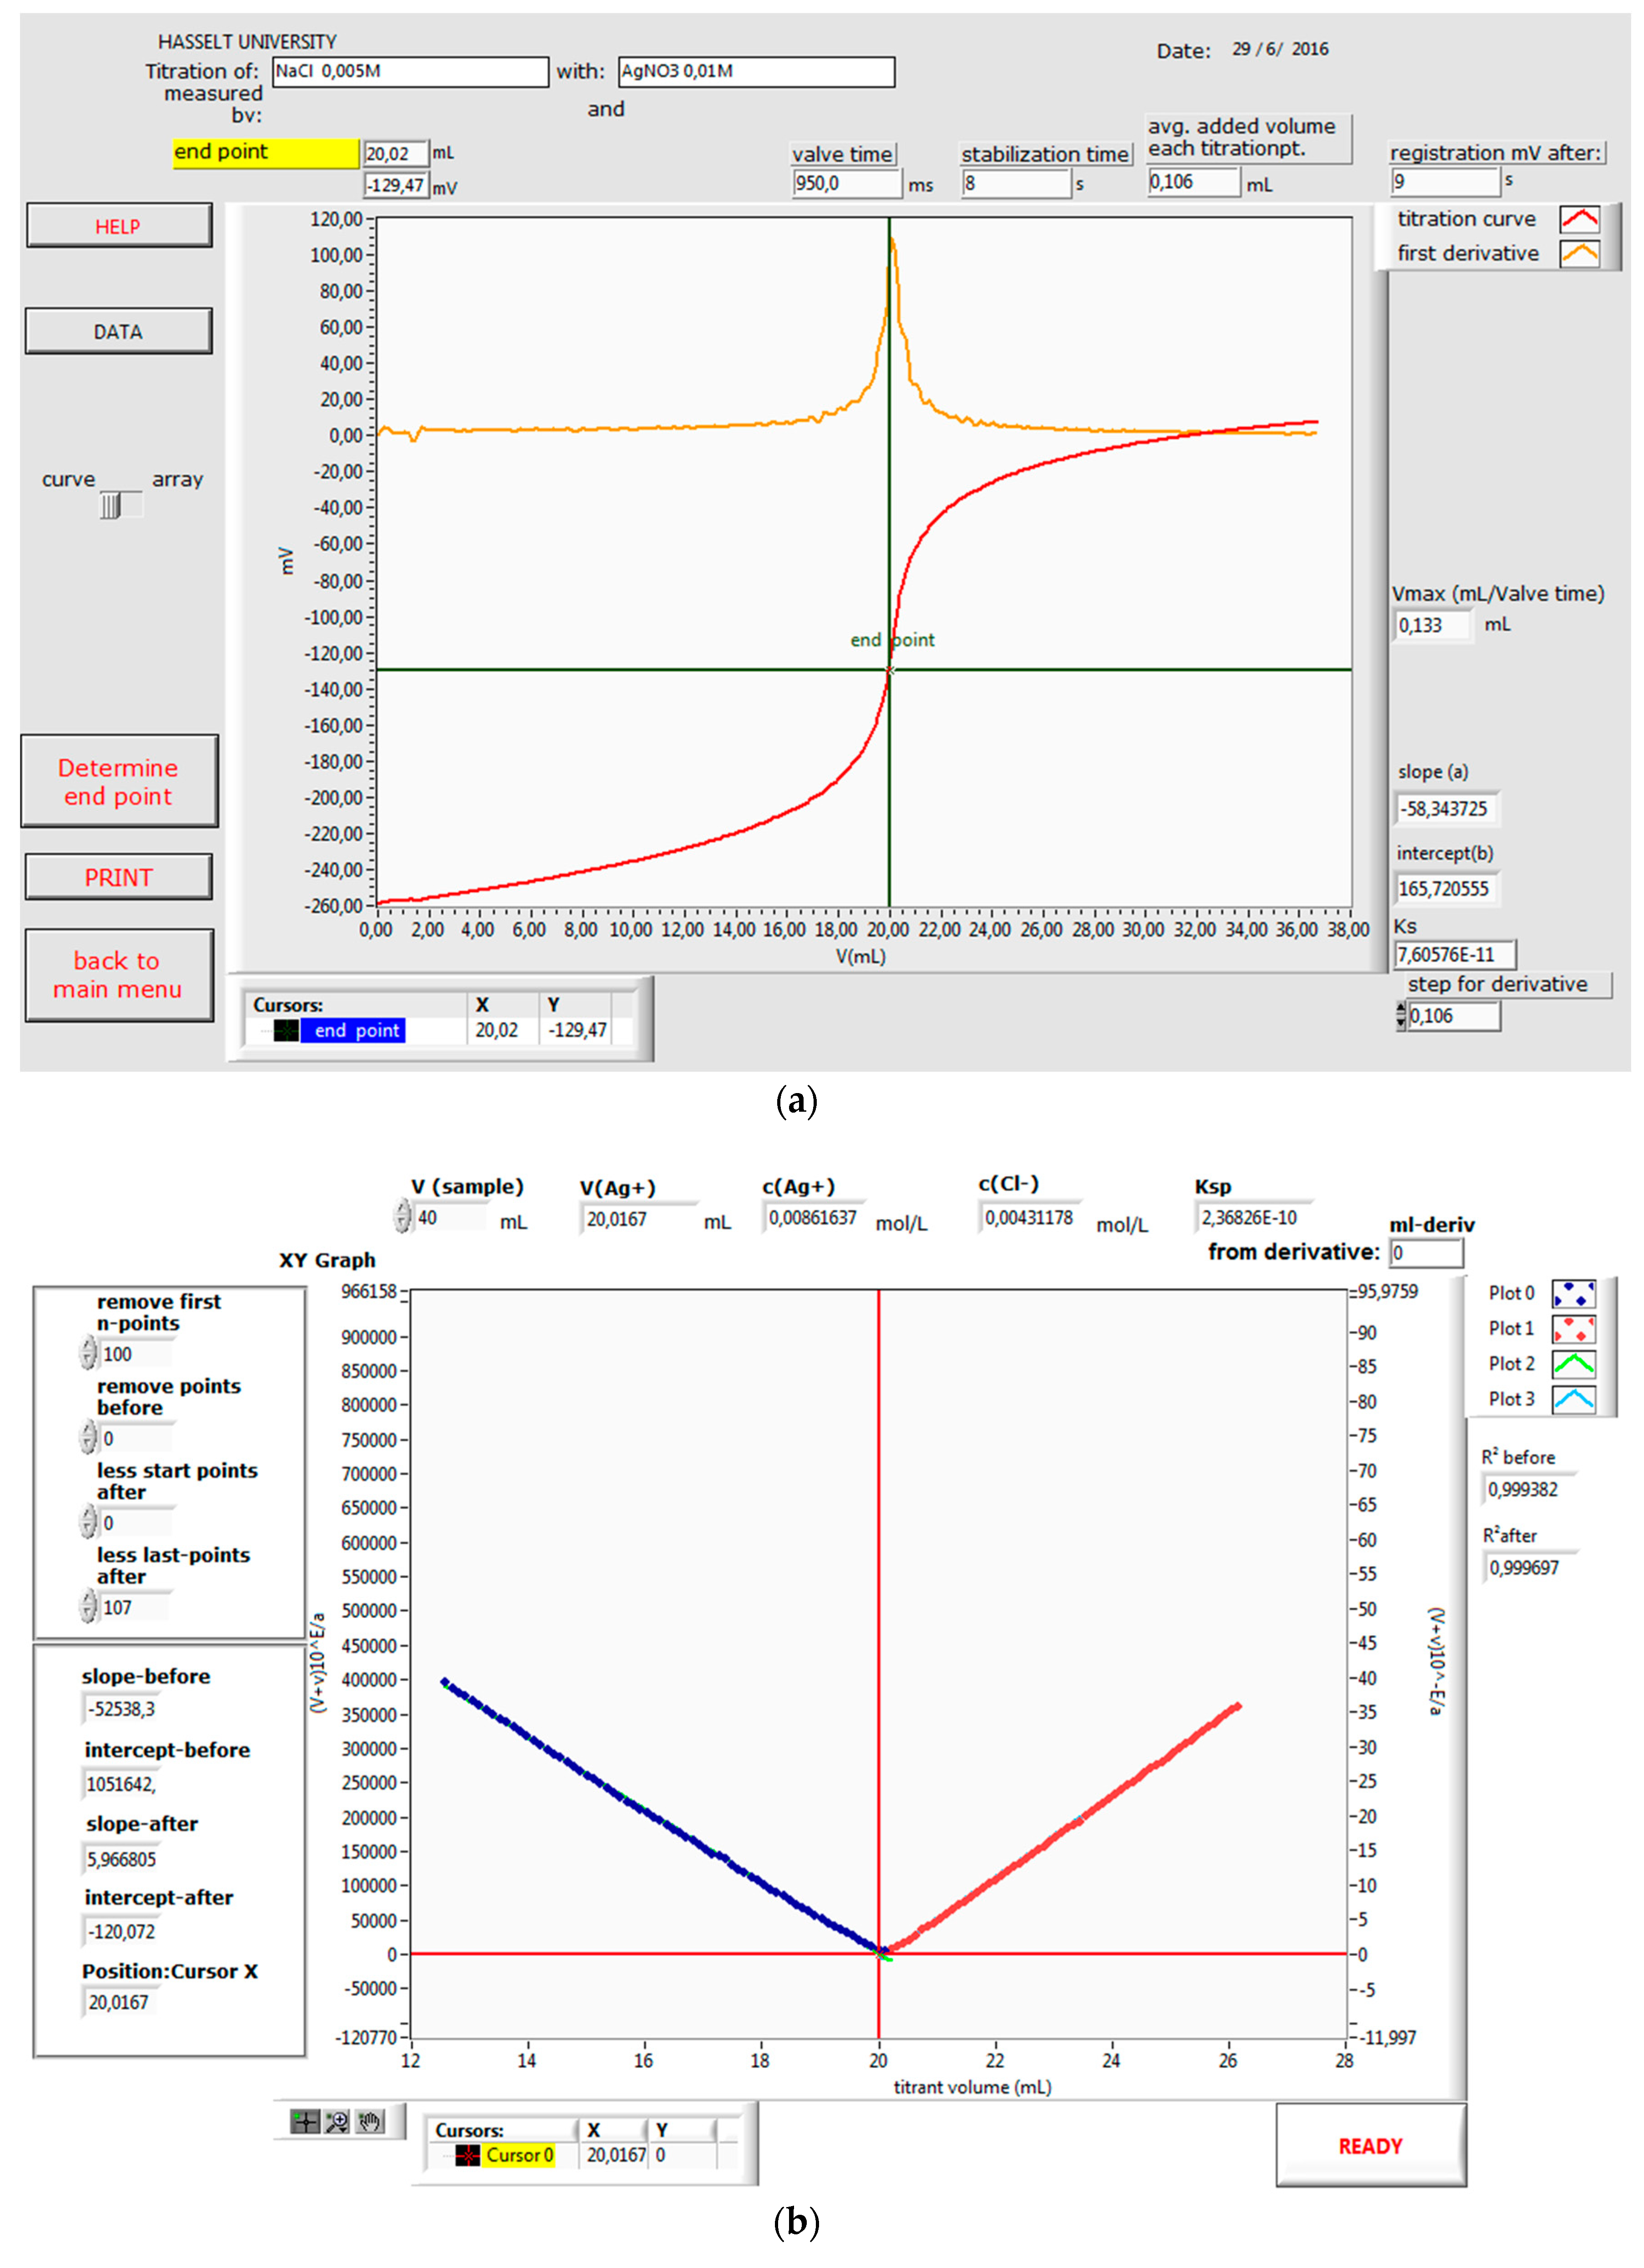
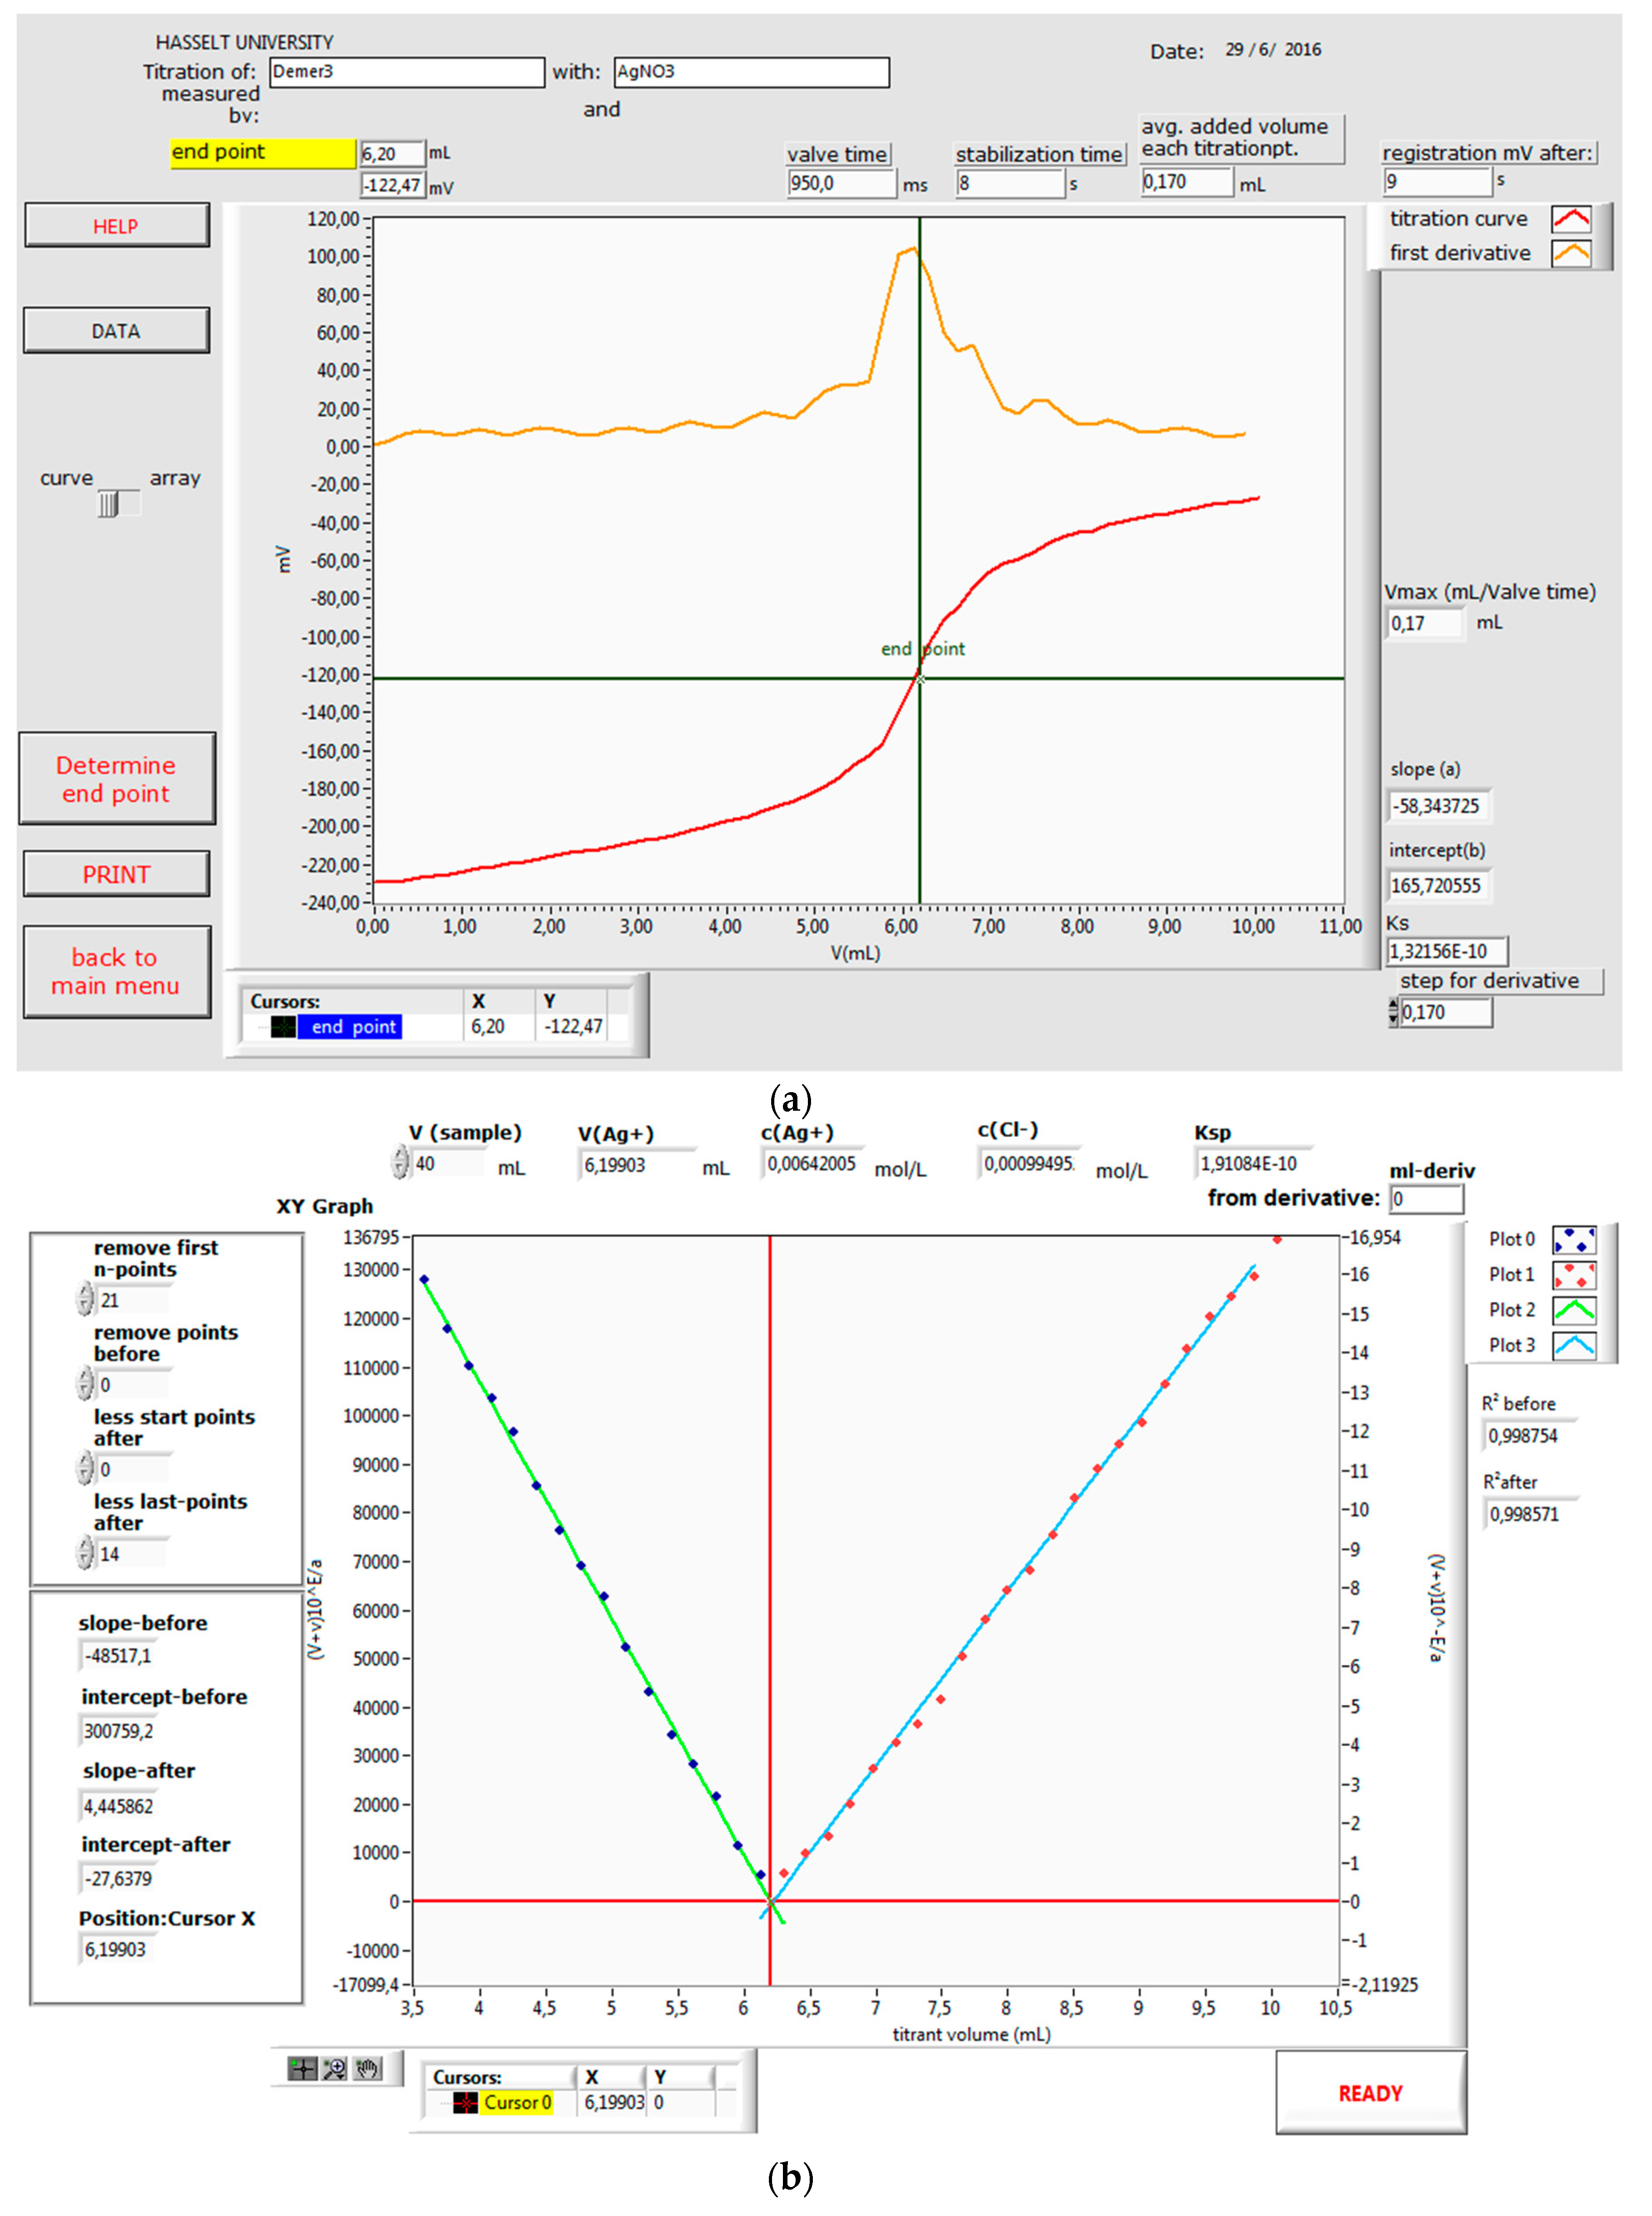
The titration curves, E (mV) versus V(AgNO
3) (mL), of the titration of an unknown NaCl solution and fresh river water, respectively (
Figure 5a and
Figure 6a) provide information on the end point derived by the numerical first derivative method, the VI tool within the LabVIEW software, as well as by the Gran plot equations in the tailor-made LabVIEW program (
Table 1 and
Table 2). The VI method is limited due to the numerical character of the derivatives leading to one single titration end point: The slightest deviation in the potential, E, at the end point of the titration has a dramatic impact on the value of K
sp. The Gran plot strategy is not subject to this drawback because of the use of a range of experimental titration data near by the end point.
Indeed, it is clear from
Table 1 and
Table 2 that the variation in the individual K
sp values derived from the Gran plot is less pronounced compared to the one from the VI method. Additionally, from the Gran plot beyond the EP, the analytical concentration of silver ions, as well as that of chloride ions, is derived.
In the
Supplementary Materials, an Excel (2016 MS Office) file is provided with different worksheets i.e., ‘Calibration curve’, ‘Standardization of NaCl’, ‘Titration of fresh river water samples’. The Gran plot equations are used to calculate the different variables i.e., the analytical concentration of Ag
+ and Cl
− and K
sp in
Table 1 and
Table 2.
In the Gran plot, the two intersecting linear regression lines before and beyond the EP are derived as follows [
15]
The equilibrium concentration of the silver ions at the EP, [Ag
+] was derived from the calibration curve (
Figure 4):
E = a·(−log ) + b
a = slope; b = the intercept
At the EP the Ag
+ and the Cl
− concentration are equal. K
sp was determined by the square of the concentration [Ag
+] and, thus:
Derivation of the linear regression line prior to the EP:
with V = initial volume of Cl
− and v = added volume of Ag
+.
Insert Equation (5) into Equation (2):
Considering Equation (3) into Equation (6):
thus:
In Equation (8), the slope of the linear curve,
Derivation of the linear regression line beyond the EP:
Considering Equation (3):
thus:
In Equation (12), the slope of the linear curve
It should be noted that no grid data are ignored in the neighborhood of the equivalence point, while at the beginning and the end of the titration curve, 60% of the data are omitted to obtain two intersecting regression lines (
Figure 5b and
Figure 6b) with optimal correlation coefficients [
16]. K
sp is calculated by Equation (8). Additionally, the analytical concentration of silver ions, as well as the chloride concentration, is calculated via the slope and intercept of Equation (12), respectively. Alternatively, the chloride concentration can be calculated by means of the volume titrant at the intersection of the two linear regression lines in the Gran plot.
The values of K
sp calculated via the LabVIEW VI method and those calculated via the linear regression line prior to the EP in the Gran plot show significant differences (
Table 1). However, the values in far-right column (
Table 1) are more consistent (lower standard deviation) in the three experiments. Based on these observations, the Gran method is preferred for the quantitative determination of the chloride concentration in fresh river water (
Table 2). This is evidenced by the consistency of the K
sp values in the rightmost column. Additionally, due to these findings, the analytical concentration of the titrant (c(Ag
+)) has been determined with great certainty via the linear regression line beyond the EP in the Gran plot. Three constraints in the laboratory test conditions were taken into account: The accuracy of the potentio mV meter (±0.3 mV), the limitation of the Ag/S
2− working electrode to measure at very low [Ag
+]
EP (±1 × 10
−5 M), and the ambient temperature surrounding the semi-automated setup that could influence the measuring results. Moreover, the assessment of the reliability of the LabVIEW VI method versus the Gran method revealed that since the exact (bio)chemical composition of fresh river water was unknown, the presence of e.g., possible interfering ions could be ignored.
Consequently, the calculated analytical chloride concentration in fresh river water is acceptable with good certainty.
4. Conclusions
In the present study, a semi-automated setup for potentiometric precipitation titrations was proven to be a valuable analytical tool in ambient laboratory conditions. The multiple characteristics of a series of data can be monitored in real time thanks to the versatile features of the low-cost multifunction DAQ in an enhanced computer configuration. The presented method is a unique combination of a traditional potentiometric setup design for a precipitation titration of chloride ions with a silver ion solution and an advanced automated setup. Moreover, our novel method enables the simultaneous determination of a variety of variables in one single experiment.
Here, the chloride concentration in an unknown NaCl solution and fresh river water is determined to benchmark the numerical VI tool integrated in the LabVIEW software with a homemade LABVIEW Gran plot program. The values of Ksp calculated via the LabVIEW VI method and those calculated via the Gran method show significant differences. Based on these observations, the Gran method is preferable for the quantitative determination of the chloride concentration in fresh river water. Additionally, the analytical concentration of the titrant (c(Ag+)) was determined with good certainty.
The chloride concentration was found to be far below the threshold value, and thus, in accordance to the Council Directive of the European Communities concerning the optimal quality for natural surface water. In other words, the Scheldt river basin district in the area of the Demer river still does not suffer from salinization.
Conclusively, the procedure benefits from the versatility of the DAQ as a controlling and monitoring low-cost device, and the assets of the homemade LabVIEW program.
The presented semi-automated setup paves the way for the use of controlling peripherals to acquire series of data, as well as for homemade programming in LabVIEW.

 ,
, 


