Inequality in Access to Drinking Water and Subsidies between Low and High Income Households in Mexico City

1
Department of Economics, Autonomous Metropolitan University, Azcapotzalco University Av. San Pablo No. 180, Col. Reynosa Tamaulipas, Del. Azcapotzalco, Mexico City C.P. 02200, Mexico
2
CONACYT-UAM, Area of Environment and Growth, Economics Department, Autonomous Metropolitan University, Azcapotzalco Unit. Av. San Pablo No. 180, Col. Reynosa Tamaulipas, Del. Azcapotzalco, Mexico City C.P. 02200, Mexico
*
Author to whom correspondence should be addressed.
Water 2018, 10(8), 1023; https://doi.org/10.3390/w10081023
Submission received: 30 June 2018
/
Revised: 20 July 2018
/
Accepted: 30 July 2018
/
Published: 2 August 2018
(This article belongs to the Section Water Use and Scarcity)
Abstract
:Economic and population growth in Mexico City (CDMX) is the main cause of an increase in water demand against a naturally limited endowment, which increases the gap between water demand and supply. In a water scarcity environment, households are facing pressure to maintain their involvement in the city’s only operating body, the Water System of Mexico City (SACMEX) total supply. The objective of this work is to measure the inequality in the distribution of drinking water and water subsidies between households connected to the public network of CDMX in order to generate objective indicators of the phenomenon. Having such information provides a baseline scenario of the problem and allows for the delineation of a policy covering the minimum levels of well-being in the supply of drinking water that is appropriate for the most important city in the country. The method consists of measuring inequality through continuous variables estimating the Lorenz curve, the Gini coefficient, the targeting coefficient and elasticity in water consumption and in water subsidies among households in CDMX. Data comes from a household survey carried out in 2011, Consumption Habits, Service and Quality of Water by Household in Mexico City (EHCSCA). Results show that drinking water and subsidies present a regressive distribution, benefit high-income households and, to a lesser degree, the poorest households in the city and highlight the urgency and importance for SACMEX to redefine its policy on water distribution, fees and subsidies. The present study’s scope can contribute to the monitoring of the distribution of drinking water and of subsidies among household groups. The study justifies that the indicators employed in this work can be used and are recommended as a valuable tool in water management, especially in a dynamic environment.
1. Introduction
As drinking water supply (water from here on) is gradually increasing all over the world, in numerous countries, mainly in emerging and less developed ones, such supply continues to be a serious problem [1]. Numerous urban areas in developing countries face an imbalance between household water demand and a supply that is reliable and safe for consumption [2]. At the same time, economic income for the provision of the service and the subsidies of the available programs are, in many cases, not sufficient to adequately maintain water infrastructure and to ensure the quality and quantity of drinking water [3].
Various studies have demonstrated that improvement and access to water services and sanitation increase the well-being of households, especially the poorest ones, by reducing mortality in general, as well as diseases and conditions such as malnourishment, rickets, reduced work productivity, among others [4,5]. Other studies on drinking water services in emerging or less developed countries, point out that, although progress is observed worldwide in terms of a greater access to drinking water through the development of infrastructure [6], there is a growing interest, mainly among consumers, in having access to improved water sources and greater continuity in the service [7]. There is a relative abundance of international work examining improvement in access to running water [8,9,10]. However, studies examining water distribution among households and household groups are scarce.
Traditionally, water access is measured by the percentage of the population connected to this service, a relation that provides a picture of the supply coverage situation but that is not enough to characterize the quality to access and associated inequalities. In order to go further in the analysis of this topic, it is necessary to characterize the inequalities that exist in the effective distribution of water among people or households. Some studies propose to highlight the variables associated with the fact that a household faces certain elements in its surroundings, which enables us to identify the determinants of the distribution of water resources [11,12]. The levels of inequality obtained can be compared in time and space but can also be evaluated to determine other dimensions of inequality, such as income or wealth. In general, “inequality” is considered a socioeconomic concept [13] and social inequality as “the difference in income, resources, power and status inside and among societies.”
The few studies on water distribution among households show that access to water is, in general, unequal when comparing its distribution among different groups of society [14]. As with other natural resources—such as soil, woodlands and so forth—water distribution is not equitable among different segments of the population and it is envisaged that water scarcity and inequality will rise in the future [15].
Water faces numerous critical management issues in order to ensure that people have equitable access: growing scarcity, lack of infrastructure, limits on monetary resources, among other reasons, are elements that prevent more people from benefiting from a fair water supply, a reduction in poverty and a promotion of growth, guaranteeing a continuous water supply [16]. A series of research projects has centered on these topics in recent years [16,17,18,19,20,21,22]. The research notes that the management of water resources has critical implications in the daily lives of people and above all in economic development and social well-being [22,23,24].
In most papers on inequality, authors use the Gini index and the Lorenz curve. In what relates to the domestic use of water, Wang et al. [16] developed a Gini coefficient to measure inequality in the use of China’s Yellow River water resources among urban and rural populations. Berthe [25] did a study on the distribution of water at the micro-level focused on two regions in Brazil, the study was based on raw data collected from a survey and used the Lorenz curve and the Gini index to measure inequality in access to water and sanitation services among households. Yang et al. [26] analyzed socioeconomic inequalities associated with access to drinking water, for which concentration indexes are calculated based on the socioeconomic state of the household in binary variables that characterize access to safe water and from an improved source. The aforementioned papers highlight that a significant indicator of water distribution is required in order to ensure equity, its measurement enables adequate decision making on which policy to apply, since, without a scientific method of measurement, water usage may always be subject to manipulation. Other studies show that there is a disparity in water supply among different cities and households, which could be due to infrastructural limits, policies, or access to natural water resources [27]. The examination of existing inequality can contribute substantially to understanding the current scenario and to plan policy interventions for a better and more equitable future.
Worldwide, particularly in less developed countries, drinking water, basic sanitation and electricity operating bodies subsidize consumption for households that require their services [28]. One of the main arguments for offering such subsidies is that they improve the socioeconomic well-being of households, especially the poorest ones, by facilitating access to these type of services and improving the redistribution of government resources [29]. As a counterpoint, it is often considered that subsidies to households generate inefficiency in the use of resources and financial imbalances in operating bodies [30]. Within such a framework, this has constantly provoked controversy on both sides [28].
There are a variety of studies in which the impact of subsidies in drinking water and basic sanitation sector have been analyzed based on the fee structure and their impact on poor households [28,31,32]. These studies concentrate on examining the magnitude of the subsidy [33], comparing its efficiency in the form of social fees [29,34], verifying its impact on the number of connections [30,35] and measuring its impact in water consumption, which in general ends up being inequitable when comparing its distribution among different groups of society [14].
The number of subsidies that are given to users of public services can represent an opportunity cost for public spending and for the operational and maintenance costs of the businesses providing water services. For example, Kochhar et al. [14] estimate that the quantity of drinking water subsidies worldwide for the year 2012 accounted for an estimated value of 456 trillion dollars—this represents 0.6% of the Gross Domestic Product (GDP) worldwide. Furthermore, the increase of water subsidies in vulnerable sectors, such as low-income households, contributes to reductions in poverty and improves well-being.
This article estimates the Lorenz curves, Gini coefficients [36] and elasticity as measurements of inequality in the distribution of water usage among households and in domestic water subsidies in CDMX. The targeting indicator is applied to measure inequality in the distribution of subsidies. The proposed indicators constitute an implementation of measures that are traditionally used to measure income and the distribution of land and this work is concerned with introducing it to the above variables. Studies such as that by Cullis, J. & Van Koppen, B. [37] conclude that it is possible to apply the Gini coefficient to measure distribution and benefits of the real usage of water. The estimation of the indicators mentioned above enables the dimensionalization of the inequality of water distribution and among household subsidies, taking into account continuous variables on drinking water and on water subsidies. These methods allow the measurement of inequality to the lowest scale possible, the household.
The understanding of water distribution and of subsidies contributes to the debate in the literature on the multidimensionality of well-being, by showing that income is insufficient to represent the well-being of social groups and associated inequalities [38]. Additionally, it can help to identify and design appropriate public policies that generate an improvement in households with the lowest incomes, as well as in the recovery of maintenance costs, looking to make the provision of the service sustainable [3].
Drinking Water, Fees and Subsidies in Mexico City Households.
CDMX is located in an area of 1495 km2 inside the megalopolis (Mexico Valley Metropolitan Area), demarcation that registers 8,851,080 inhabitants and generates 16.5% of Mexico’s total production [39]. However, the immense capacity to generate aggregated value in CDMX, income inequality in a great number of households and the consequent levels of poverty, are considered critical topics [40].
Household water supply in CDMX is the responsibility of one sole public operating body called the Water System of Mexico City (SACMEX), which has a household supply infrastructure coverage of close to 98% [39], meaning that approximately 48 thousand households are not connected to the water supply network, obtaining the resource through mobile water tanks, transporting it from distant areas and purchasing bottled water.
The public water supply registers an average flow of 32.3 m3/s (1018 hm3) of which 17.28 m3/s are effectively consumed by households [41]; in volume, this translates to 545.1 hm3 a year. This volume represents an approximate monthly consumption of 23.8 m3 per household and a per capita water usage of 164.1 daily liters, an inferior value to the calculations estimated by other methods and which suggests a certain rationing in the water usage among Mexico City’s inhabitants.
Discounting the effective consumption of households from the SACMEX supply, there is a differential flow of 15.02 m3/s of which a minor proportion is destined for commercial use and services; most of it is wasted in the distribution network, showing that the system’s management and maintenance is inefficient, inadequate and insufficient.
According to a survey [41], households report grave inefficiencies in the water service received, highlighting the supply’s elevated discontinuity, the lack of credibility in the measuring of water supplied and profound mistrust in the quality of the received resource, in addition to noting an obsolete infrastructure that lacks adequate maintenance.
Furthermore, in Mexico, water service fees are independent and established in each municipality [42]. The policy on water fees in CDMX has moved from giving it to households practically for free to the recovery of an increasing share of their operational costs.
Through fees, SACMEX applies a policy of water consumption subsidies to all households in CDMX and its design favors to a greater extent low-income household. Subsidies have always been part of water fees in CDMX.
Subsidies’ level in 2011 are 380 million dollars which are targeted according to the type of family household, these get classified by considering the Neighborhood Development Index, which in turn is determined by taking into account the income of the households and the cadastral value of the houses [42]. The targeting is based on the rating of the neighborhood in which the house is located; there are four types of neighborhoods that define the percentage of subsidy: (i) working-class; (ii) low; (iii) medium; (iv) high. The subsidy is highest for the working-class neighborhood and it gets decreased until it gets to the lowest, which corresponds to the high neighborhood. Clearly, the applied subsidies demonstrate a direct relation with the poverty level of the household and an inverse one with the volume of water consumed. However, it should be noted that all households benefit from the subsidy, albeit in a differentiated way.
Six sections, including the introduction, make up the present article. In the Section 2, the method and data collection on inequality measurements are presented. In the Section 3, the obtained results are offered. In the Section 4, Section 5 and Section 6, the discussion, including conclusions and recommendations for an improved public policy, are pointed.
2. Materials and Methods
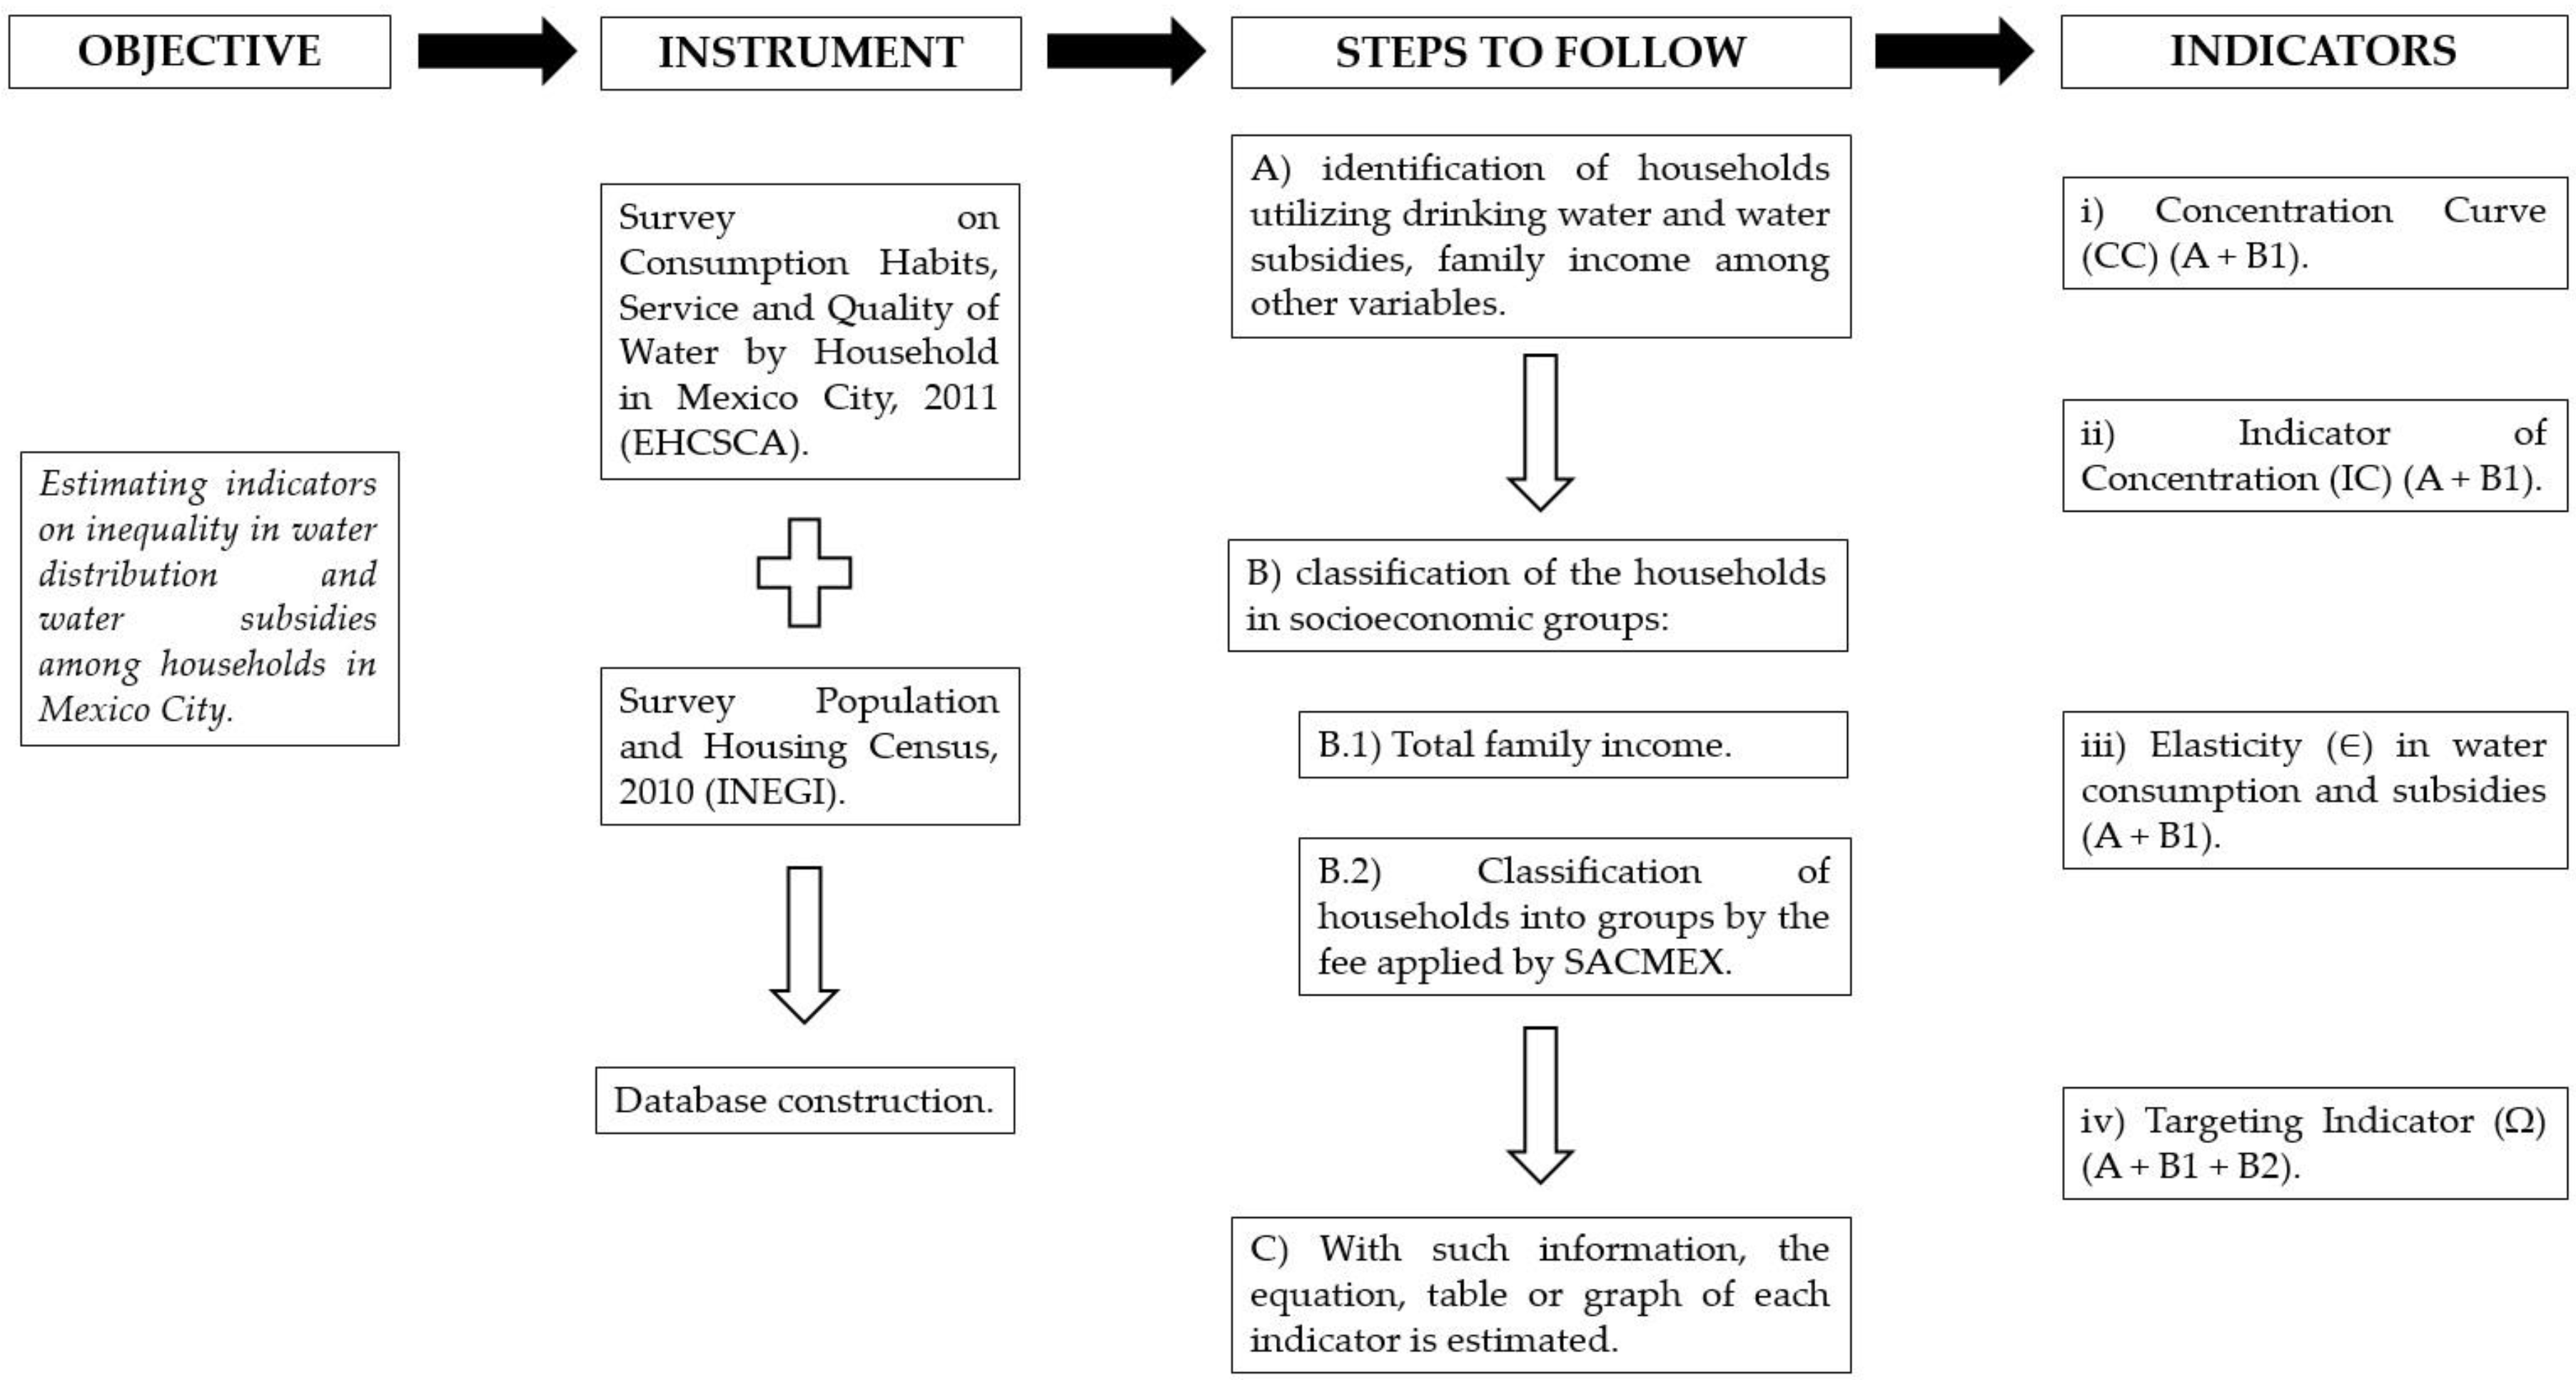
The method consists of estimating indicators on inequality in water distribution and water subsidies among households in Mexico City: (i) concentration curve (CC); (ii) indicator of concentration (IC); (iii) elasticity (∈) in water consumption and subsidies due to changes in the size of the socioeconomic group of households, (iv) targeting indicator (Ω). These four indicators are recommended by the specialized literature [43,44].
Three stages should be followed in order to estimate the inequality indicators (see Scheme 1): (i) identification of households utilizing drinking water and water subsidies, family income among other variables (ii) classification of the households in socioeconomic groups; the criteria is the total family income by proxy as a well-being measurement and classification of households into groups by the fee applied by SACMEX and (iii) with such information, the equation, table or graph of each indicator is estimated [45,46].
2.1. Concentration Curve and the Indicator of Concentration
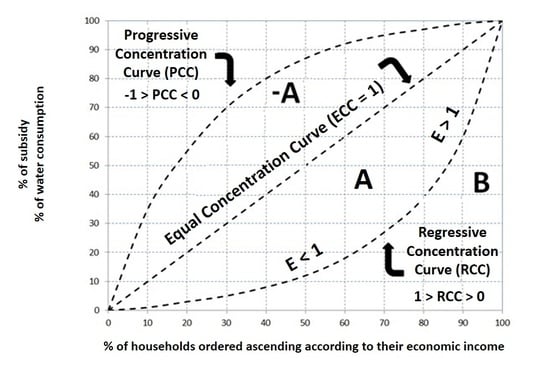
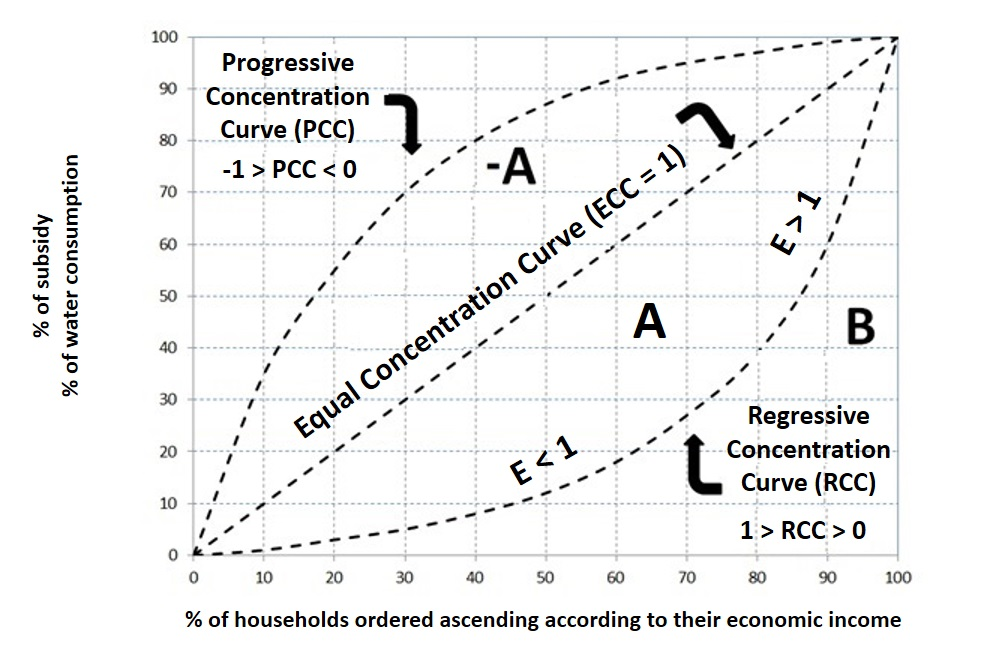
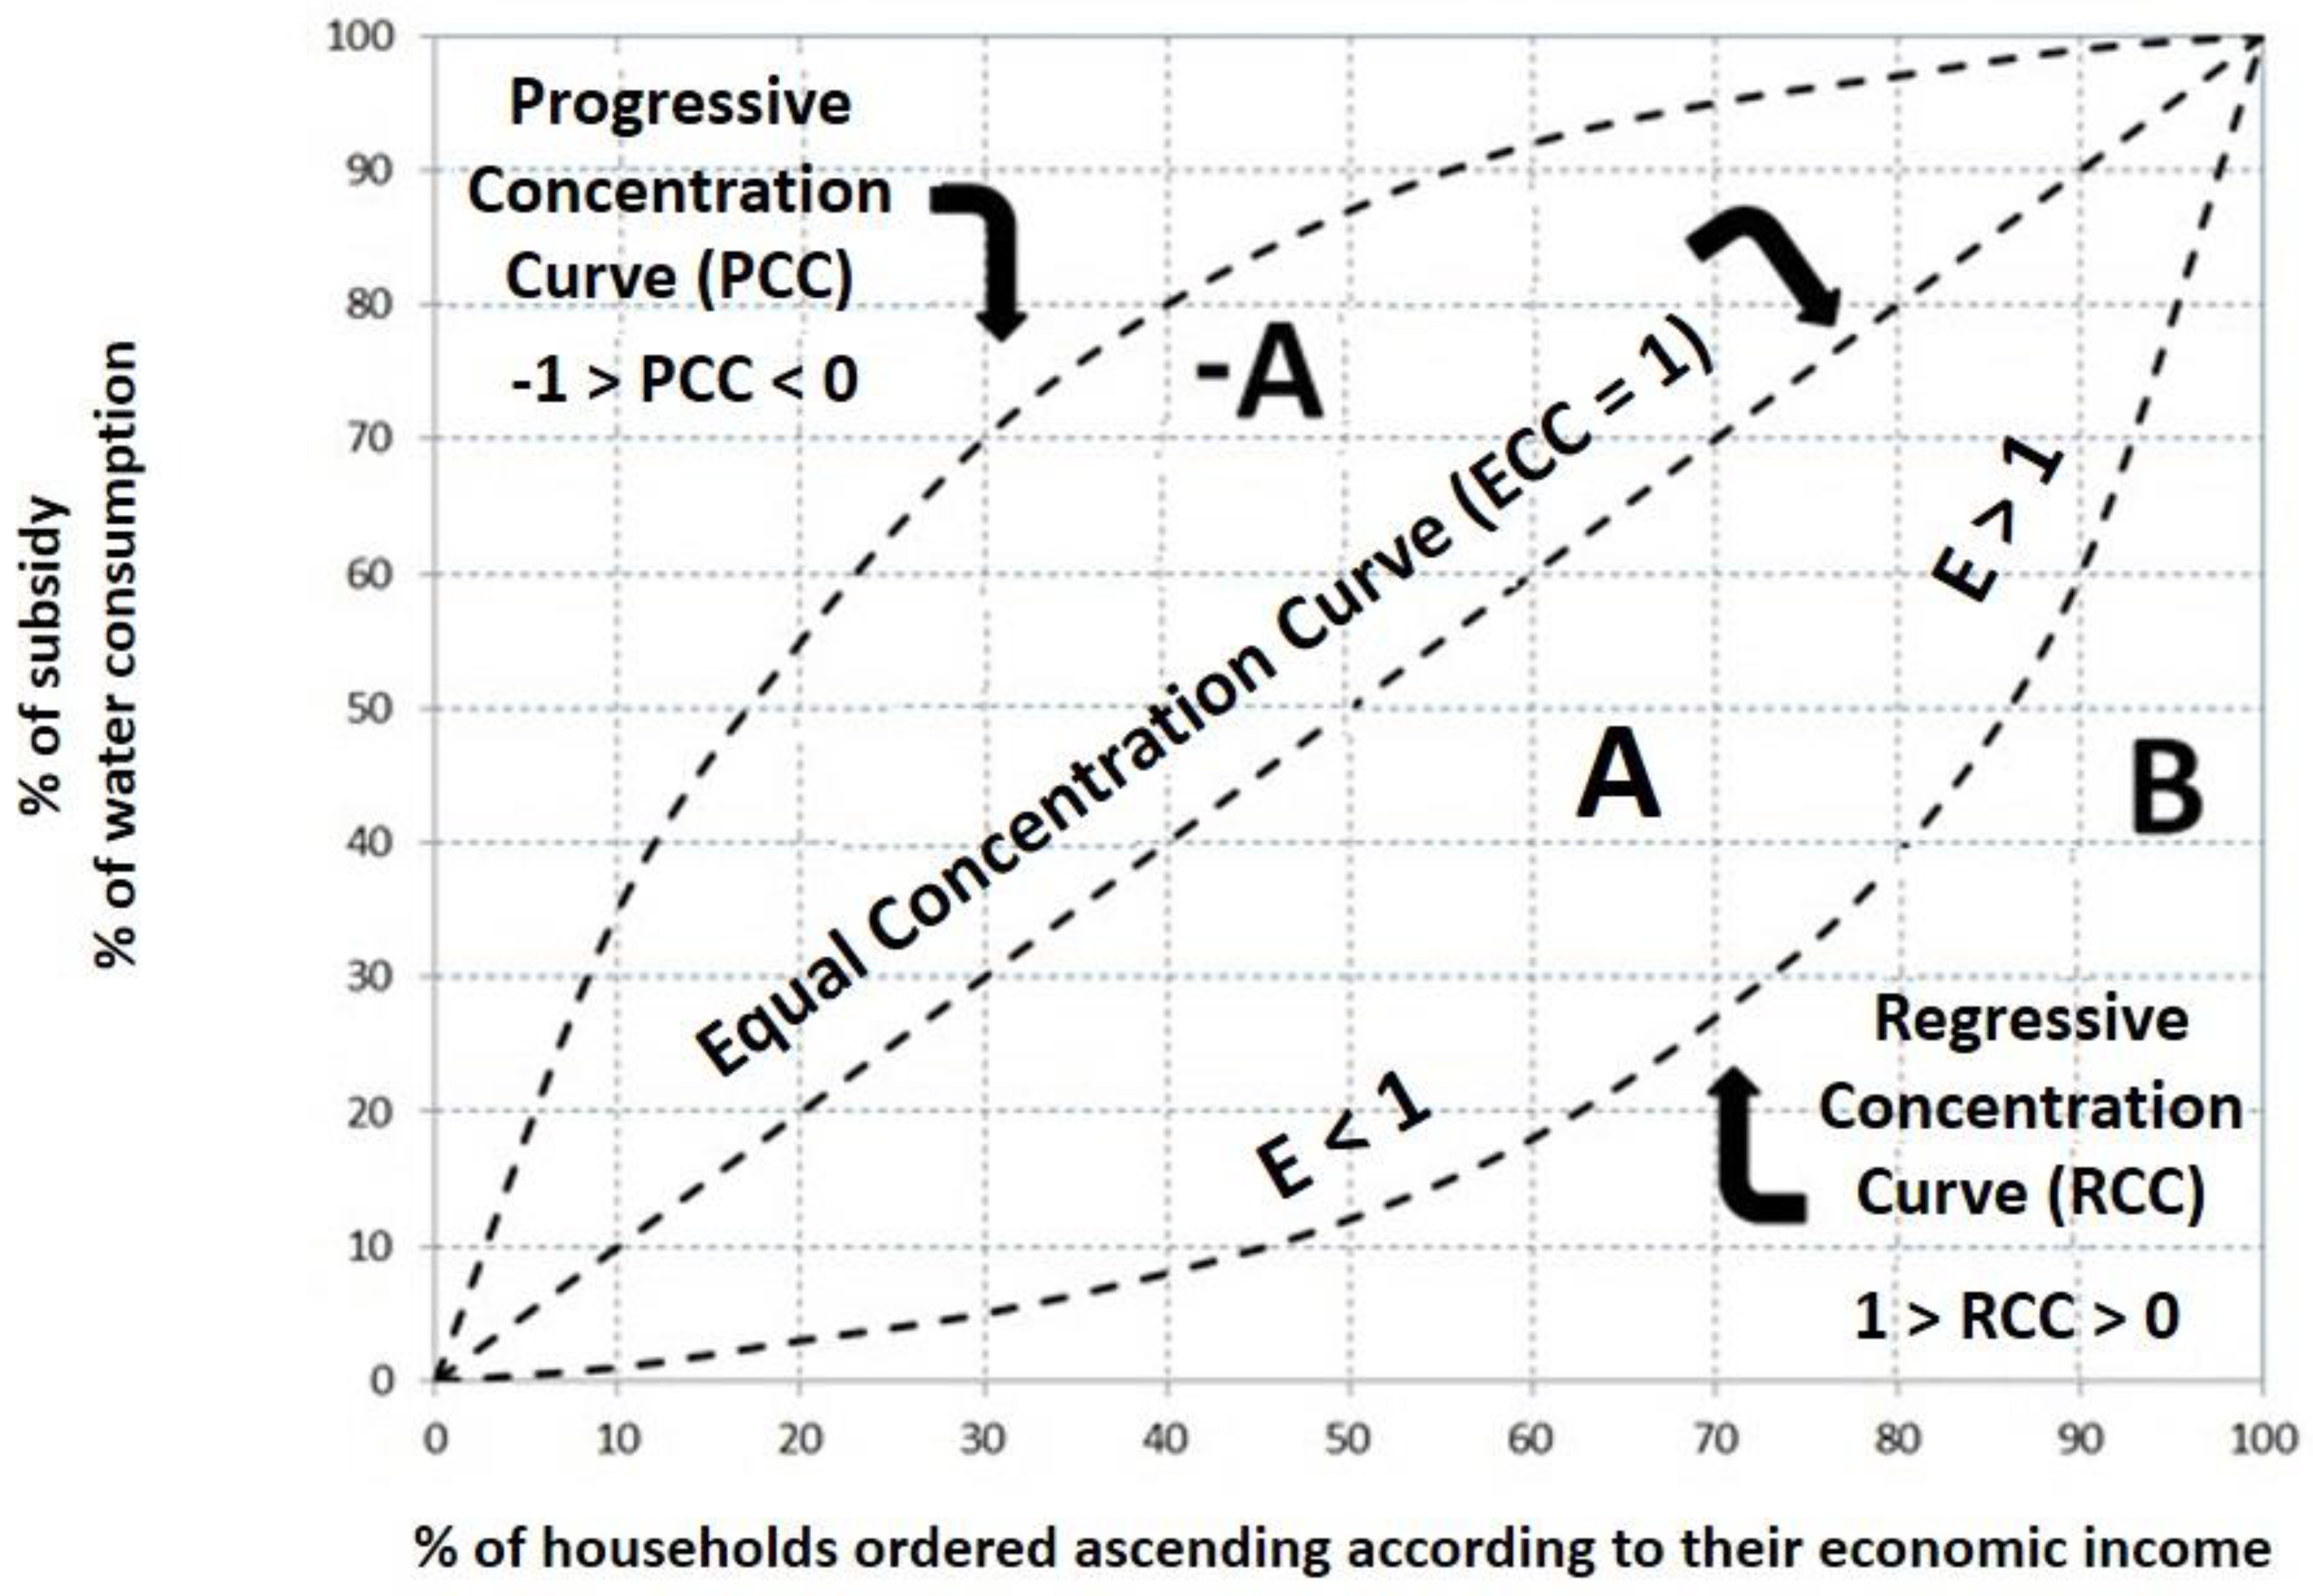
In order to measure inequality in water distribution and in water subsidies between households, the literature suggests estimating the indicator of concentration (IC) associated with the concentration curve (CC). The IC is similar to the Gini coefficient associated with the Lorenz curve, constructed from the income distribution of households (The Lorenz curve relates the proportion of accrued income with the proportion of accrued population. This curve is a graphic representation of income distribution and compares with a straight line of 45° that joins the origin (0,0) with the point (100,100), denominated perfect equality curve, which reflects an equal relationship between the proportion of individuals and that of accrued income. The further away the Lorenz curve is from the perfect equality curve, the more unequal the income distribution will be.). In this case, the CC corresponds to the distribution function accrued by water consumption and subsidies, maintaining the initial order of households in an increasing way by income, while the IC is defined as the area between the concentration curve and the equal concentration curve (ECC) (Figure 1).
It is important to note that, contrary to the Lorenz curve, the CC can be located above the ECC and thus the indicator of concentration can vary between −1 and +1. In this case, negative numbers indicate a favorable distribution to the poor (pro-poor/Progressive Concentration Curve—PPC-), while the positive values indicate a distribution that favors higher income households (pro-rich/Regressive Concentration Curve—RCC-) [47]. In this way, the indicator of concentration can be obtained with the following equation:
IC = A/A + B; −1 < IC < +1
2.2. Elasticity (∈) of Water Consumption and Subsidies by Socioeconomic Group of Households
Elasticity (∈) is a measure of the sensitivity of marginal water consumption (subsidies) when presented with percentage changes in the number of households, an indicator which does not depend of the measuring units of the variables.
Elasticity is defined in the following way:
∈ = (Δqi/Q)/(Δhi/H)
- Δqi = changes in the volume of water consumed (subsidies) by socioeconomic group (i)
- Q = consumed water volume (subsidies) by all households
- Δhi = changes in the number of households by socioeconomic group (i)
- H = total number of households
Under the assumption that all marginal changes are equal to the mean participation by socioeconomic group, there is (i):
(Δqi/Q) = (qi/Q)
(Δhi/H) = (hi/H)
Elasticity (∈) of water consumption (subsidies) by socioeconomic group is defined as the mean percentage change in water consumption (subsidies) among the mean percentage change in households of the corresponding group.
If the value of elasticity by socioeconomic group is greater than one (elastic), the score is interpreted to indicate a high sensitivity of that group to water consumption (subsidy), if the elasticity is less than one (inelastic), it indicates a low sensitivity to changes in water consumption (subsidy) and if it is equal to one it is classified as unitary since the changes between the related variables are equal (see Figure 1).
2.3. Targeting Indicator (Ω)
The targeting indicator relates the mean proportion of subsidies that a group of households receives, divided by the mean proportion of subsidies of the total number of households. Such a relation is expressed with the following equation:
Where Si is the value of received subsidies by the group of households i, SH is the total value of the subsidy received overall by households, Pi is the number of households in group i and H is the total number of households. A Ω value equal to one implies that the subsidy distribution is neutral, meaning that the proportion of subsidies reaching the households in group i is equal to the proportion of the population conformed by those households. A value higher than one implies that the subsidy distribution is progressive, that households in group i benefit from a proportion of total subsidies greater than the proportion of the population they represent. Finally, if Ω is lower than one, it implies that the subsidy distribution is regressive.
Ω = (Si/Pi)/(SH/H) = (Sp/SH)(H/P)
2.4. Data
Data was obtained through the Survey on Consumption Habits, Service and Quality of Water by Household in Mexico City, 2011 (EHCSCA) and from the Population and Housing Census [39]. The survey was applied to households permanently residing in private houses in CDMX between August and September 2011. The EHCSCA is based on a sample of 689 houses randomly selected with a 99% level of confidence and a 5% margin of error, representative of a sampling frame of houses from INEGI 2008.
The EHCSCA reports information on drinking water consumption by household (m3), water charges (money in Mexican pesos), family income, applied fee and type of household. The confidence in these variables is high given that they are the central variables in the determination of the sample, elements that show that the data is robust and has few constraints. The variable subsidies by household were estimated by drawing from the survey’s data such as the fee payment declared by the household, the water consumption declared and estimated, as well as the SACMEX subsidies table.
The concentration curve was obtained by grouping the sample households in quintiles from lowest to highest monthly family income (20% of households), the IC was derived from this curve. Other groupings of the households are: (i) according to their monthly economic income in low (less than 3000 pesos), medium low (3001 a 6500 pesos), medium high (6501 a 9000 pesos) and high (9001 or more); (ii) according to the bimonthly water fee payments they declared paying to SACMEX (working-class, low, medium, high).
3. Results
3.1. Distribution of Piped Water and Water Subsidies
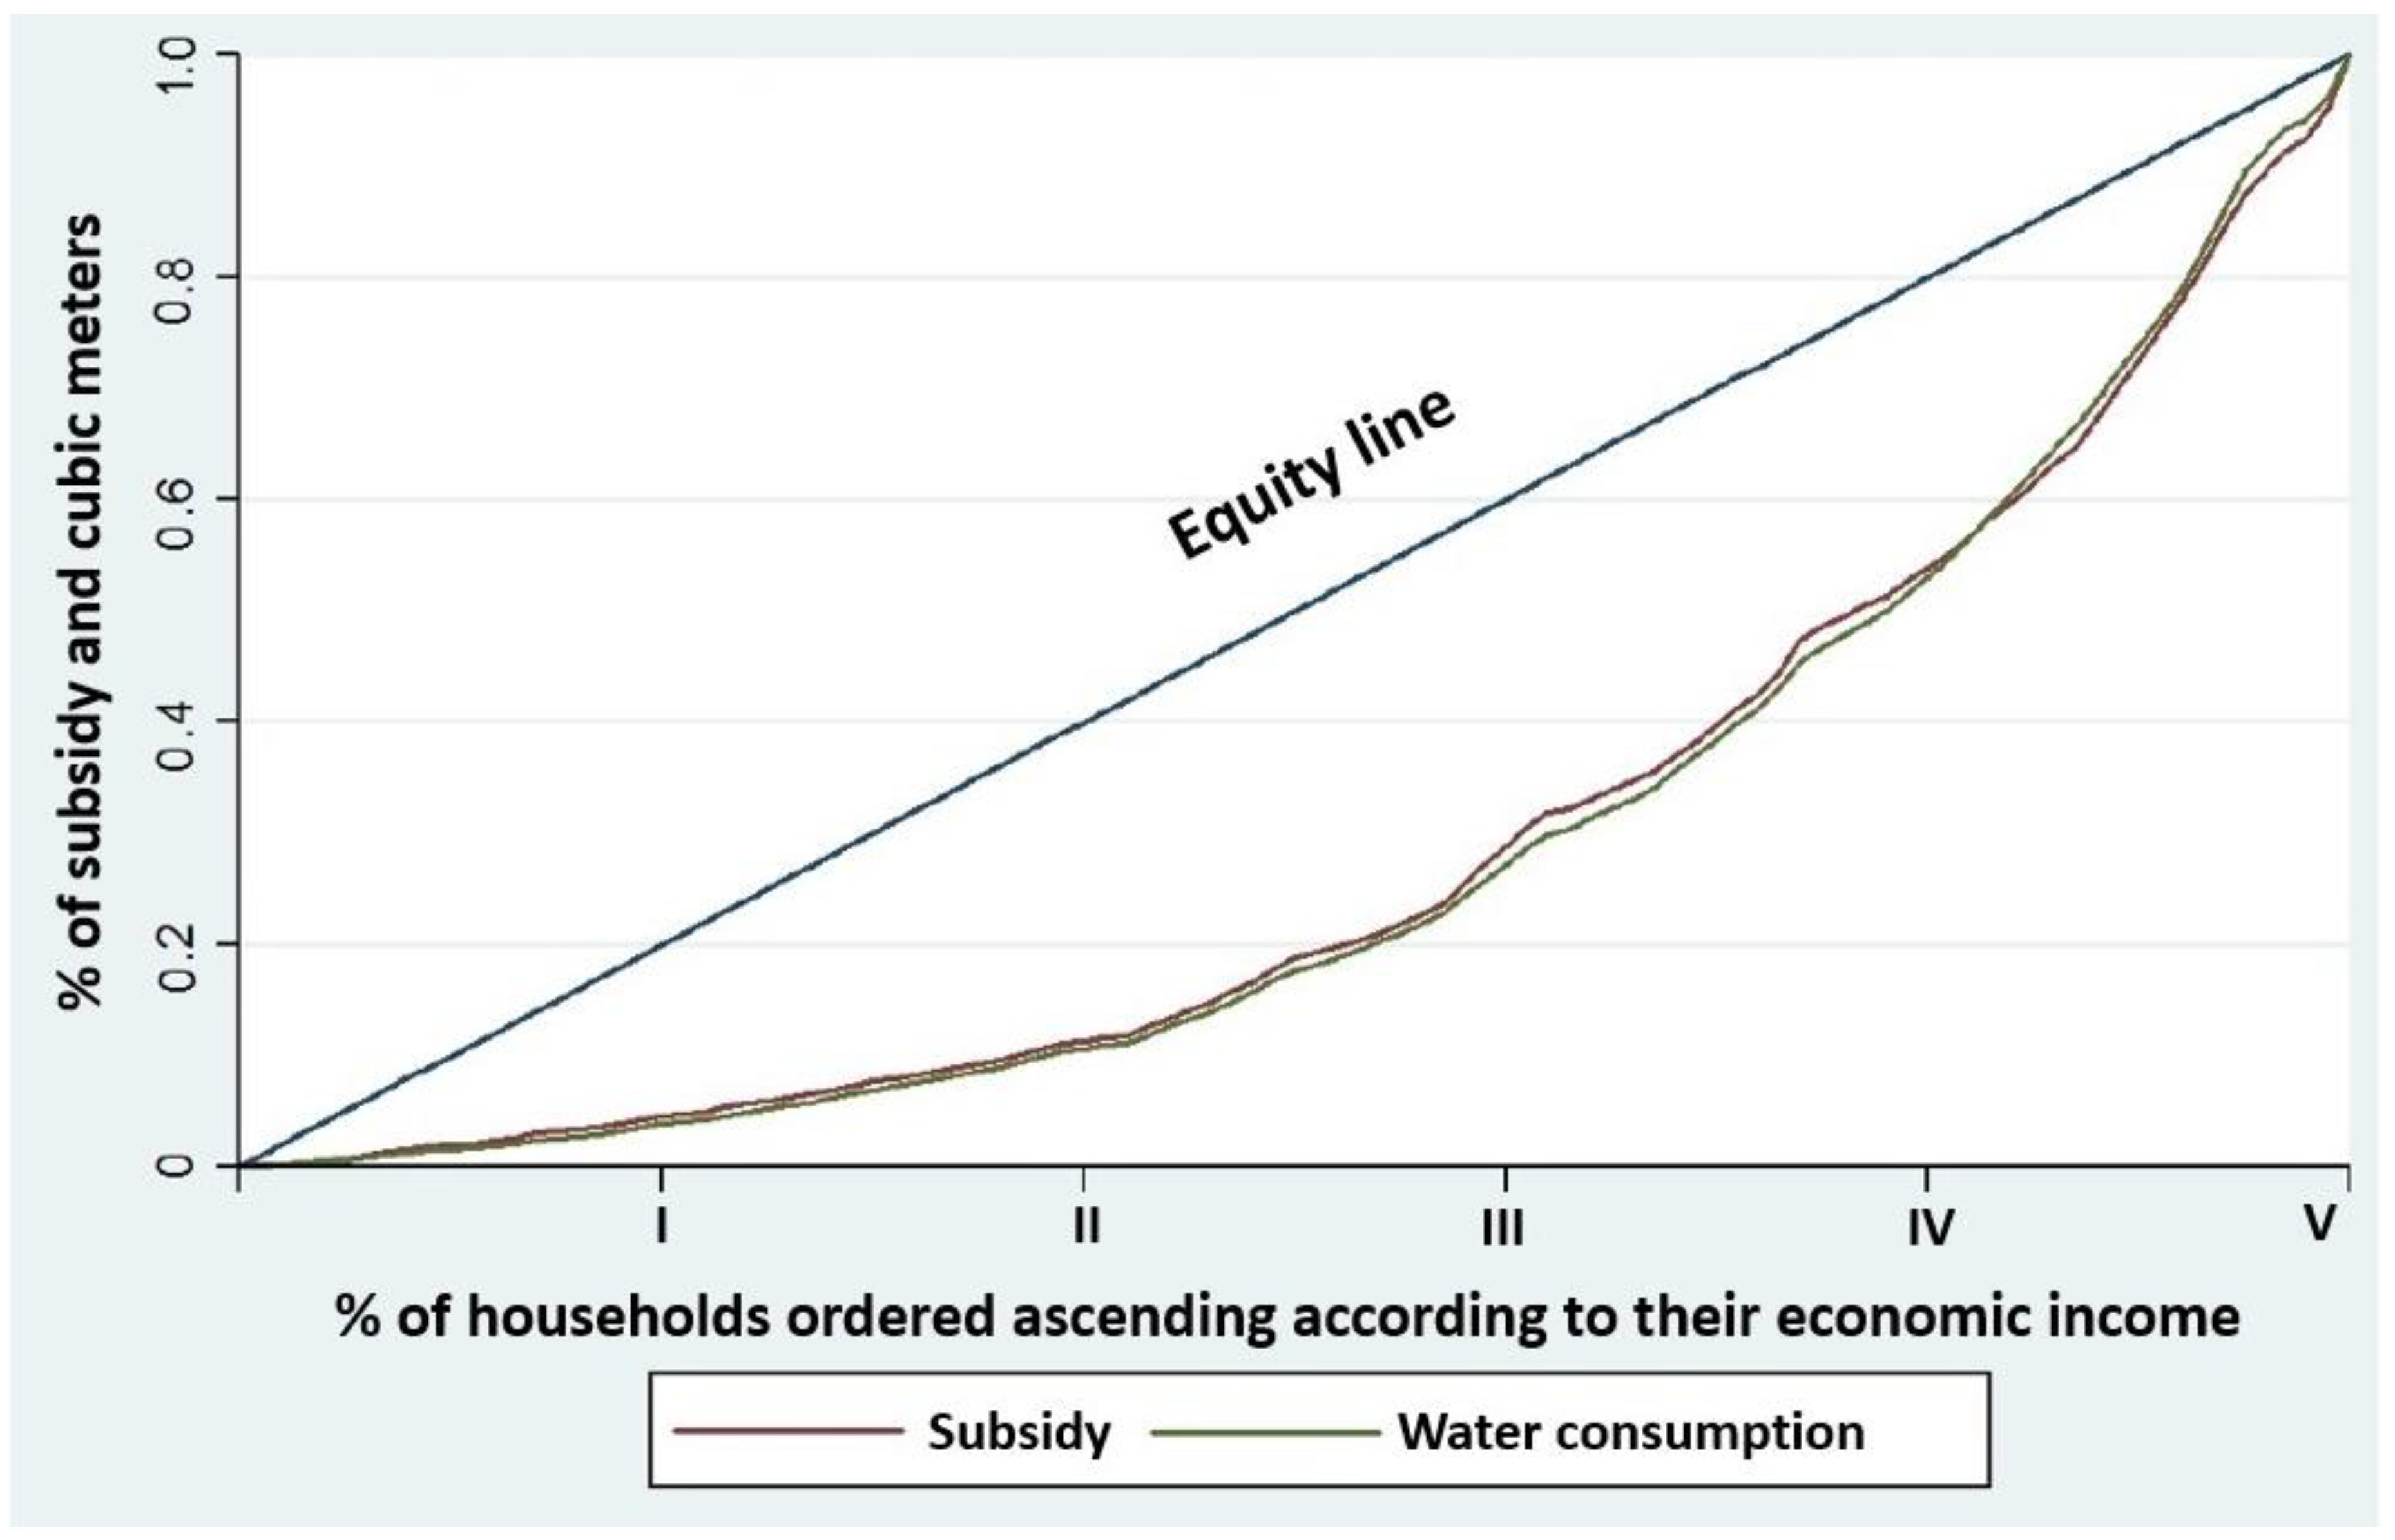
Concentration curves (CC) of water consumption and water subsidies are presented in Figure 2. Households in CDMX are organized from lowest to highest family income and are classified into five groups with the same number of households (quintiles on the x-axis) and for these same groups water consumption (and subsidies) is estimated on the y-axis.
The CC of water consumption shows that the first quintile, which groups the lowest family income households, consumes approximately 7% of the total amount of water supplied to households in CDMX (m3). At the other end, the fifth (V) quintile brings together the highest income households that consume almost 42% of water, in other words, six times more than the first quintile. The other 51% is consumed by the 60% of households in the second, third and fourth quintile. This distribution shows that water consumption is favorable to a larger extent to the households with the highest income. An equal distribution of water is obtained when the curve comes close to the straight line of 45° that is presented in the same figure.
The CC of subsidies behaves in a similar way to the CC of water consumption (Figure 2), only slightly closer to the line of perfect equality. This behavior shows the strong correlation between the volumes of water consumed and water subsidies, suggesting that subsidies are directly distributed as a function of the volume of water consumed and that differentiated and subsidized fees impact the highest income households in a favorable way.
3.2. Indicator of Concentration of Water Consumption and Subsidies (IC)
The IC varies between −1 and +1; negative values indicate a pro-poor distribution and positive numbers a pro-rich distribution. The IC of water consumption and of its corresponding subsidies are positive and have similar values, showing that there is an inequality in the distribution of both variables in favor of the high-income groups (pro-rich). The IC of water consumption is 0.437 and the IC estimated for the subsidies granted for domestic water consumption is 0.429, the latter one slightly less concentrated than the former. Both IC confirm that the current water distribution and the water fee structure and/or its implementation is favoring to a greater extent high income households in its granting of subsidies. As will be shown below in the section Households Classified by fees, the value of the IC of subsidies is due to the working-class, low and medium fees being wrongly applied to households that register high incomes and vice versa.
3.3. Water Elasticity and Subsidies by Socioeconomic Group of Households
Surveyed households are grouped according to their monthly family incomes across four ranges defined in this research: low income, medium low, medium high and high, which define their socioeconomic level (Table 1). Practically one third of households (30.7%) are classified as low income (up to 3000 Mexican pesos) and 13.5% as high income, the other 55.8% corresponds to the medium income (low and high) (column 2). In column 3 the socioeconomic groups are associated with the quintiles from the previous section and a consistency in both classifications is observed, the quintiles increase as income levels increase.
In column 4, participation that each group makes in the total of water consumed by households in CDMX is shown. Low and medium low-income households consume more than half the total amount of water used by households (64.7%), simultaneously they represent 67.2% of total households in Mexico City (column 2).
In column 5 the elasticity of water consumption by socioeconomic group is shown. The high-income group showed the most elasticity with a value of 1.1, which indicates its high sensitivity to water consumption when there is a percentage increase in the number of households inside its same group. As a counterpoint, in the low-income household group elasticity is less than one (0.9), which indicates a lower sensitivity to changes in water consumption relative to percentage changes in the size of the group of households. Medium income households show an elasticity equal to one, which indicates that the changes in water consumption are proportional to the percentage change of the size of its corresponding group.
Considering the income levels of households, it becomes clear that low income households are less sensitive to water consumption (0.9); as groups of households show higher incomes this number also increases, until it reaches high income households (1.1), which behave with a higher sensitivity to water consumption. This difference in elasticity indicates that high-income households use 22% more water than low-income households, which confirms the inequality in the distribution of the hydric resource stated in the previous section.
Elasticity of subsidies is presented in Table 2. Column 2 shows that the participation of low-income households in the total number of subsidies is of only 10.5%, making it the less favored group when compared to high-income households, 20.1%, notwithstanding that the percentage of high-income households represents two fifths of the total number of low-income households.
Column 3 presents the elasticity of subsidies by socioeconomic group. The elasticity of the high-income household group is elastic (1.48) and shows its high sensitivity to water subsidies when presented with a percentage increase in the number of households within the group. In contrast, low-income households show an elasticity of less than one and a low value of (0.34) which is qualified as inelastic and which shows the low sensitivity in this household group to subsidies when presented with percentage changes in the household group.
The sensitivity to water subsidies is increased as the household group increases its income level, showing that high income households receive 4.35 times more subsidies than low income households.
3.4. Targeting Indicator (Ω) of Subsidies.
The targeting indicator (Ω) of subsidies shown in Table 3 compares the mean proportion of incomes that reach households in group i with regards to the mean proportion of the population. For low-income households Ω is lower than one (0.92), which shows a regressive distribution of subsidies. Low-income households benefit from a lower proportion of subsidies with regards to the proportion of the population they represent (regressive distribution).
For the medium and high-income groups, the targeting indicator increases as the family income increases. For the medium low and medium high-income groups, the Ω value is equal to one, reflecting a neutral distribution; the situation improves in the case of the high-income group of households where their Ω is equal to 1.1., indicating a progressive distribution.
3.5. Households Classified by Socioeconomic Level and Fees
Fees imposed on water in 2011 are defined according to the household type, considering their corresponding Neighborhood Development Index, which is determined according to the income of the households and the cadastral value of the houses [42]. Four types of neighborhoods of houses define the fees and the percentage of the subsidy, they denote the difference in the life conditions of the households, from worse to best condition, they are working-class, low, medium and high.
In Table 4, households in CDMX are classified with the two criteria used until now—level of socioeconomic income and type of fee. The columns show each household group according to their socioeconomic level, the rows show households according to the fee they pay SACMEX, in a way that the sum of the inside percentages of participation of the total number of households gives 100%.
Column 5 and row 5 show the total percentage of households by type of fee and socioeconomic income level respectively. By comparing such percentages, it is noticeable that practically two thirds of households (68.4%, row 1 and 2) pay for water at the working-class and low rates (those with the highest subsidy, 90% in average), which presumably corresponds to 67.2% of households in CDMX that are classified as low and medium low-income (row 5, column 1 and 2). The remaining third of households (31.6) in column 5, experience medium and high fees which show a lower subsidy (60% in average) and that correspond to the 32.8% of medium high and high-income households (row 5, column 3 and 4). In principle, this result indicates that fees are well targeted since they are applied to the right type of household.
However, the match between the type of fee and the corresponding household does not hold when a revision by socioeconomic household group (column) is made. Table 4 shows that each household group that integrates a socioeconomic level (column) registers fees that go from working-class to high. For example, on the first column corresponding to the low-income household group, the working-class fee is only applied to 11.9% of households, the other 18.8% of the households in this group show fees that go from low to high; it is important to note that 3.2% of these households pay the high fee. And vice versa, in the high-income household group (column 4) the high fee is applied to only 3.3% of households, the poplar to medium fees are applied to 10.2% of these households. This non-targeted allocation of fees suggests a serious flaw in SACMEX fees application and explains to a large extent the unequal distribution in subsidies among the total number of households in CDMX, which favors households with the highest incomes and disadvantages households with working-class and low incomes. This imperfect fee application explains an important part of the inequality in the distribution of water subsidies in the extreme quintiles of the concentration curve analyzed above. The results suggest that the zoning by house neighborhood created by SACMEX shows errors, high income households have incentives to remain in the wrong category and, due to this, do not request a correction. The opposite occurs in low-income households, which should demand a correction in the classification error. However, it is difficult to evaluate whether this has improved over time. The implications of this situation are serious in terms of the design of public policy.
4. Discussion
The results of this research gain importance in light of reductions in the total amount of drinking water subsidies in Mexico City; During the 2008 to 2013 period they were reduced by 38% in real terms, which negatively impacts SACMEX operation, in the reduction of the water supply flow, the increase in cuts in supply and in providing a service of poorer quality. This occurred as a result of a lack of fee adjustments that would increase income self-sufficiency in operating SACMEX. Nevertheless, it should be acknowledged that cheap water for high-income households produces a series of distortions in wasteful use by this segment of consumers.
Despite the popularity in the use of a progressive fee structure per block of consumption of drinking water services, there are two primary reasons as to why these subsidies are not effective in reaching low-income households [48,49]. First, only households connected to the water network can receive the subsidy through the fee. However, in most developing countries, in general, the lowest income households are not directly connected to the service or have deficient connections or are shared [29,30]. Secondly, the lack of reliable information needed to identify and/or relate the different socioeconomic variables of the households to their drinking water consumption can cause medium and high-income households to be misidentified as low-income households. In this work, a third reason is shown; the discontinuity in the supply of the operating body significantly reduces the water supply to households, the impact being greater among low-income households and negatively impacting its quality.
In CDMX it is a priority to continuously supply all of the households with water but particularly those that are vulnerable and have low incomes, it is the most efficient way to channel subsidies to this social group. An effective way is to allocate greater levels on investment for this group and/or to establish connection subsidies [28]. Secondly, households should be targeted more precisely, in particular poor ones, which will allow to properly channel the subsidies. For example, Komives et al. [28] suggest that the targeting of subsidies generates three different benefits for society. First, it allows for the budget reduction of the subsidies or of the cost of offering them. Second, targeting provides a greater impact for those poor households that need it the most, allocating a greater proportion of the budget to this type of household. And third, subsidies directed to a lower number of households have the potential of creating fewer distortions in consumption than when there is a universal coverage and it is poorly targeted.
5. Conclusions
The high drinking water connection coverage to households of CDMX (98%) conceals a problem of water access inequality among households. The four inequality indicators confirm that water supply between households that are connected to the water supply network is inequitable. Government spending on water subsidies experiences the same fate, it is unequally distributed, with a slight improvement in the distribution of water consumption, meaning the targeting of fees to a determined group of households reaches the wrong group, due to failures in the operative process to identify the correct group.
The behavior of the concentration curves shows the inequity in the distribution of water consumption and its subsidies among households. High family income households (quintile V) are favored six times more than low-income households (first quintile), the latter being the least favored in both variables, medium-income households are slightly favored, even if on the inside some differential treatment exists.
One of the most important discoveries of this research is that, with its current fee structure, water subsidies are distributed in direct relation to water volume consumption and the water percentage that reaches low-income households is meager—it does not reach unconnected households and little water reaches those with a connection. The survey reports that households in general show serious deficiencies in their continuous supply of the service, frequent and long duration cut-offs, a situation which affects households that do not have a cistern to a higher degree (46%), that remain without water when there are water cut-offs and that go from several times per month to daily cut-offs. This way, a large number of households in the city has to cover its basic water needs by resorting to alternative ways of storage that entail money and time spent by the members of the household, reducing the well-being of the affected families.
The estimated IC is of 0.437 for water volume consumed and the IC for water subsidies is of 0.429, both measures indicate that higher income household groups in CDMX are most favored in the distribution of both magnitudes (pro-rich distribution). The similar value of both types of IC suggests that water subsidies are distributed based on the volume of water consumed and that subsidies to households by SACMEX policy has not had a major impact on improving the well-being of the poorest when compared to the well-being of high-income groups.
Households classified in different socioeconomic level groups show that high-income have a high sensitivity (elasticity) to water consumption when compared to low-income households. This difference shows that high-income use 22% more water than low-income households, data that confirms the inequality in the distribution of the water resource. The elasticity of subsidies on the different socioeconomic groups increases as household income increases, showing that high-income receive 4.35 times more subsidies than low income households.
Inequality in subsidies is confirmed with the targeting indicator (Ω), low and medium-income households report a value of less than one, which indicates that they benefit from subsidies to a lesser degree when compared to the mean of the population (regressive distribution). For the high-income households group, the targeting indicator is greater than one and indicates that they benefit more than the mean of the population (progressive distribution). For medium low- and medium high-income households the Ω value is equal to one, reflecting a neutral distribution.
The distribution of subsidies among the total number of households in CDMX favors households with higher incomes and prejudices households with working-class and low-incomes. This conclusion is opposite to the declared objective of SACMEX’s fee policy, which seeks to benefit poor households with a low consumption in cubic meters by applying a 90% discount on the working-class fee; the subsidy decreases as the fee increases until it reaches an amount where there is a 60% subsidy.
The fault that was found refers to the poor allocation of fees (and hence of subsidies) to households, due to an inefficient classification of their socioeconomic condition. This imperfect fee implementation explains to a great extent the inequality in water subsidies at the extreme distribution quintiles on the concentration curve.
This research finds that, in CDMX, three reasons are simultaneously present, the first evidence of this is that there are 48,000 households that are still not connected to public services [39,50] and that they are the households with the lowest economic incomes and with the greatest needs and they are supplied by mobile water tank, bottled water and/or pipes, which are generally sold at much higher prices, of lower quality and that, by not having access to domestic water consumption, they do not receive any subsidy. The second reason becomes evident in the fact that SACMEX registers two systematic errors that prevent the correct identification of the household type with its corresponding socioeconomic classification. The first error assigns high fees to low-income households, the second error assigns low-fees to high-income households. Finally, the third reason is that rationing of water distribution reduces the amount of water for households, particularly low-income ones.
This work can be used to evaluate the current policy of public access on water supply to households. From this perspective, the results of this article contribute to the creation of an economy of sustainability that will provide the tools and measures for public debate to evaluate the regulatory objectives of the policies with the objective of allowing a “justice among humans from the same generation, in particular the current generation” (intergenerational justice) [51].
6. Recommendations
The results of the research support the conclusion that water subsidies do not currently favor the poorest households in the city and indicate the urgency and the importance for SACMEX to redefine their fee and service coverage policies. Under these conditions, it is suggested a review is carried out of their policy on subsidies and on their implementation to stop the deviation of subsidies to households that do not need them and direct them to households with greater needs. It is important that SACMEX, as the sole water-operating body in CDMX, revise the fulfillment of their objectives, given that, despite this, with a 98% coverage in household connection, it is not offering the quality in its service expected for the biggest city in the country and the most important from an economic point of view. It is noted in this work, the urgency to extend the service coverage to the poorest households and, where connections already exist, the continuity of their service be improved, increasing its service efficiency and readjusting its policy on subsidies to target those who need them the most, in such a way that, in the long term, allows the operating body to reach economic self-sufficiency.
Low-income family households value more highly the access to improvements in water quality and quantity provided by the operating body. This is because it implies an increase in their well-being, in light of improvements in the quantity of water supplied and in the reception of water subsidies that the operating body distributes. In particular, to improve water quality in households, the operating body should provide a continuous supply so that households do not need to store it, an activity that increases the risk of water contamination and makes the problem far more complex. Previous studies estimate that the amounts of the willingness to pay (WTP) that households in CDMX would pay for improvements in water supply services to households are equal to 20 dollars bimonthly to maintain the service and 23.1 dollars to improve it [52]. In both cases, the quantity they are willing to pay is more than double the average price they were paying for the service before 2010.
There is a widespread perception among Mexico City households that the water received is not suitable for drinking, a situation which determines a positive WTP to be provided with drinkable water, which as a percentage of their family income is of 0.22%. The WTP increases commensurate with increases in household income. However, households with the lowest incomes show a greater WTP (0.47%) when considered as a percentage of their corresponding income [53], increasing pressure in their already low position in the distribution of the water resource and in water subsidies among households in CDMX.
The opinion of CDMX households regarding the operating body services, the issues accessing piped water, the mismatch between the fee payment and the quality of the service by the public operating body, stresses the importance of the distribution of water among households and of subsidies, which signifies a measure in the reduction of the well-being of the population in CDMX.
Results suggest that actions about the operating body are needed, since, even if it provides a high percentage of service coverage, it needs to cover it by to 100%. The service it offers must improve, particularly in the quality of water supplied, as well as in increasing equity in the distribution of water and in subsidies.
The implementation of the identified actions presents a win-win scenario, given that CDMX population would increase their well-being and the operating body could obtain the needed financial resources in order to provide a sustainable supply both from an economic and environmental standpoint.
Colombia’s experience is thought provoking for SACMEX, which is currently going through a financially stressful situation. In Colombia, a targeting or stratification system is applied to houses according to the income of the households and to the building characteristics of the houses, as well as to the environment in which they are built [54]. The stratification of houses identifies six groups, the lowest stratum corresponds to those inhabited by users with lower incomes and higher needs, which benefit from domestic public service subsidies; the stratum with higher incomes pay a cost overrun on the value of services (cross-subsidy). And the medium stratum does not benefit from any subsidies, they pay exactly the value that the service provider establishes as the supply cost.
The information supplied by SACMEX continues to be a restriction in this type of studies, this is why it must be generated through expensive surveys and the methodological demands of the sampling design must be restricted according to the budget of the project.
The combination of synergies in the development of projects between governments interested in the topic and universities is suggested to be able to carry out research with more resources that allow for the generation of indicators to the level of detail required in order to make public policy decisions.
Author Contributions
Conceptualization, J.A.M.-N., L.R.-T. and D.A.R.-F.; Methodology, J.A.M.-N., L.R.-T., X.X. and D.A.R.-F.; Formal Analysis, J.A.M.-N., L.R.-T., X.X. and D.A.R.-F.; Investigation, J.A.M.-N., L.R.-T., X.X. and D.A.R.-F.; Writing-Original Draft Preparation, J.A.M.-N., L.R.-T., X.X. and D.A.R.-F.; Writing-Review & Editing, J.A.M.-N., L.R.-T., X.X. and D.A.R.-F.; Funding Acquisition, J.A.M.-N.
Funding
This research was funded by National Council for Science and Technology (CONACYT) within the framework of Towards an Integral Water Management by River Basin: An Analysis on Availability and Uses, National Problems Fund (Project N. 120-2015) and with the support from A Hydric and Economic Model for the Valley of Mexico Basin Project within the framework of CONACYT Chairs Program. The survey was carried out with resources from the Mexico City Science and Technology Institute (ICyTDF) within the framework of the project Quality and Reduction in Water Demand in Mexico City, key 13,311,378, 2011.
Conflicts of Interest
The authors declare no conflict of interest.
References
- United Nations Development Programme (UNDP). Human Development Report; UNDP: New York, NY, USA, 2006. [Google Scholar]
- Soto-Montes de Oca, G.; Bateman, J. Scope sensitivity in households’ willingness to pay for maintained and improved water supplies in a developing world urban area: Investigating the influence of baseline supply quality and income distribution upon stated preferences in Mexico City. Water Resour. Res. 2006, 42. [Google Scholar] [CrossRef]
- Gadgil, A. Drinking Water in Developing Countries. Annu. Rev. Energy Environ. 1998, 23, 253–286. [Google Scholar] [CrossRef]
- Listori, J. Bridging environmental health gaps—Lessons for Sub-Saharan Africa infrastructure projects: Main report. In Africa Technical Department Environmentally Sustainable Development Division (AFTES) Working Paper, 20, 21, & 22; Banco Mundial: Washington, DC, USA, 1996. [Google Scholar]
- Galiani, S.; Gertler, P.J.; Schargrodsky, E. Water for Life: The Impact of the Privatization of Water Services on Child Mortality. J. Political Econ. 2005, 113, 83–120. [Google Scholar] [CrossRef]
- Tanellari, E.; Bosch, D.; Mykerezi, E. On consumers’ attitudes and willingness to pay for improved drinking water quality and infrastructure. Water Resour. Res. 2015, 51, 47–57. [Google Scholar] [CrossRef]
- De Franca-Doria, M.; Pidgeon, N.; Hunter, R. Perceptions of drinking water quality and risk and its effect on behaviour: A cross-national study. Sci. Total Environ. 2009, 407, 5455–5464. [Google Scholar] [CrossRef] [PubMed]
- Casey, J.; Kahn, J.; Rivas, A. Willingness to pay for improved water service in Manaus, Amazonas, Brazil. Ecol. Econ. 2006, 58, 365–372. [Google Scholar] [CrossRef]
- So-Yoon, K.; Yoo, S.; Kim, C. Measuring the Willingness to Pay for Tap Water Quality Improvements: Results of a Contingent Valuation Survey in Pusan. Water 2013, 5, 1638–1652. [Google Scholar] [Green Version]
- Onjala, J.; Wagura-Ndiritu, S.; Stage, J. Risk Perception, Choice of Drinking Water, and Water Treatment: Evidence from Kenyan Towns. J. Water Sanit. Hyg. Dev. 2014, 4, 268–280. [Google Scholar] [CrossRef]
- Bowen, W. An analytical review of environmental justice research: What do we really know? Environ. Manag. 2002, 29, 3–15. [Google Scholar] [CrossRef]
- Lavaine, E. Atmospheric Pollution, Environmental Justice and Mortality Rate: A Spatial Approach. In Documents de Travail du Centre d’Économie de la Sorbonne n° 72; Centre d’Économie de la Sorbonne: Paris, French, 2010. [Google Scholar]
- Warwick-Booth, L. What is social inequality? In Social Inequality a Student’s Guide; SAGE: London, UK, 2013. [Google Scholar]
- Kochhar, K.; Pattillo, C.; Sun, Y.; Suphaphiphat, N.; Swiston, A.; Tchaidze, R.; Clements, B.; Fabrizio, S.; Flamini, V.; Redifer, L.; et al. Is the Glass Half Empty or Half Full? Issues in Managing Water Challenges and Policy Instruments. In IMF Staff Discussion Notes, N°15/11; International Monetary Fund: Washington, DC, USA, 2015. [Google Scholar]
- Calow, R.; Mason, N. The Real Water Crisis: Inequality in a Fast Changing World; ODI: London, UK, 2014. [Google Scholar]
- Wang, X.; Zhang, J.; Shahid, S.; ElMahdi, A.; He, R.; Wang, X.; Mahtab, A. Gini coefficient to assess equity in domestic water supply in the Yellow River. Mitig. Adapt. Strateg. Glob. Chang. 2011, 17, 65–75. [Google Scholar] [CrossRef]
- Bhattarai, M.; Sakthivadivel, R.; Hussain, I. Irrigation Impacts on Income Inequality and Poverty Alleviation: Policy Issues and Options for Improved Management of Irrigation Systems; Working Paper 39; International Water Management Institute: Colombo, Sri Lanka, 2002. [Google Scholar]
- Rogers, R.; de Silva, R.; Bhatiac, R. Water is an economic good: How to use prices to promote equity, efficiency, and sustainability. Water Policy 2002, 4, 1–17. [Google Scholar] [CrossRef] [Green Version]
- Phansalkar, S. Water, Equity and Development. Int. J. Rural Manag. 2007, 3, 1–25. [Google Scholar] [CrossRef] [Green Version]
- Wang, J.; Huang, J.; Huang, Q. The evolution of groundwater governance: Productivity, equity and changes in the level of China’s aquifers. Q. J. Eng. Geol. Hydrogeol. 2009, 42, 267–280. [Google Scholar] [CrossRef]
- Wang, X.; Zhang, J.; Liu, J.; Wang, G.; He, R.; Wang, Y.; Zhang, M.; Liu, C. Water Demand Management instead of Water Supply Management: A Case Study of Yulin City in Northwestern China. In Proceedings of the Symposium JS.3 at the Joint Convention of the International Association of Hydrological Sciences (IAHS) and the International Association of Hydrogeologists (IAH), Hyderabad, India, 6–12 September 2009; IAHS Publications: Wallingford, UK, 2009. [Google Scholar]
- Rasul, G.; Chowdhury, A. Equity and Social Justice in Water Resource Management in Bangladesh; Gatekeeper Series International Institute for Environment and Development: London, UK, 2010; Volume 146, pp. 1–20. [Google Scholar]
- Butler, D.; Memon, S. Water Demand Management; IWA Publishing: London, UK, 2006. [Google Scholar]
- Wang, H.; Xie, J.; Li, H. Water pricing with household surveys: A study of acceptability and willingness to pay in Chongqing, China. China Econ. Rev. 2010, 21, 136–149. [Google Scholar] [CrossRef]
- Berthe, A. Mesurer les Inégalités D’accès à L’eau et à L’assainissement dans le Nord et le Nordeste du Brésil: Quels Enseignements en Matière de Justice Sociale? Available online: http://gretha.u-bordeaux.fr/fr/cahiers-du-gretha/les-cahiers-2016/mesurer-les-in%C3%A9galit%C3%A9s-d%E2%80%99acc%C3%A8s-%C3%A0-l%E2%80%99eau-et-%C3%A0-l%E2%80%99assainissement-dans (accessed on 15 February 2018).
- Yang, H.; Bain, R.; Bartram, J.; Grundy, S.; Pedley, S.; Wright, J. Water Safety and Inequality in Access to Drinking-water between Rich and Poor Households. Environ. Sci. Technol. 2013, 47, 1222–1236. [Google Scholar] [CrossRef] [PubMed]
- Malakar, K.; Mishra, T.; Patwardhan, A. Inequiality in wáter supply in India: An assessment using the Gini and Theil indices. Environ. Dev. Sustain. 2017, 20, 841–864. [Google Scholar] [CrossRef]
- Komives, K.; Foster, V.; Halpern, J.; Wodon, Q. Agua, Electricidad y Pobreza. ¿Quién se Beneficia de los Subsidios a Los Servicios Públicos? Banco Internacional de Reconstrucción y Fomento/Banco Mundial: Washington, DC, USA, 2005. [Google Scholar]
- Barde, J.; Lehmann, P. Distributional effects of water tariff reforms—An empirical study for Lima, Peru. Water Resour. Econ. 2014, 6, 30–57. [Google Scholar] [CrossRef]
- Whittington, D.; Nauges, C.; Fuente, D.; Wu, X. A diagnostic tool for estimating the incidence of subsidies delivered by water utilities in low- and medium-income countries, with illustrative simulations. Util. Policy 2015, 34, 70–81. [Google Scholar] [CrossRef]
- Bardasi, E.; Wodon, Q. Who pays the most for water? Alternative providers and service costs in Niger. Econ. Bull. 2008, 9, 1–10. [Google Scholar]
- Banerjee, S.; Foster, V.; Ying, Y.; Skilling, H.; Wodon, Q. Cost Recovery, Equity and Efficiency in Water Tariffs: Evidence from African Utilities; World Bank Policy Research Working Paper No. 5384; World Bank: Washington, DC, USA, 2010. [Google Scholar]
- Foster, V.; Araujo, C. Does Infrastructure Reform Work for the Poor? A Case Study from Guatemala; World Bank Policy Research Working Paper No. 3185; World Bank: Washington, DC, USA, 2004. [Google Scholar]
- Foster, V. Toward a Social Policy for Argentina’s Infrastructure Sectors: Evaluating the Past and Exploring the Future; World Bank Policy Research Working Paper No. 3422; World Bank: Washington, DC, USA, 2004. [Google Scholar]
- Ángel-Urdionola, D.; Wodon, Q. Do utility subsidies reach the poor? Framework and evidence for Cape Verde, Sao Tome, and Rwanda. Econ. Bull. 2012, 9, 1–7. [Google Scholar]
- Gini, C. Variabilita e Mutabilita; Tipografia di Paolo Cuppini: Bolognia, Italy, 1912. [Google Scholar]
- Cullis, J.; Van Koppen, B. Applying the Gini Coefficient to Measure Inequality of Water Use in the Olifants River Water Management Area, South Africa; IWMI Research Report 113; International Water Management Institute: Colombo, Sri Lanka, 2007; 25p. [Google Scholar]
- Justino, P. Multidimensional welfare distributions: Empirical application to household panel data from Vietnam. Appl. Econ. 2012, 44, 3391–3405. [Google Scholar] [CrossRef]
- INEGI. Censo de Población y Vivienda; INEGI: Aguascalientes, Mexico, 2010. Available online: http://www.beta.inegi.org.mx/proyectos/ccpv/2010/ (accessed on 15 February 2018).
- National Council for Evaluation of Social Development Policy. Informe de Evaluaciòn de la Política de Desarrollo Social en Mèxico 2012; CONEVAL: Ciudad de México, México, 2012. [Google Scholar]
- Survey on Consumption Habits. Service and Quality of Water by Household in Mexico City (EHCSCA); UAM-ICyTDF: México City, México, 2011. [Google Scholar]
- Soto-Montes de Oca, G. Tarifas y derecho humano al agua. In Defensor N°7; Comisión de Derechos Humanos del Distrito Federal: Ciudad de México, México, 2015. [Google Scholar]
- Vélez, C. Gasto Público Social y Desigualdad: Logros y Extravíos; Departamento Nacional de Planeación: Bogotá, Colombia, 1996. [Google Scholar]
- Nina, E. Efecto del Gasto Público Social en la Distribución del Ingreso en Colombia. Rúbricas 2011, 2, 58–65. [Google Scholar]
- Demery, L. Benefit Incidence: A Practitioner’s Guide Poverty and Social; The World Bank: Washington, DC, USA, 2000. [Google Scholar]
- Cuenca, J. Benefit Incidence Analysis of Public Spending on Education in the Philippines: A Methodological Note. In Discussion Paper Series N° 09; Philippine Institute for Development Studies: Quezon, Philippine, 2008. [Google Scholar]
- Gasparini, L.; Cicowiez, M.; Sosa Escudero, W. Pobreza y Desigualdad en América Latina; Temas Editorial: Buenos Aires, Argentina, 2012. [Google Scholar]
- Whittington, D. Possible Adverse Effects of Increasing Block Water Tariffs in Developing Countries. Econ. Dev. Cultural Chang. 1992, 41, 75–87. [Google Scholar] [CrossRef]
- Boland, J.; Whittington, D. The Political Economy of Water Tariff Design in Developing Countries: Increasing Block Tariffs Versus Uniform Price with Rebate; Dinar, E.A., Ed.; The Political Economy of Water Pricing Reform; Oxford University Press: New York, NY, USA, 2000. [Google Scholar]
- INEGI. Censo de Población y Vivienda; INEGI: Aguascalientes, Mexico, 2015; Available online: http://www.beta.inegi.org.mx/proyectos/enchogares/especiales/intercensal/ (accessed on 15 February 2018).
- Baumgärtner, S.; Quaas, M. What is sustainability economics? Ecol. Econ. 2010, 69, 445–450. [Google Scholar] [CrossRef]
- Soto-Montes de Oca, G. Agua-Tarifas, Escasez y Sustentabilidad en las Mega Ciudades: ¿Cúanto Están Dispuestos a Pagar Los Habitantes de la Ciudad de México? Universidad Iberoaméricana: Ciudad de México, México, 2007. [Google Scholar]
- Rodríguez, L.; Revollo-Fernández, D.; Morales-Novelo, J. Household’s Perception of Water Quality and Willingness to Pay for Clean Water in Mexico City. Economies 2017, 5, 12. [Google Scholar] [CrossRef]
- Ministerio de Hacienda Y Crédito Público. Evaluación de la Estratificación Socio-Económica como Instrumento de Clasificación de los Usuarios Y Herramienta de Asignación de Subsidios Y Contribuciones a Los Servicios Públicos Domiciliarios; Informe Institucional; Econometría S.A: Bogotá, Colombia, 2008. Available online: https://www.dane.gov.co/files/geoestadistica/Evaluacion_Estratificaicon.pdf (accessed on 15 March 2018).
- OECD. Water Resources Management: Integrated Policies; OCDE: Paris, Francia, 1989. [Google Scholar]
- Centro Panamericano de Ingeniería Sanitaria y Ciencias del Ambiente (CEPIS) (SF). Principios Para el Diseño de Tarifas de Agua y Alcantarillado. Available online: http://www.bvsde.paho.org/eswww/proyecto/repidisc/publica/hdt/hdt061.html (accessed on 20 January 2018).
Scheme 1.
Flow chart for the methodology. Source: Own Development, 2018.

Figure 1.
Concentration curve (CC) and indicator of concentration (IC). Source: Own Development, 2016.
Figure 1.
Concentration curve (CC) and indicator of concentration (IC). Source: Own Development, 2016.

Figure 2.
Concentration curves (CC) of water consumption and subsidies (CC) of households in Mexico City. Source: Own Development based on the EHCSCA 2011, 2016.
Figure 2.
Concentration curves (CC) of water consumption and subsidies (CC) of households in Mexico City. Source: Own Development based on the EHCSCA 2011, 2016.


Table 1.
Elasticity in water consumption by socioeconomic group in Mexico City, 2011.
| Households by Socioeconomic Level | (1) Monthly Family Income Range $ | (2) Households by Group (%) | (3) Quintiles | (4) Water Consumption (%) | (5) Water Consumption Elasticity (∈) (4)/(2) |
|---|---|---|---|---|---|
| Low | Less than 3000 | 30.7 | Parts I and II | 27.9 | 0.9 |
| Medium low | 3001 a 6500 | 36.5 | Parts II and III | 36.8 | 1.0 |
| Medium high | 6501 a 9000 | 19.3 | Part IV | 20.8 | 1.0 |
| High | 9001 or more | 13.5 | Part V | 14.5 | 1.1 |
| Total | 100 | 100 | 100 |
(∈) = elasticity, Source: Own Development based on the EHCSCA 2011.
Table 2.
Elasticity of water subsidies by socioeconomic group in Mexico City 2011.
| Households by Socioeconomic Level | (1) Households by Group (%) | (2) Water Subsidies (%) | (3) Elasticity of Water Subsidy (∈) |
|---|---|---|---|
| Low | 30.7 | 10.5 | 0.34 |
| Medium low | 36.5 | 42.9 | 1.17 |
| Medium high | 19.3 | 26.5 | 1.37 |
| High | 13.5 | 20.1 | 1.48 |
| Total | 100 | 100 |
(∈) = elasticity, Source: Own Development based on the EHCSCA 2011, 2016.
Table 3.
Water subsidy targeting indicator (Ω) in Mexico City.
| Households | Ω ψ | Subsidy Distribution |
|---|---|---|
| Low | 0.92 | Regressive |
| Medium low | 1.0 | Neutral |
| Medium high | 1.0 | Neutral |
| High | 1.1 | Progressive |
ψ: Ω = 1 subsidy distribution is neutral, Ω > 1 subsidy distribution is progressive, Ω < 1 subsidy distribution is regressive. Source: Own development based on EHCSCA.
Table 4.
Distribution of households using drinking water by socioeconomic income level and type of fee in CDMX.
Table 4.
Distribution of households using drinking water by socioeconomic income level and type of fee in CDMX.
| Households | Participation of Households (%) | ||||
|---|---|---|---|---|---|
| Socioeconomic Level | (1) Low | (2) Medium Low | (3) Medium High | (4) High | (5) Total % |
| Fee | |||||
| (1) Popular | 11.9 | 13.1 | 6.0 | 3.2 | 34.1 |
| (2) Low | 10.9 | 12.2 | 6.1 | 5.1 | 34.3 |
| (3) Medium | 4.9 | 6.5 | 4.1 | 1.9 | 17.4 |
| (4) High | 3.2 | 4.5 | 3.2 | 3.3 | 14.2 |
| (5) Total | 30.7 | 36.5 | 19.3 | 13.5 | 100 |
Source: Own development based on EHCSCA 2011, 2016.
© 2018 by the authors. Licensee MDPI, Basel, Switzerland. This article is an open access article distributed under the terms and conditions of the Creative Commons Attribution (CC BY) license (http://creativecommons.org/licenses/by/4.0/).
Share and Cite
MDPI and ACS Style
Morales-Novelo, J.A.; Rodríguez-Tapia, L.; Revollo-Fernández, D.A. Inequality in Access to Drinking Water and Subsidies between Low and High Income Households in Mexico City. Water 2018, 10, 1023. https://doi.org/10.3390/w10081023
AMA Style
Morales-Novelo JA, Rodríguez-Tapia L, Revollo-Fernández DA. Inequality in Access to Drinking Water and Subsidies between Low and High Income Households in Mexico City. Water. 2018; 10(8):1023. https://doi.org/10.3390/w10081023
Chicago/Turabian StyleMorales-Novelo, Jorge A., Lilia Rodríguez-Tapia, and Daniel A. Revollo-Fernández. 2018. "Inequality in Access to Drinking Water and Subsidies between Low and High Income Households in Mexico City" Water 10, no. 8: 1023. https://doi.org/10.3390/w10081023
Note that from the first issue of 2016, this journal uses article numbers instead of page numbers. See further details here.