Water Use and Rice Productivity for Irrigation Management Alternatives in Tanzania
by
Stanslaus Terengia Materu
1, 
Sanjay Shukla
2,*,
Rajendra P. Sishodia
2,
Andrew Tarimo
1 and
Siza D. Tumbo
1 1
Department of Engineering Sciences and Technology, Sokoine University of Agriculture, P. O. Box 3003, Chuo Kikuu, Morogoro, Tanzania
2
Agricultural and Biological Engineering Department, University of Florida, 2685 State Road 29 N, Immokalee, FL 34142, USA
*
Author to whom correspondence should be addressed.
Water 2018, 10(8), 1018; https://doi.org/10.3390/w10081018
Submission received: 28 April 2018
/
Revised: 21 June 2018
/
Accepted: 27 June 2018
/
Published: 1 August 2018
(This article belongs to the Special Issue Water Management for Sustainable Food Production)
Abstract
:Rice production is important for global food security but given its large water footprint, efficient irrigation management strategies need to be developed. Expansion of rice growing area is larger than any other crop in Africa due to increasing demand for rice. Three rice irrigation management alternatives with the system of rice intensification (SRI) were field-evaluated against the conventional continuously flooded system (CF) in Tanzania. Production systems included: (1) CF (50 mm ponding depth for the entire season); (2) SRI (40 mm ponding for 3 days and no irrigation for next 5 days); (3) 80% SRI (80% of the SRI ponding); and (4) 50% SRI (50% of the SRI ponding). Experimental evaluation of the four systems was conducted for both wet and dry seasons. For the dry season, the SRI and 80% SRI produced higher yields of 9.68 tons/ha and 11.45 tons/ha and saved 26% and 35% of water, respectively compared to the CF (8.69 tons/ha). The yield advantage of the 80% SRI and SRI over the CF was less during the wet season with 6.01 tons/ha and 5.99 tons/ha of production, and water savings of 30% and 14%, respectively compared to the CF (5.64 tons/ha). The 50% SRI had lowest yield of all for both seasons, 7.48 tons/ha and 4.99 tons/ha for the dry and wet seasons, respectively. Statistically, the 80% SRI treatment outperformed all other treatments over the two seasons with an additional yield of 1.57 tons/ha and 33% (345 mm) water savings compared to the CF. Economic productivity of water (US$/ha-cm) over two seasons was highest for the 80% SRI ($20.27/ha-cm), while it was lowest for the CF ($12.89/ha-cm). Water saved by converting from the CF to the 80% SRI (1.98 million ha-cm) can support a 50% expansion in the current rice irrigated area in Tanzania. Even without irrigation expansion, the 80% SRI can increase rice production by 1.5 million tons annually while enhancing water availability for industrial and environmental uses (e.g., ecological preserves) and help achieve food security in Tanzania and the greater sub-Saharan Africa.
1. Introduction
Water is a valuable resource that is becoming increasingly scarce due to growing population and intensifying agriculture [1]. Water scarcity is challenging the ability of countries to meet the increasing food demand [2]. Globally, agriculture is the largest consumer (≈70%) of freshwater accounting for 90% of consumptive water use [3,4]. Of the three main food crops (maize, wheat, and rice), rice is the most important crop especially in developing countries [5]. Given its large water footprint, practices that can reduce water inputs for rice production such as deficit irrigation need to be explored. Deficit irrigation is a technique used to minimize water losses and increase water efficiency, especially in areas where there is insufficient water supply for irrigation. Deficit irrigation management involves inducing marginal stress, except in critical growth stages where crop yield might be negatively affected [6].
Expansion of rice growing area is larger than any other crop in Africa due to its increasing demand. [7]. Tanzania is the largest (947,303 km2) country in East Africa and accounts for 9% (2.6 million ton) of African rice production (30.8 million ton) [8]. However, due to a rising gap between production and consumption, many African countries, including Tanzania, are becoming increasingly dependent on rice imports [9,10]. At the same time, increasing irrigation withdrawals and spatial and temporal variability in rainfall and surface flows are causing water scarcity in many parts of Tanzania such as the Pangani and Rufiji River basin [11,12]. The Pangani and Rufiji rivers support majority of irrigated agriculture in Tanzania and support almost entire hydroelectric generation in Tanzania (Mtera, Kidatu and Kihansi plants) [12]. Growing population, increasing food demands, and increased rainfall variability due to changed climate is likely to exacerbate water availability in the future. There is a need to develop alternative farming systems that can increase or sustain rice yields with reduced water footprint to ensure the food security in Tanzania.
Field water use for rice typically ranges from 1000–2000 mm [13], which is 2–3 times of other cereal crops. In rice production systems, a large quantity of water is lost through evapotranspiration, surface runoff, seepage, and deep percolation [14]. Several water-saving irrigation techniques have been developed for rice [15]. For instance, in Asia, the most widely adopted water-saving practice is aerobic rice production system. Although the aerobic rice system reduces water use it also results in lower yields compared to lowland flooded rice [16]. This practice also has some limitations related to soil type, rice variety, and socio-economic constraints [17]. Other strategies being pursued to reduce rice water requirements include alternate wetting and drying (AWD) and saturated soil culture [18]. Studies show that AWD can reduce crop water requirements while maintaining or even increasing the yield as compared to the conventional flooded system [19,20]. The AWD is an irrigation practice where water is applied to attain certain depth of ponding after which the field is left unirrigated for some time (e.g., 5 to 7 days) to dry out or drain. In the traditional continuously flooded (CF) system, water is applied at a frequency that will maintain a certain depth (e.g., 5 cm) of ponding throughout the season. Under the CF, more than 50% of irrigation water is lost through seepage, deep percolation, and excessive unproductive evaporation [21].
The system of rice intensification (SRI) is a relatively new production practice that has been adopted by many farmers in Asia and Sub-Saharan Africa [22,23,24,25]. The SRI is a combination of agronomic practices comprising of land preparation, seed selection, nursery establishment, transplanting of young age seedlings (8 to 12 days), wider plant spacing, AWD, and frequent weeding [22,26]. The SRI practice has been reported to substantially increase the yields as compared to the CF system [27]. The AWD irrigation technique used in the SRI production system can reduce water use by minimizing evaporation and deep percolation losses. The SRI combined with AWD has a potential to reduce water application and yet increase or sustain current yields in Tanzania. A range of AWD regimes are possible with SRI. However, limited research has been conducted on the evaluation of SRI in combination with different AWD regimes (e.g., ponding depth) in Tanzania. The current SRI practice lacks specific information regarding the irrigation management needed to achieve optimum yield. The goal of this study was to find water sustainable rice production systems in Tanzania by comparing water and yield metrics of conventional continuously flooded rice with SRI production system under different AWD regimes during wet (February-June) and dry (September-January) seasons. Specifically, the study attempts to answer the following questions: (a) Can SRI-AWD combination with reduced ponding depth significantly increase crop yield and reduce irrigation requirement compared to CF? (b) Which irrigation management strategy (scheduling and ponding depth) provides highest water productivity?
2. Methods and Materials
2.1. Study Area
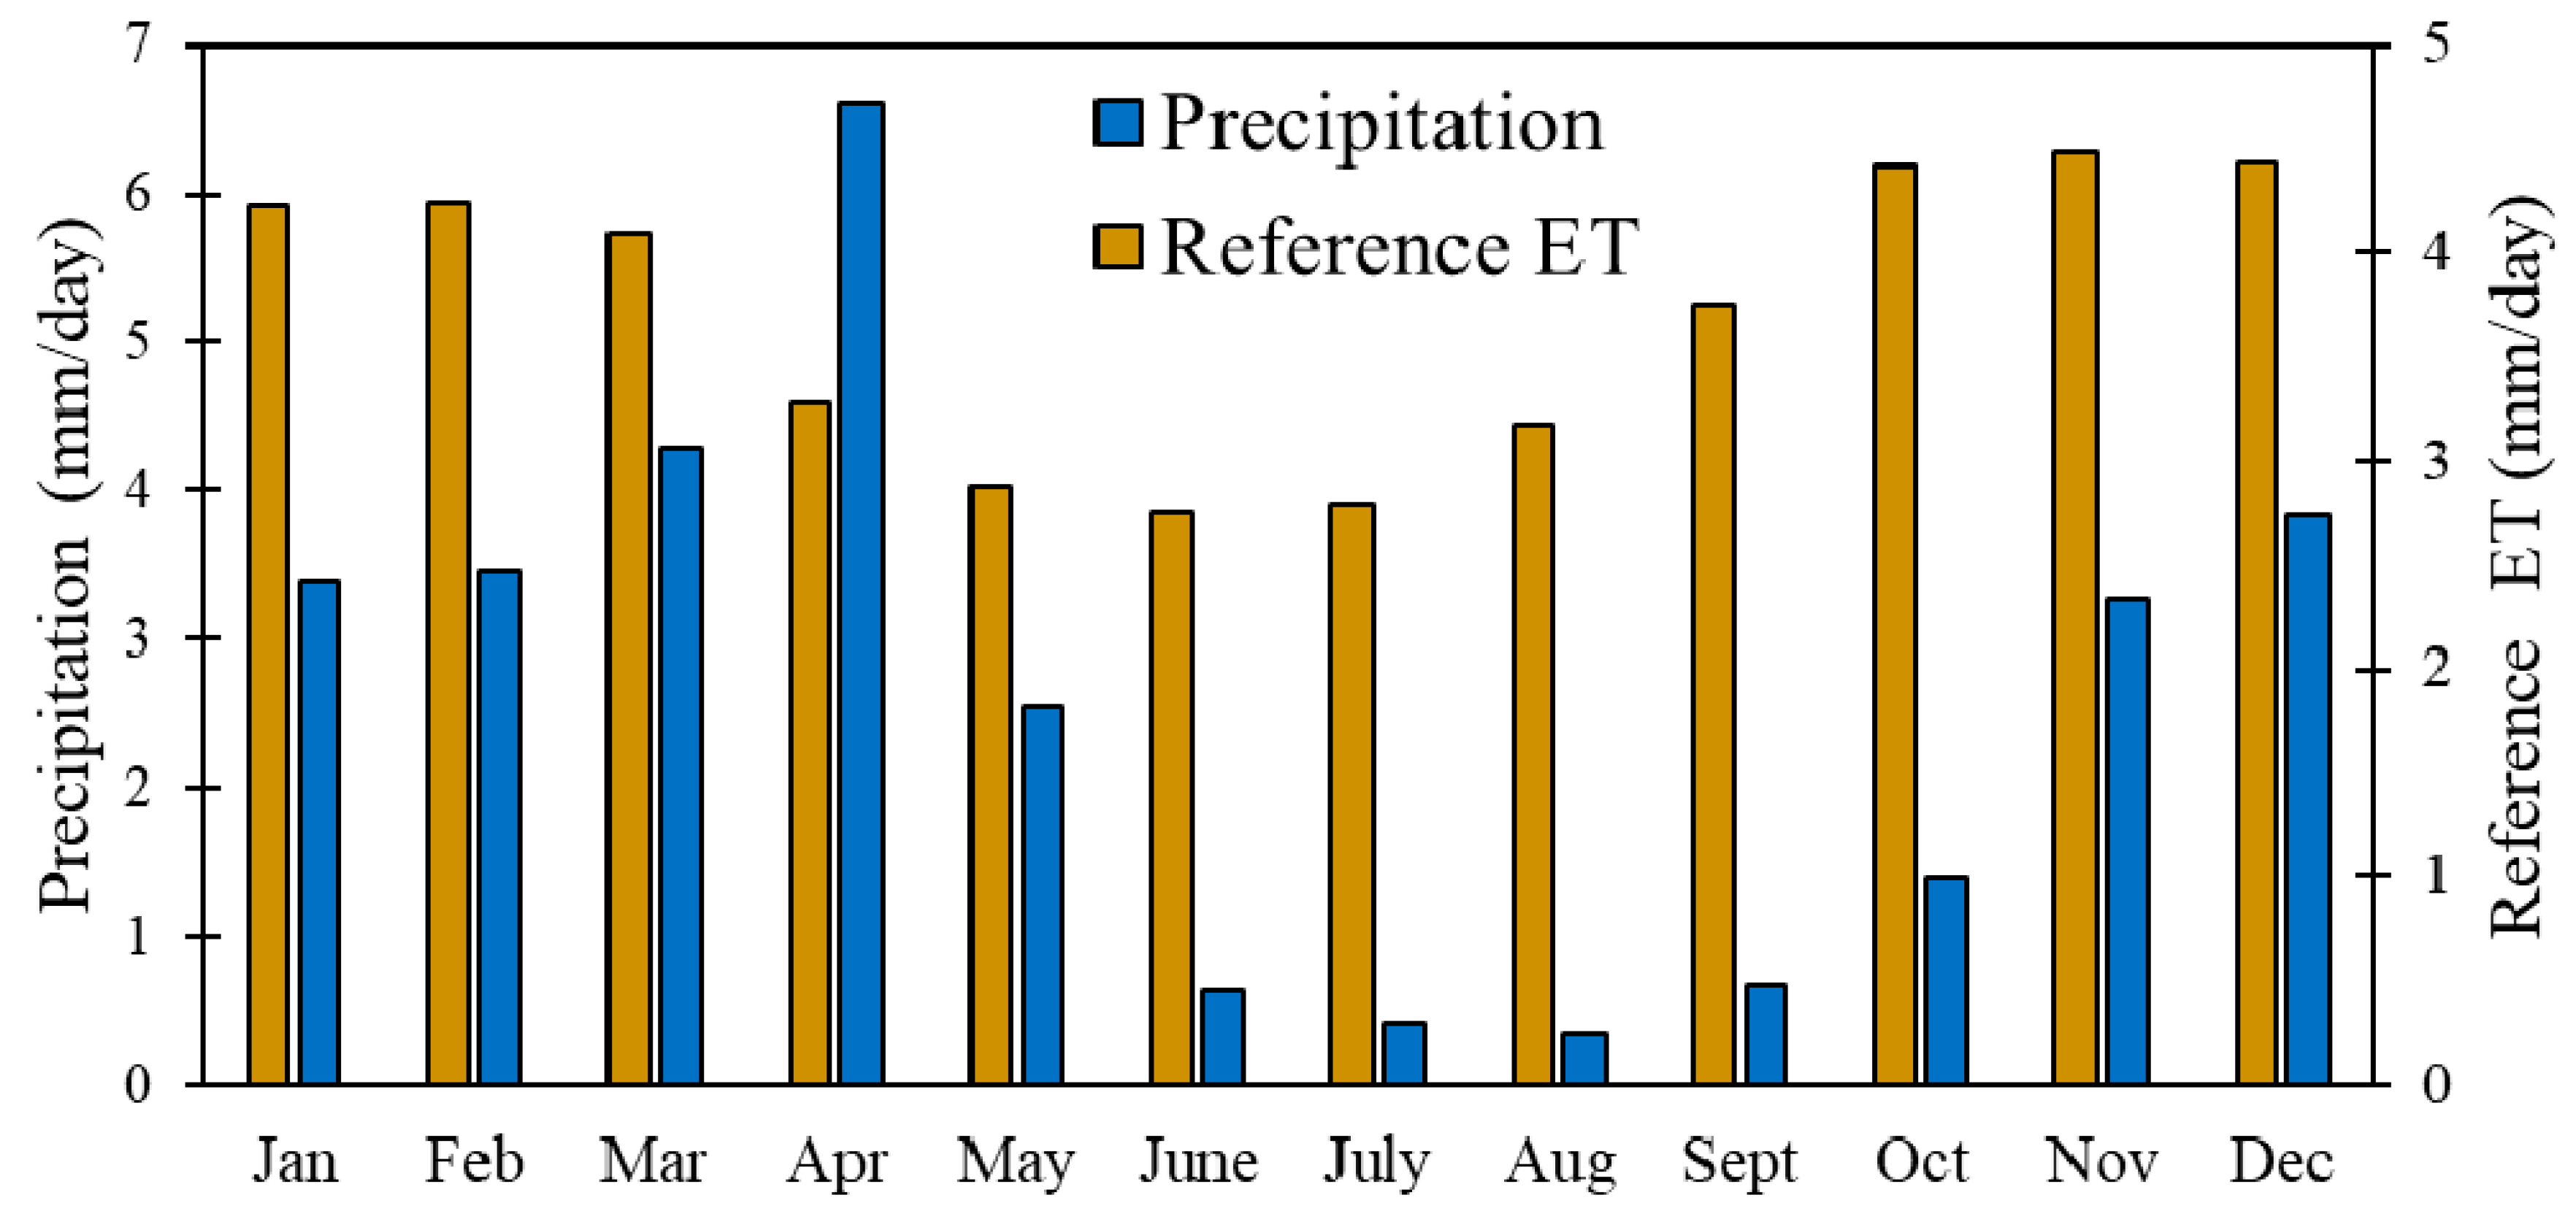
The experiment was conducted in Morogoro, located 200 km south west of the city of Dar es Salaam. The experimental fields were located at the research farm of Sokoine University of Agriculture (SUA) (latitude = 37°39′26″ E and longitude = 6°51′5″ S) at an altitude of 510 m above mean sea level. The average annual temperature at the site is 23 °C with a minimum of 15 °C in July and a maximum of 32 °C in November and December. The mean relative humidity (1971–2000) for the area is 73%. Rice is grown during two seasons, dry (September–January) and wet (February–June) seasons. These two growing seasons have different irrigation needs due to differences in rainfall (1971–2000 average wet season rainfall = 53 cm and dry season = 38 cm) and evaporative demands. The seasonal mean (1971–2000) relative humidity is 66% and 78% for the dry and wet seasons, respectively. Humidity, wind speed, solar radiation, and temperature data, measured at the SUA meteorological station, were used to calculate reference evapotranspiration (ETo) using FAO Penman-Monteith method [28] (Figure 1). The average ETo for the wet and dry seasons are 52 and 64 cm, respectively. Given this weather variability, the optimum irrigation strategy for the dry season is likely to be different from the wet season. Although water availability limits large-scale production, better yields promote rice production during the dry season.
The experiment was conducted during the dry and wet seasons of 2012–2013. For 2013 wet season, the experimental site was moved to another plot within the same research farm due to land availability issues. Annual rainfall was measured at the site using a standard rain gauge. Another set of rainfall measurements were taken at the meteorological station at SUA. The rainfall system is bimodal, characterized by two rainfall peaks with short rains from October to December and long rains from March to May (Figure 1). Measured rainfall at the site was 489 mm and 1379 mm during the dry and wet season, respectively. High rainfall in the wet season disrupted the AWD cycle for all the SRI treatments. The top soil (0–30 cm) at the research site is a dark brown, clay loam (47% clay, 7% silt and 46% sand). The soil is acidic with a pH of 5.6. The volumetric water content at field capacity and permanent wilting point is 40.1% and 28.7%, respectively for the top soil (0–30 cm). The saturated hydraulic conductivity of the top 30 cm soil is 0.35 mm/h. Soil texture (sand, silt and clay percent) and bulk density data obtained from collected soil samples were used to estimate soil water retention and saturated hydraulic conductivity parameters [29].
2.2. Experimental Design
The layout of the experiment was a complete randomized block design (CRBD) with factorial arrangement of four treatments with three replications. A total of 12 experimental fields (area each field = 40 m2) were identified within a rice field. Four production systems (treatments) with differential irrigation volumes evaluated in this study included: (1) continuous flooding (CF, Control) (maintain 50 mm ponding depth for the entire season); (2) SRI (maintain 40 mm ponding depth for three consecutive days followed by no irrigation for five days); (3) 80% SRI (maintain 80% of the SRI ponding depth i.e., 32 mm for three consecutive days followed by no irrigation for five days); and (4) 50% SRI (maintain 50% of the SRI ponding depth i.e., 20 mm for three consecutive days followed by no irrigation for five days). All the SRI systems involved alternate wetting and drying (AWD) during the initial stages. After the panicle initiation stage, continuous flooding was practiced in all the SRI treatments to maintain 20 mm ponding depth until plant senescence to ensure better grain filling. Important dates for the two seasons are shown in Table 1.
The SRI treatments involved transplanting 12-day seedlings, with two leaves. The seedlings were transplanted carefully and quickly to minimize seedling damage. The number of seedling per hill was one for all the SRI treatments; this allowed optimum growth without competition for nutrients. For the CF treatment, based on the conventional practice in Tanzania, three seedlings per hill were planted. For both the CF and SRI treatments, fertilizer was applied at a rate of 50 kg/ha (N), 50 kg/ha (K2O) and 50 kg/ha (P2O5) before the last puddling event. Weeding was done manually at 12-day intervals using a spike-toothed harrow. To encourage greater root and canopy growth, plant-to-plant and row-to-row spacing was maintained at 25 cm for all the SRI and CF treatments.
2.3. Sri Management
Each experimental plot was leveled to allow uniform water ponding. The soil was kept saturated for five days, and then rotavated. The field was harrowed twice at an interval of three days to ensure proper soil-water mixture. Twelve-days-old seedlings were transplanted before the emergence of a third leaf. Care was taken to separate the seedling from the seedbed to avoid damage to the young root. One seedling was planted per hill at a depth of two cm on the 25 cm square grid. Between the transplanting and appearance of panicles, three to five days irrigation cycle was followed, i.e., the field was irrigated for three consecutive days and then left to dry for five days. The goal was to keep the soil moist but not saturated to allow air to get into the soil for improved soil health and root growth. After panicle initiation, irrigation was applied to maintain 20 mm ponding for all three SRI treatments.
2.4. Irrigation and Soil Moisture Measurements
Irrigation water volume for each treatment was measured using a propeller type flow meter. Soil moisture was measured every 15-min using a capacitance probe (EnviroScan, Sentek Technologies, Stepney, Australia; sensors at 10, 20, 30, 60, 80, and 90 cm below the soil surface) in one of the plots for each of the four treatments. Manufacturer provided calibration equation for clay loam soil was used to measure the soil moisture content at multiple depths. Capacitance-type soil moisture probes provide reasonable soil moisture measurements even without site-specific calibration (3–4% accuracy) and therefore, could be used for irrigation scheduling [30,31]. Measured soil moisture data from capacitance probes have been successfully used to determine irrigation water requirements and scheduling for agricultural crops [32,33]. Furthermore, measured average maximum soil moisture (saturation moisture) within and below the root zone at the study site was 48–60% which is close to the estimated saturation moisture content of 45–50%. Therefore, measured soil moisture was assumed to adequately represent the actual soil moisture content and its variation during the growing seasons. The capacitance probes were connected to a CR206 datalogger (Campbell Scientific Inc., Logan, UT, USA) to store the data. For the dry season, soil moisture was measured from 3 November 2012 to 30 January 2013. During the wet season, soil moisture data could only be measured from 4 March–6 May 2013 due to theft of the datalogger.
2.5. Plant and Yield Observations
Five plants were randomly selected from each plot to measure plant height and number of tillers during each development stage. At grain maturity, the field was drained to allow the soil to dry before harvesting. Three one m quadrants were selected in each plot for yield measurements. Dry biomass (oven dried for 24 h or more until no change in weight) of different plant organs (stem, leaves and panicles) was weighed. Length and width of leaves were measured manually to estimate leaf area index (LAI) using the method by Yin et al. (2000) [34].
2.6. Data Analysis
All statistical analyses were conducted using SAS [35]. The data were analyzed using Tukey-Kramer test for comparing pair wise differences of means [36]. Variables compared included water applied (mm), crop yield (kg/ha), soil moisture (%vol.), LAI, above ground biomass (kg/ha) and economic productivity of water (US$/ha-cm). The economic productivity of water was calculated using the income (I, $) from crop yield and volume of water applied (ha-cm, irrigation plus rainfall) [37] as:
Average farm gate paddy price of 550 Tanzanian Shillings TZS/kg [38] and prevailing exchange rate (1 US$ = 1600 TZS) during 2013 was used to calculate the income (I).
3. Results and Discussion
3.1. Plant Growth
Plant height for the CF and SRI treatments were significantly (p < 0.05) higher than both the 80% SRI and 50% SRI for both seasons (Table 2). Plant height for the CF was 23% and 63% higher than the 80% SRI and 50% SRI, respectively during the dry season. Plant height in the wet season for the CF was 11% and 30% greater than the 80% SRI and 50% SRI, respectively. More ponding depth or higher water availability is the likely reason for higher plant height in the CF as it can increase plant nutrient uptake and plant height [39,40]. Similar plant heights for the CF and SRI are likely due to similar soil moisture or water availability in the root zone.
The number of tillers for the 80% SRI was significantly higher (p < 0.05) than rest of the three treatments in both seasons (Table 2). Based on the statistical analyses results, the number of tillers can be arranged as 80% SRI > SRI = CF > 50% SRI (Table 2). For the dry season, the 80% SRI had 40% more tillers than the CF and 93% more tillers than the 50% SRI. Shortening of the vegetative stage duration has been shown to result in increased tillers [41]. High number of tillers per hill for the 80% SRI indicates higher potential yield than the rest of the treatments. Because panicles are attached to tillers, the number of tillers are usually an indicator of yield; the higher the number of tillers, the higher the potential for increased yield. The advantage of the SRI method in enhancing tiller numbers was observed by many researchers [42,43]. Transplanting of younger seedlings, higher plant spacing and soil aeration due to wetting and drying cycle promotes root growth and tillers under the SRI system [44]. Results for the wet season were similar to the dry season however the numerical differences between the treatments were much lower. Part of this difference was due to rainfall that masked the effect of differential irrigation input. Overall, the 80% SRI outperformed all other treatments in the number of tillers indicating higher yield potential than other treatments.
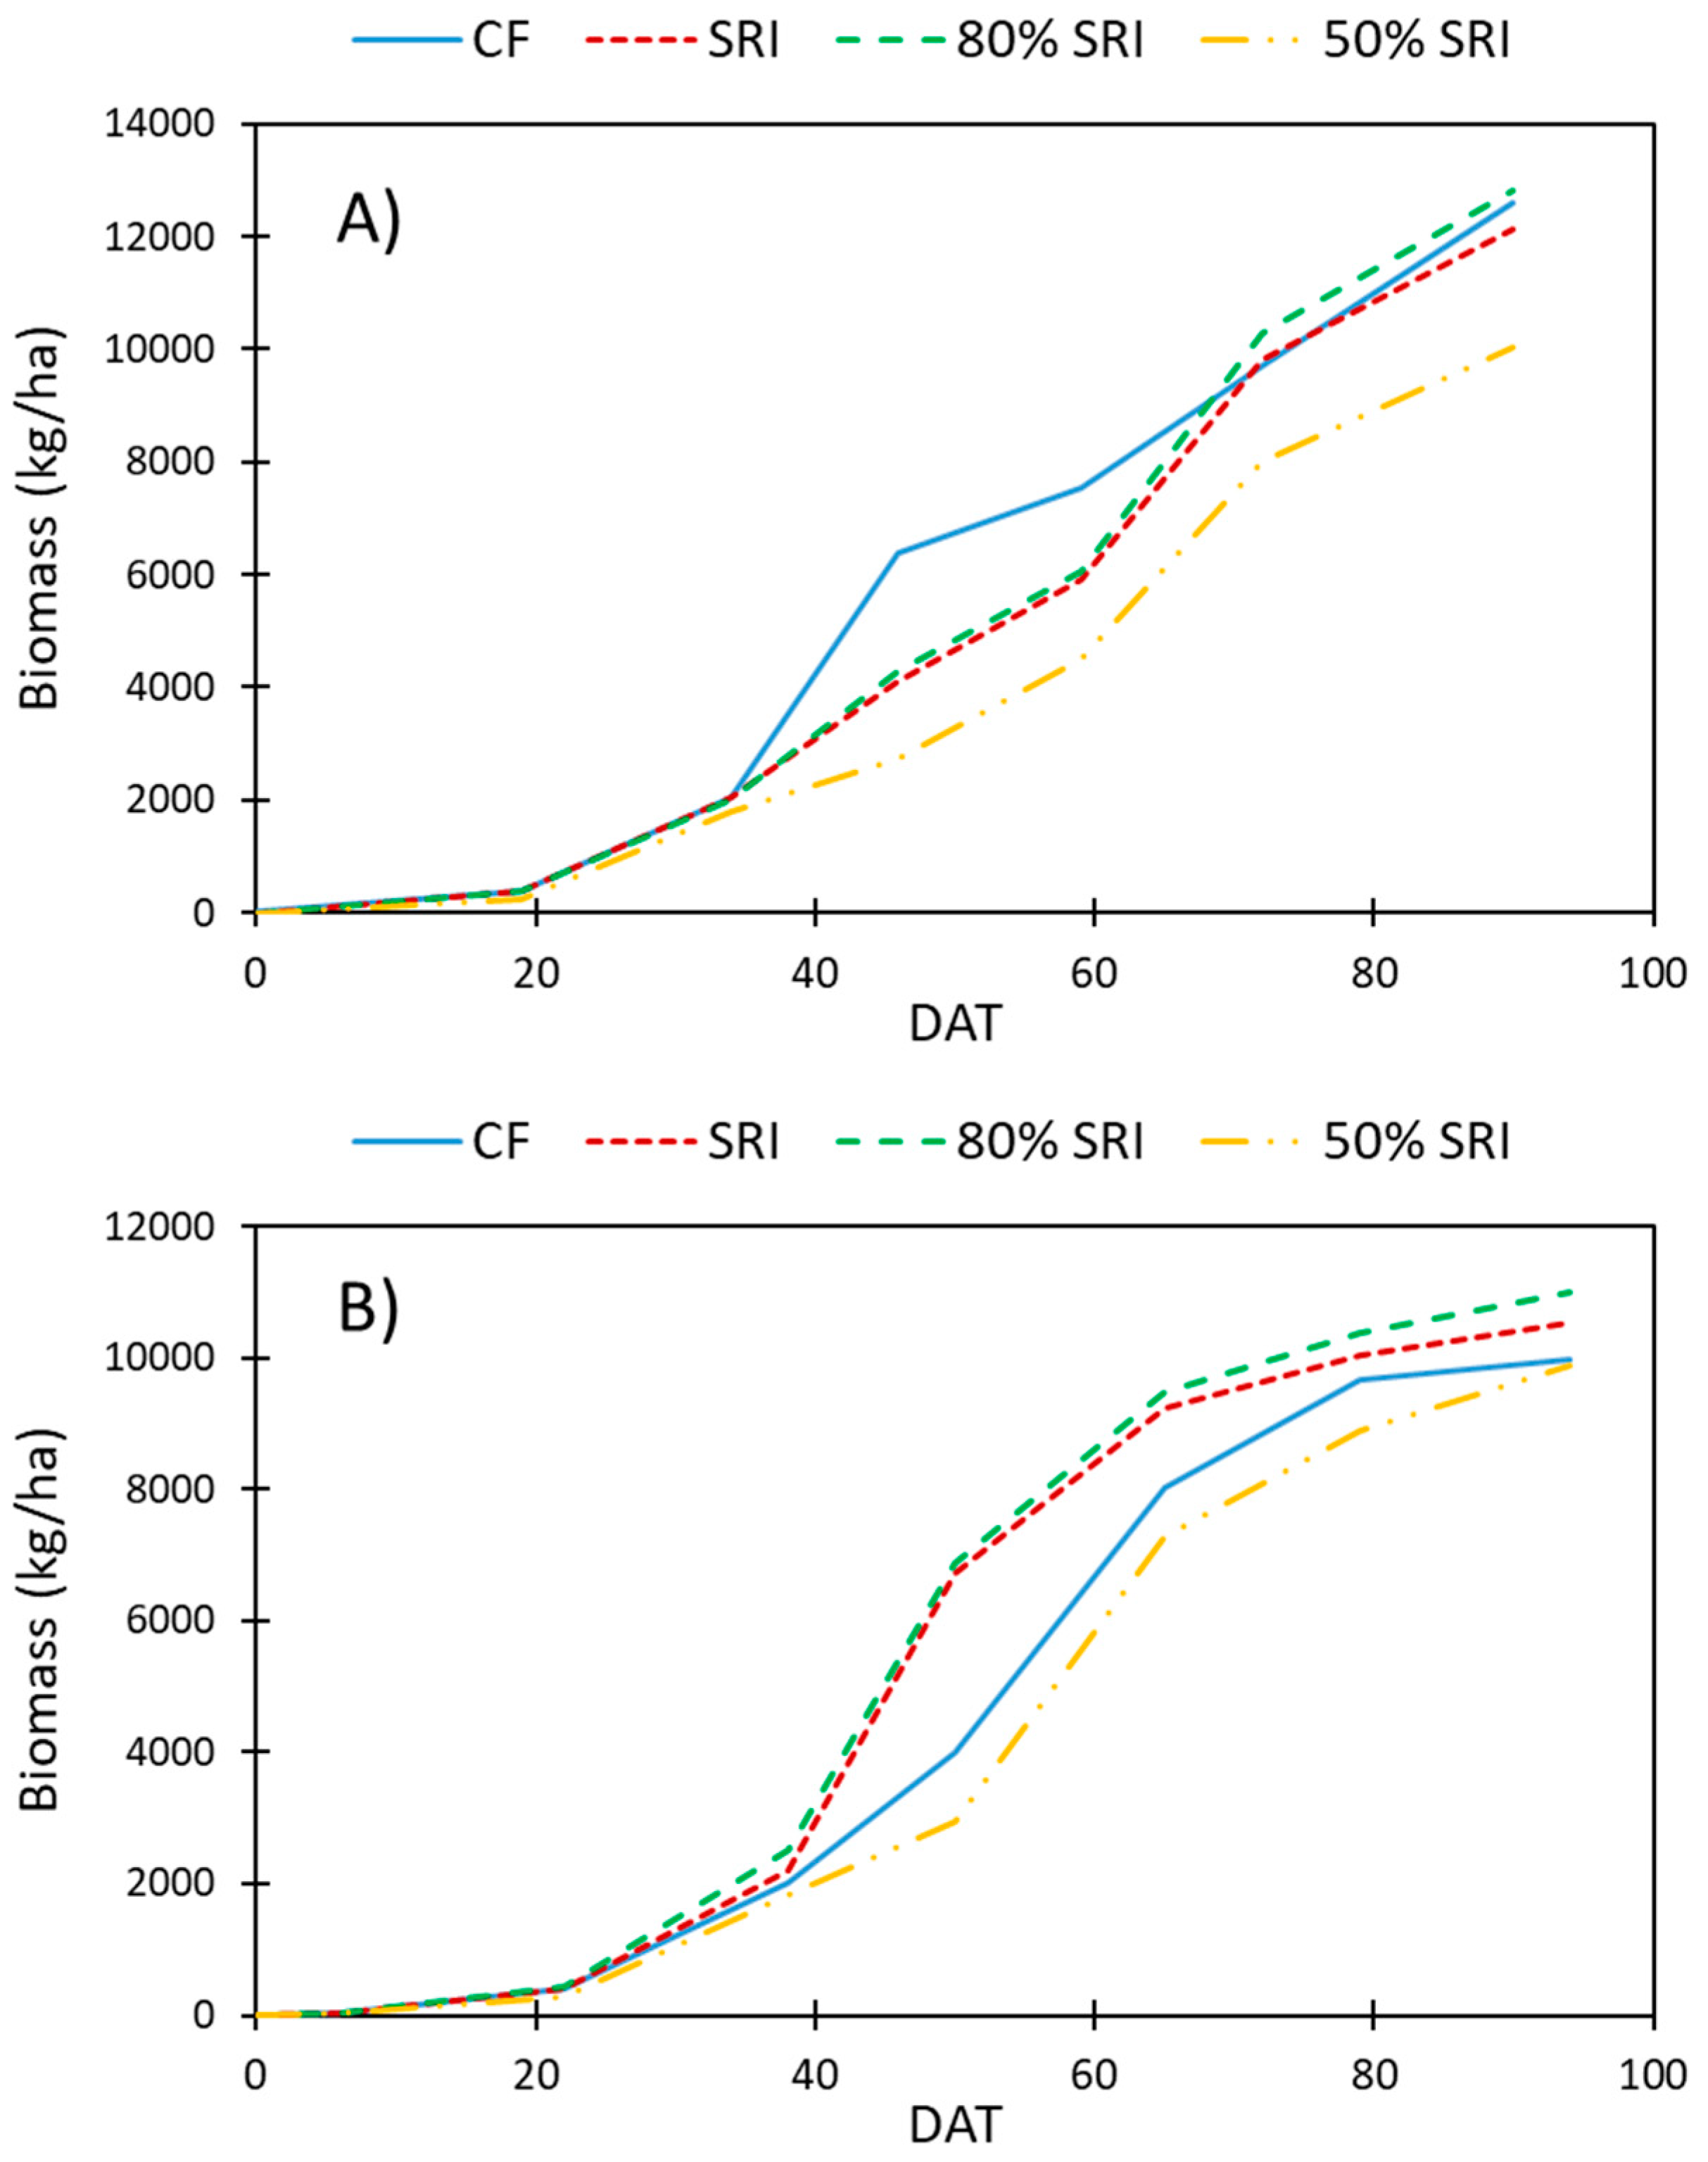
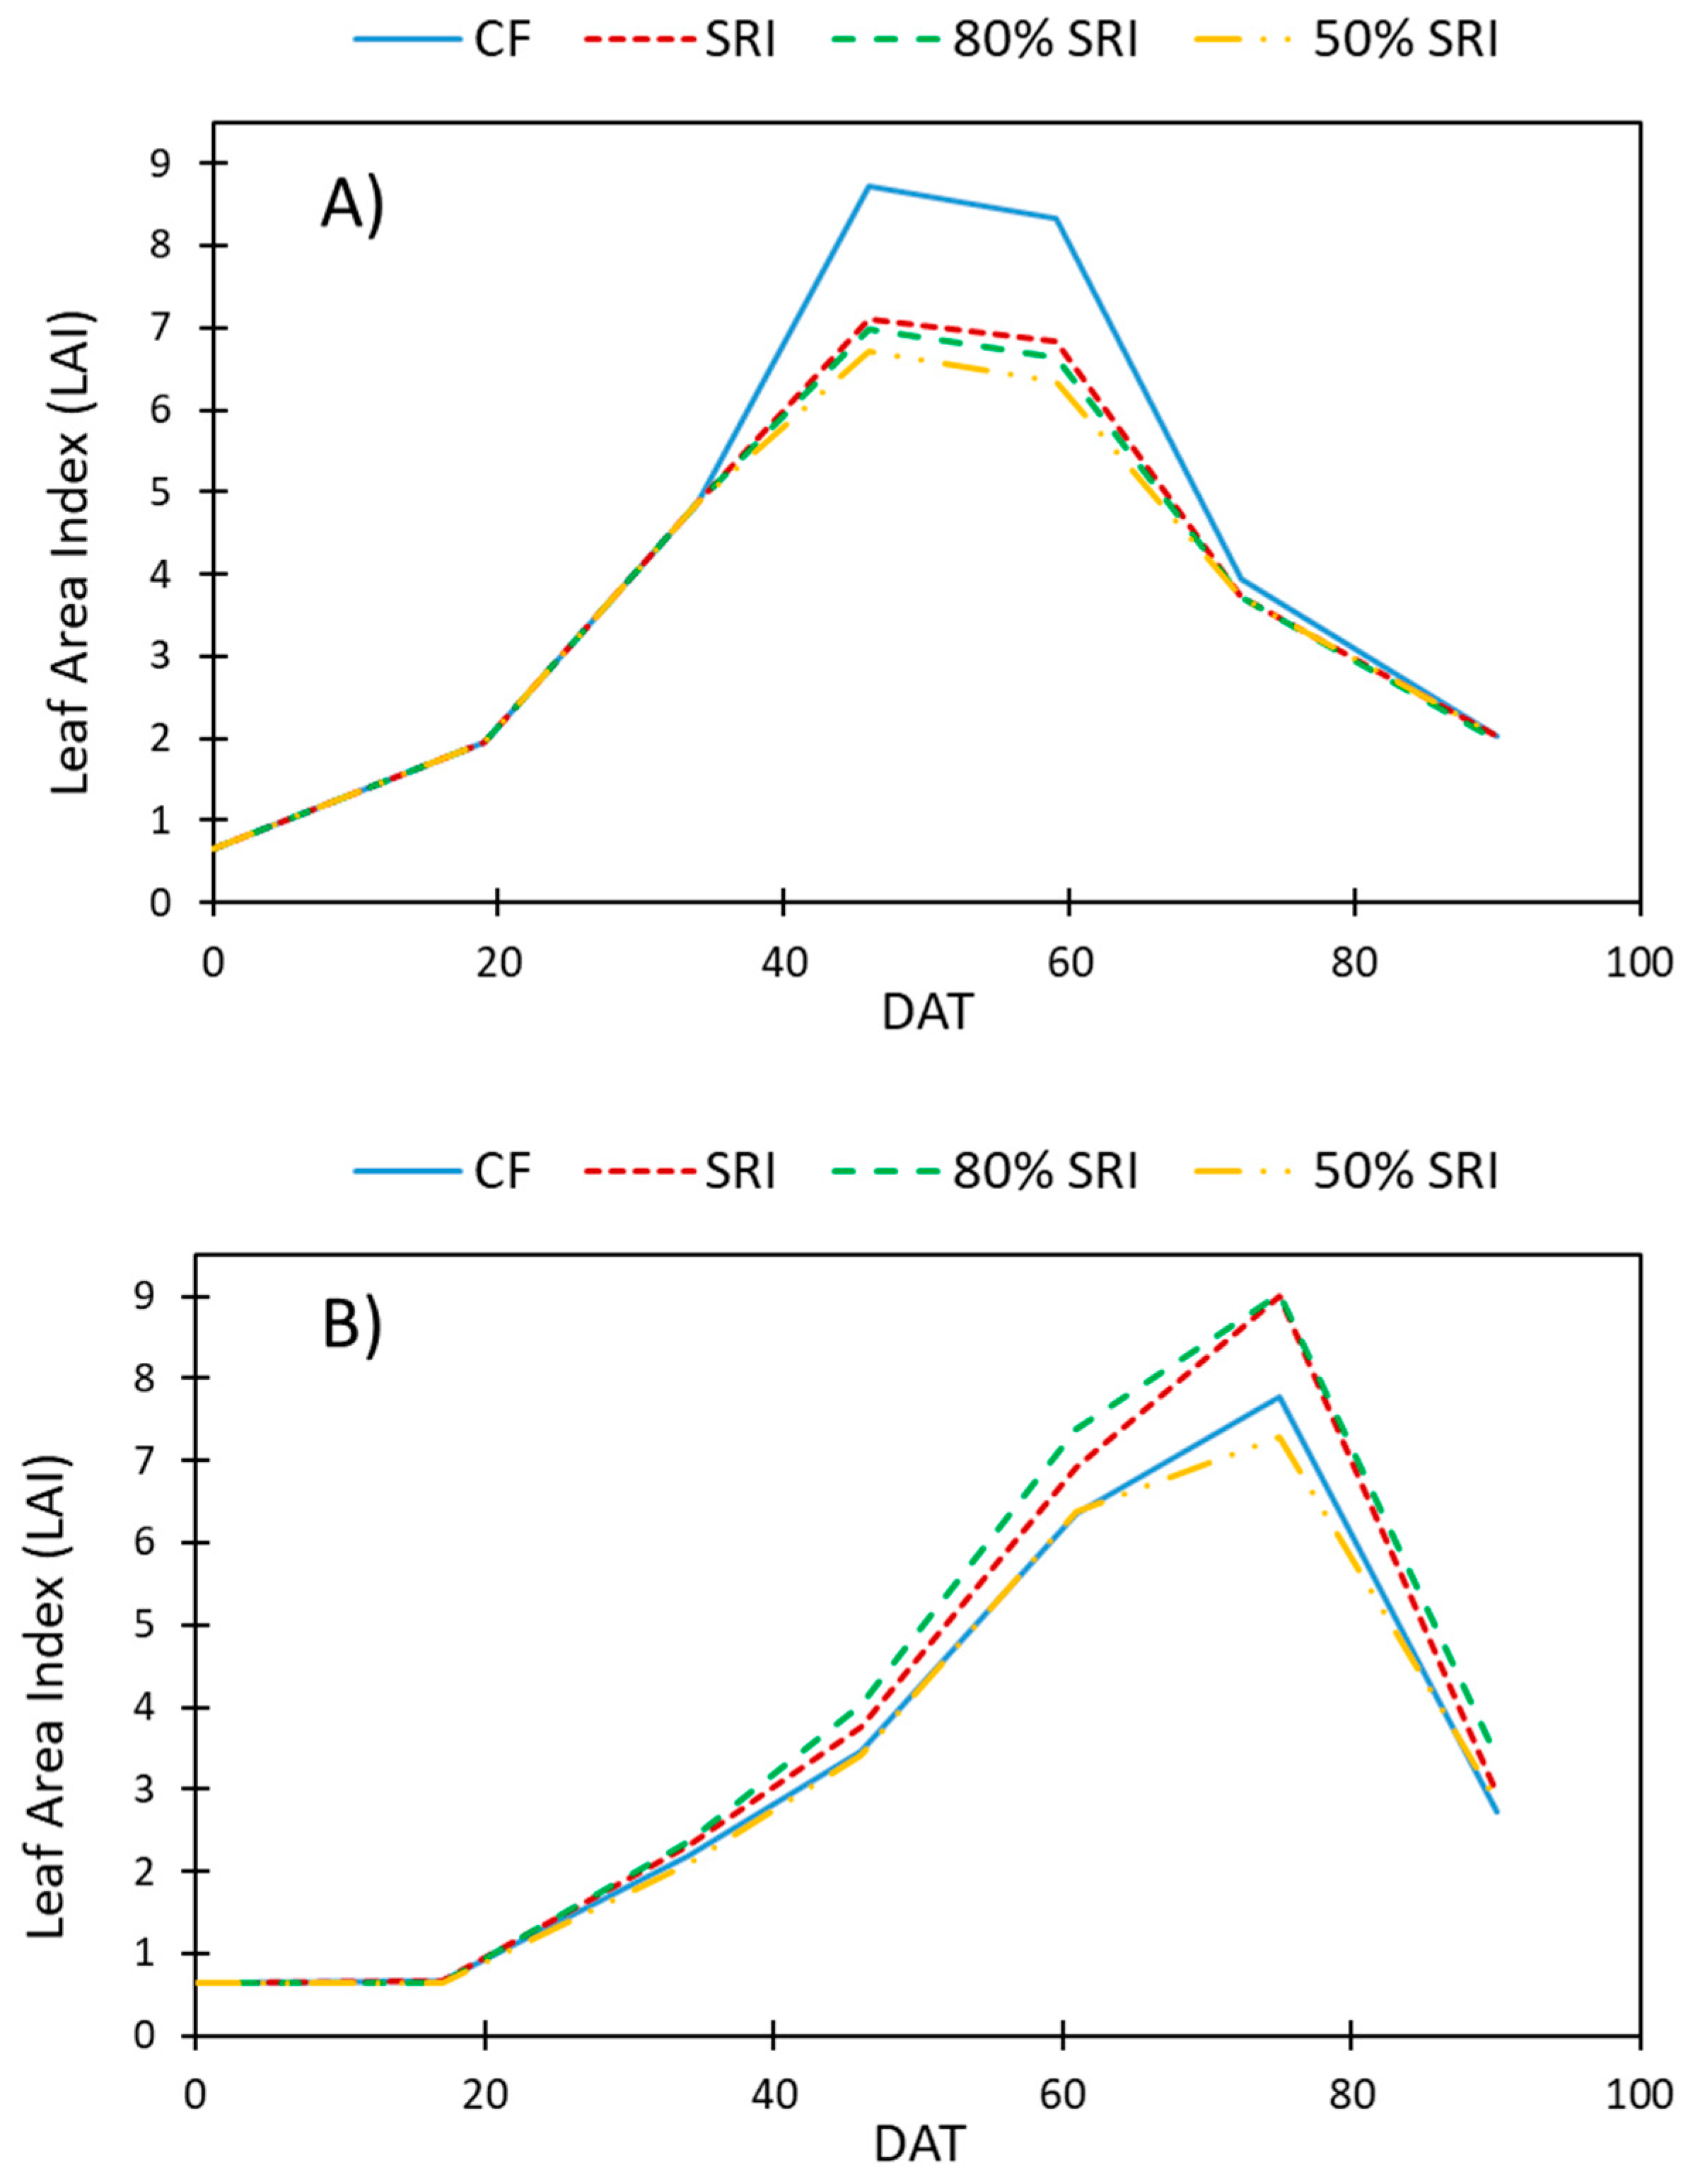
Biomass (Figure 2) and LAI (Figure 3) followed similar trends. Based on the results from statistical analyses, the order for the dry and wet seasons biomass were 80% SRI > CF > SRI > 50% SRI and 80% SRI > SRI > CF > 50% SRI (Figure 2), respectively. Higher biomass leads to higher accumulation of non-structural carbohydrate in the culms and leaf cover which can rapidly be trans-located to the panicle during the initial stage of grain filling and can increase the potential for higher crop yield [45]. Overall, key plant growth parameters such as biomass, LAI and number of tillers indicate the best plant performance for the 80% SRI treatment followed by the SRI for both seasons.
3.2. Yield
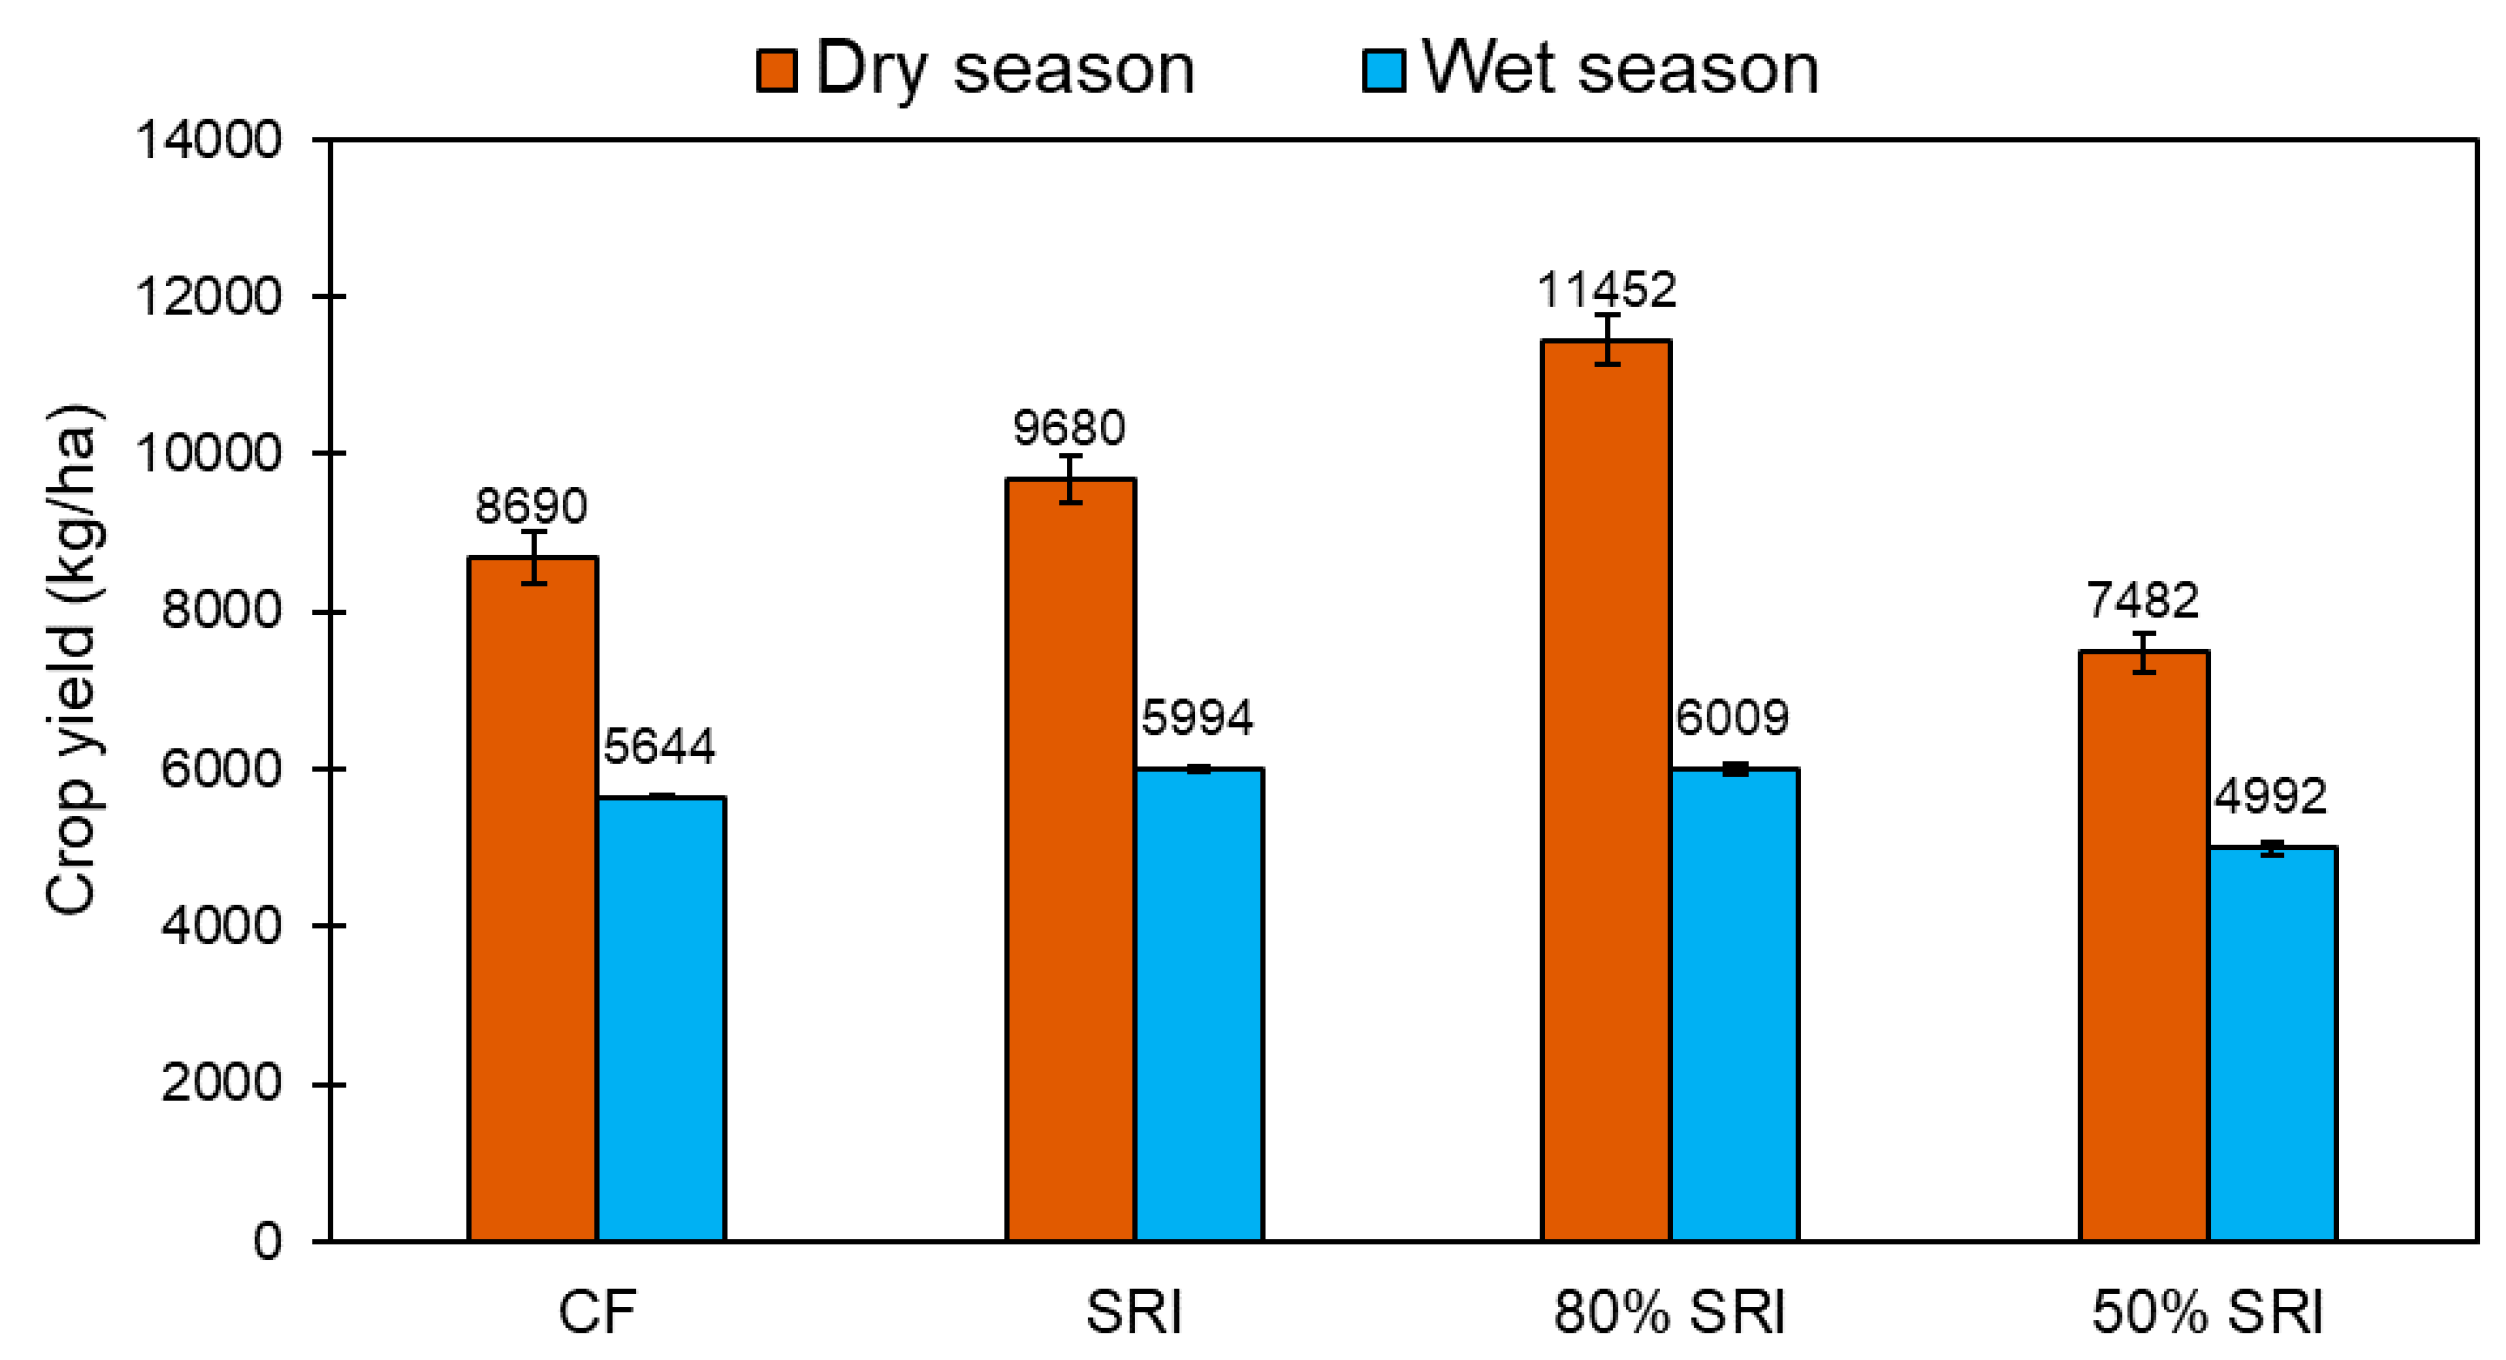
For both seasons, the 80% SRI had statistically higher yield than other treatments while the 50% SRI had the lowest yield (p < 0.05; Figure 4). Following comparisons were statistically significant (p < 0.05) for both seasons: 80% SRI > CF, CF > 50% SRI, SRI > 50% SRI. For the dry season, yield for the 80% SRI was significantly higher than the SRI (p = 0.01). However, frequent rainfall events between transplanting and panicle initiation during the wet season (March–May 2013) resulted in similar soil moisture (Figure 5 and Figure 6) in the root zone for all the SRI treatments which is the likely reason for small yield differences between the SRI, 50% SRI, and 80% SRI.
The wet season yields were lower than dry season mainly due to frequent rainfall between March and May 2013 resulting in saturated to near saturated soil moisture conditions during wet season for all treatments (Figure 5 and Figure 6). The lowest yield observed for the 50% SRI in the dry season was higher than the highest yield for the 80% SRI during the wet season. Very little rainfall during November–December 2012 helped maintain the target soil moisture for all three SRI treatments (Figure 5 and Figure 6) resulting in higher yields during the dry season as compared to the wet season.
The 80% SRI treatment produced 32% and 6% more yield than the CF for the dry and wet seasons, respectively. Although the 80% SRI treatment had almost the same yield as the SRI for the wet season, it had 18% more yield than the SRI treatment for the dry season. Higher yield for SRI is in agreement with observations from other studies [42,46,47] that noted higher grain yield when younger seedlings (8 to 12 days old) are transplanted at spacing ranging from 25 cm × 25 cm to 30 cm × 30 cm under non-flooded conditions. In this study, younger seedling and AWD irrigation were the main synergistic factors that increased the tillering ability (per hill and per area), panicle length, number of filled grains, and finally high yield for the 80% SRI treatment followed by the SRI compared to the CF.
Rice yield for the wet season was low with small differences among the treatments due to heavy and frequent rainfall at the beginning of the wet season (March and May) which resulted in sustained saturation/flooding during the wet period and prevented implementation of the SRI treatments. Similar results were observed by Stoop et al. (2002) [22], who noted that it was not possible to attain higher yields with SRI compared to CF due to frequent rainfall events. Prolonged root zone saturation due to frequent rainfall events restrict root zone aeration under SRI thereby negatively affecting root and tiller growth. For the dry season, higher yield for the 80% SRI and SRI were due to: (1) adequate soil moisture required by the plant between transplanting and panicle initiation stages which enhances nutrients uptake; (2) reduced plant stress due to non-waterlogged conditions in the root zone which promotes healthier root growth; and (3) improved soil aeration which increases microbial metabolism activity. These factors resulted in better number of tillers and yield observed in this study for 80% SRI (Table 2).
3.3. Water Use and Productivity
3.3.1. Irrigation and Soil Moisture
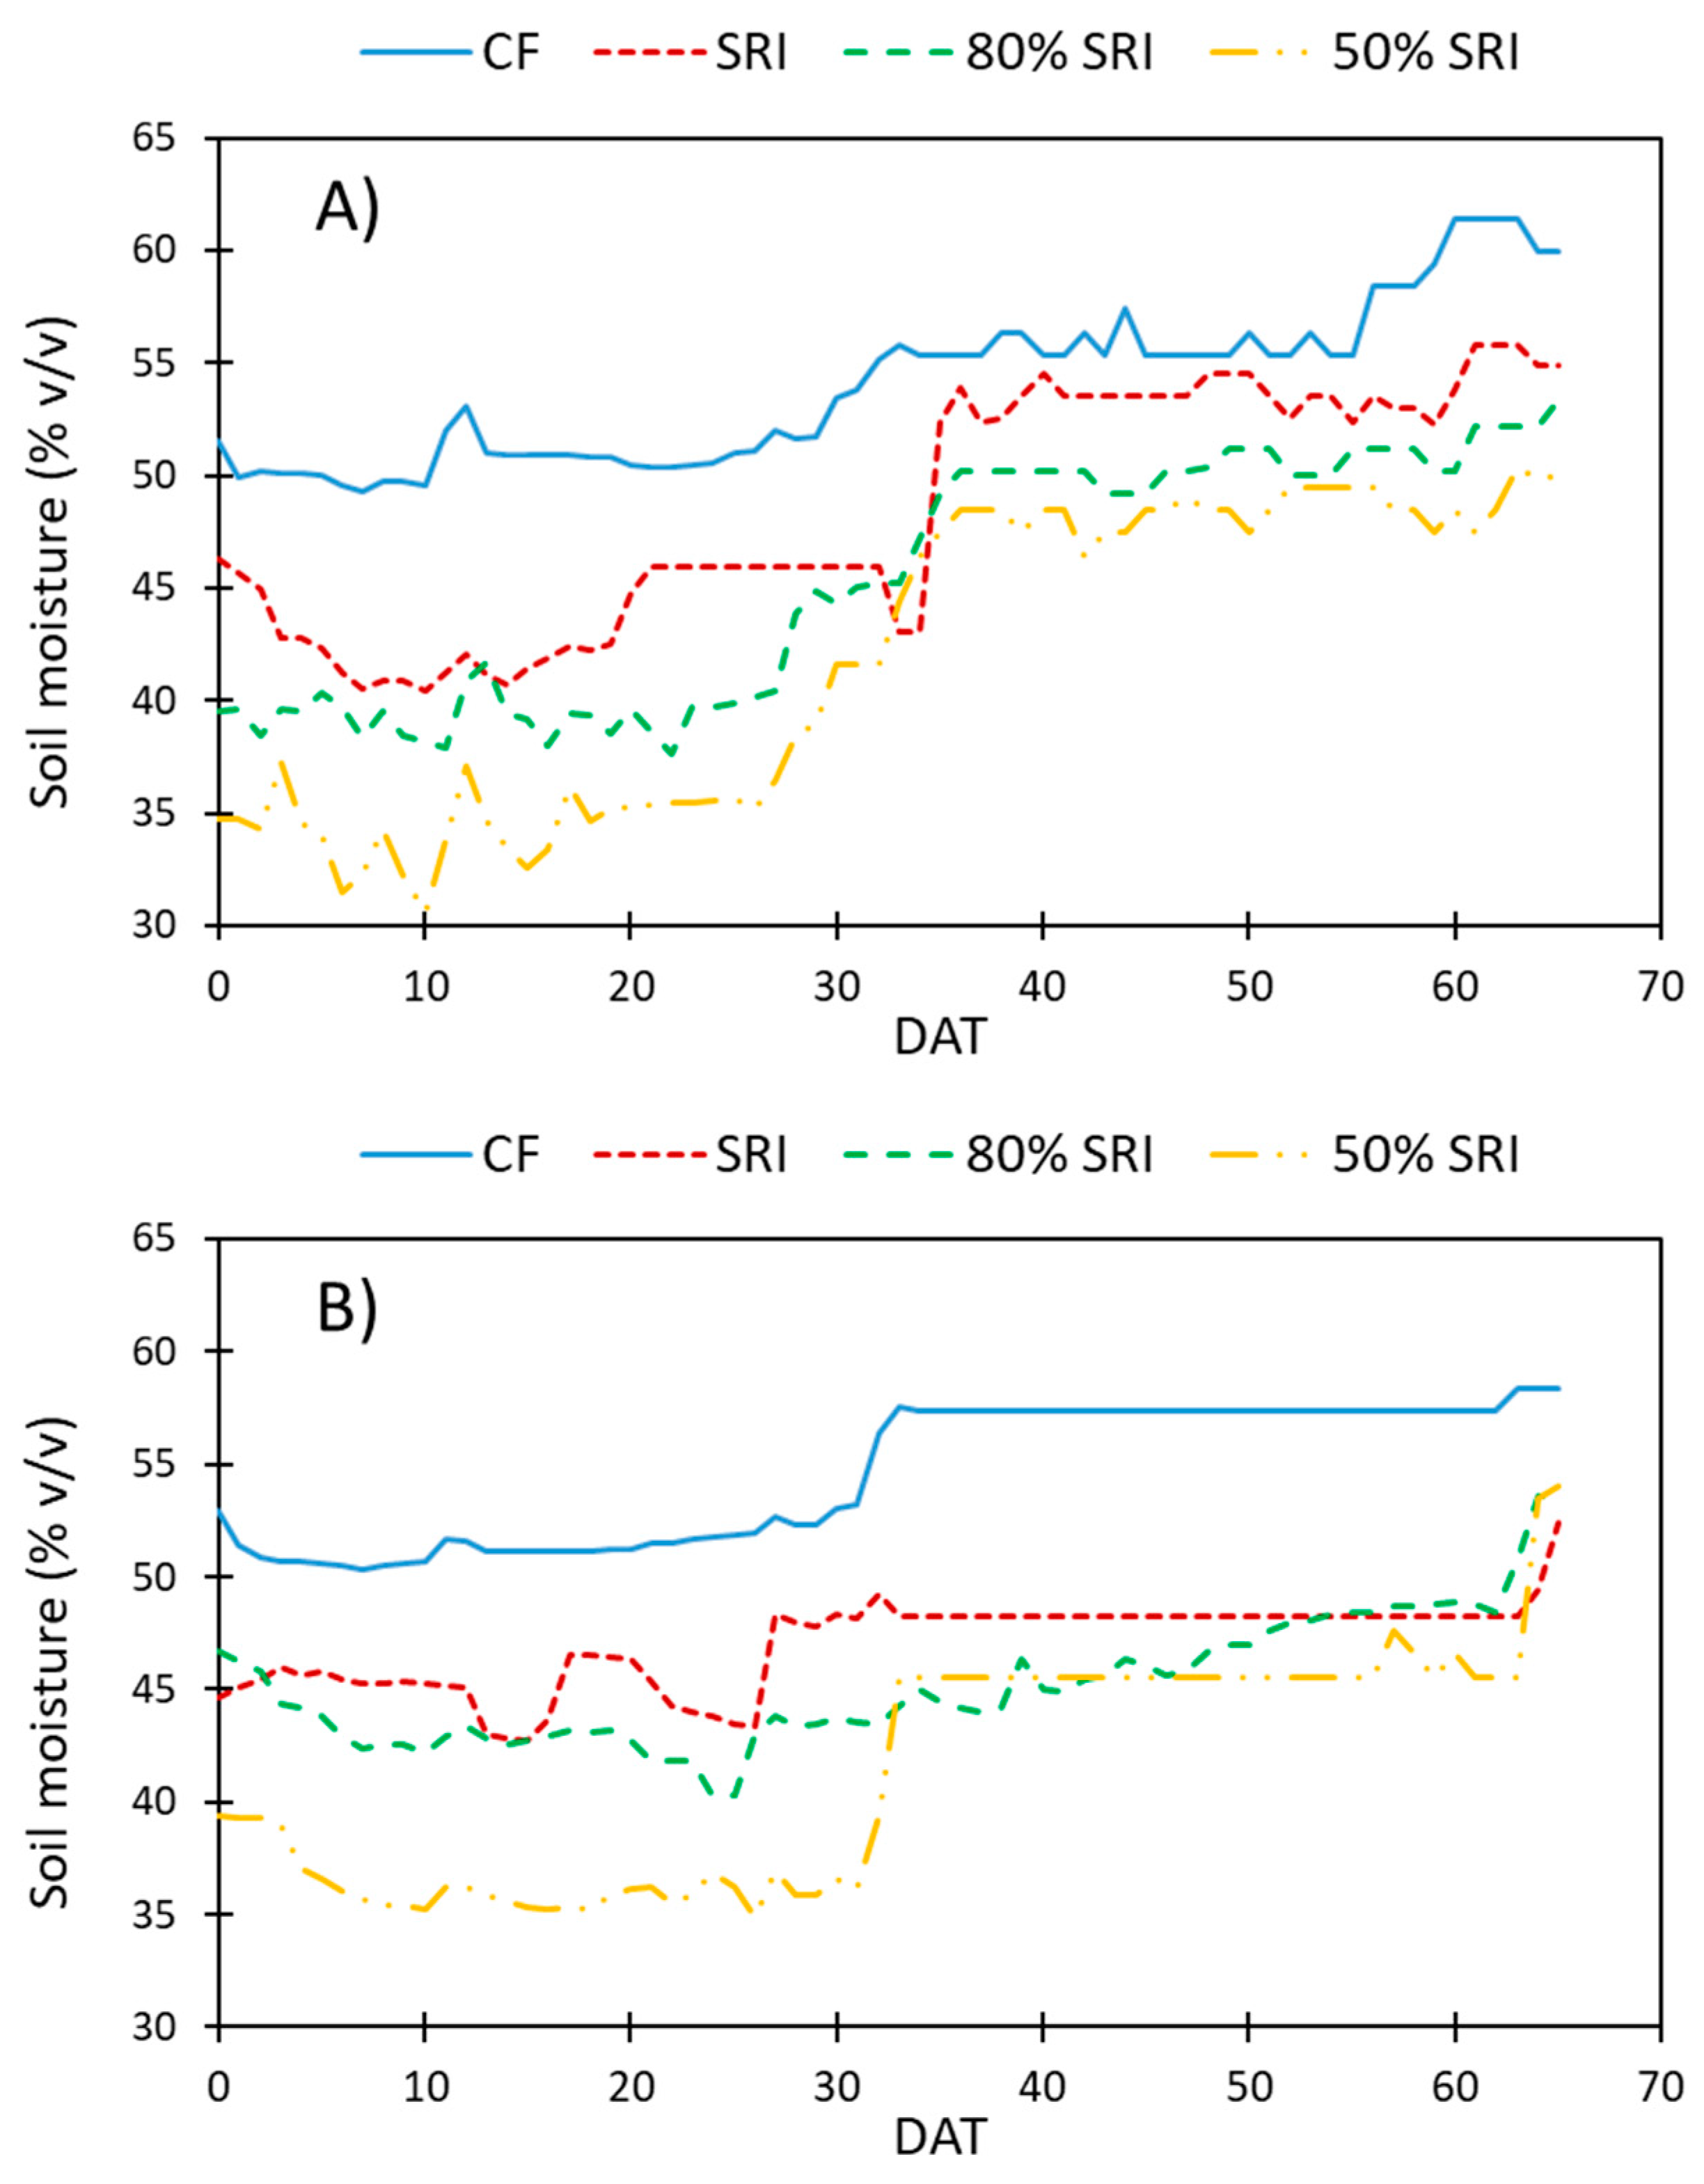
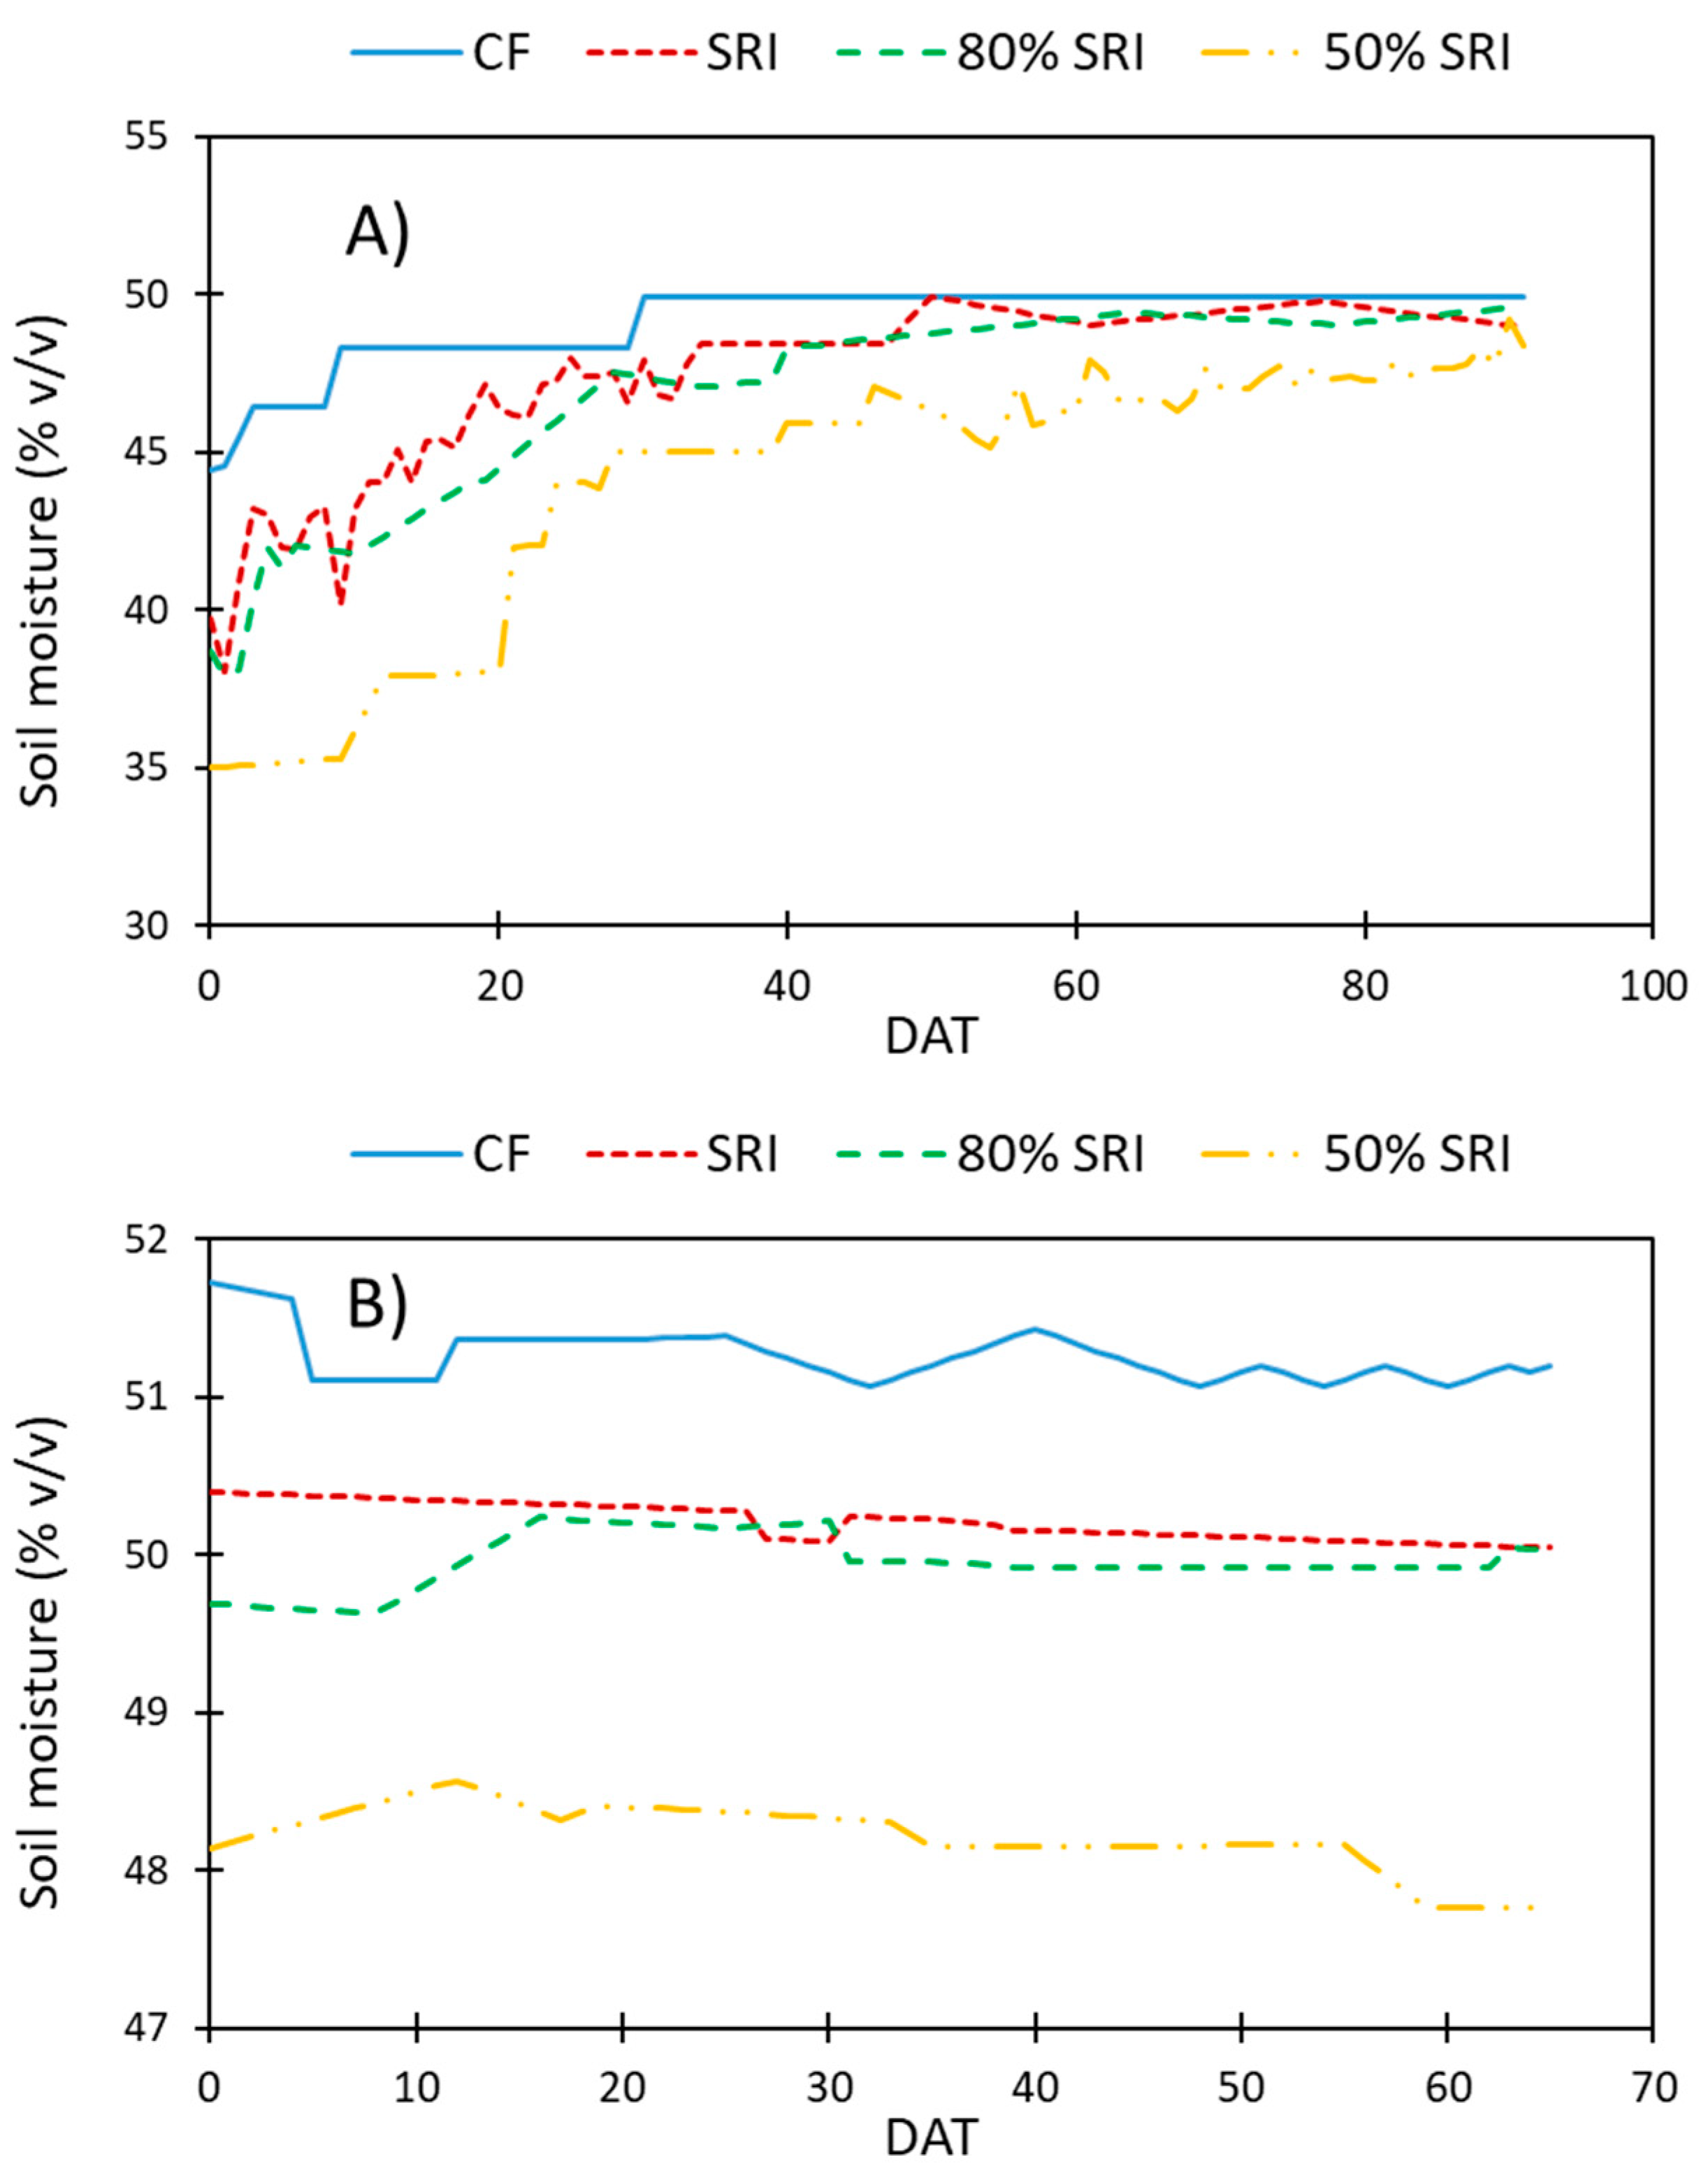
Measured soil moisture within (30 cm) and below root zone (60 cm) indicates the success of treatment implementation. During the dry season, soil moisture of all the SRI treatments fluctuated around soil field capacity from the transplanting to the panicle initiation stage after which soil moisture for all treatments was similar due to sustained flooding (Figure 5 and Figure 6). During the dry season, the only treatment that was allowed to fall below field capacity and, at times, close to wilting point during the tillering stage was 50% SRI (Figure 5). After panicle initiation stage, the soil moisture at 60 cm depth for all the SRI treatments for the dry season was similar to the CF because of continuous ponding maintained for all the treatments. Unlike dry season, soil in all the SRI treatments was near saturation during the initial part of the wet season due to frequent rainfall events (Figure 5 and Figure 6). The desired SRI irrigation cycle (wetting for 3 consecutive days and drying for 5 days) was interrupted by heavy tropical rainfall at 30 days after transplanting (DAT) which negated the effects of the irrigation management and led to similar soil moisture in the root zone for all treatments resulting in reduced yield for the SRI treatments. Similar observations were made by Kombe (2012) [48]. Given that the 80% SRI resulted in maximum yield, it can be inferred that the desired soil moisture from transplanting to panicle initiation stage within the root zone (0–30 cm) is 44–48% (vol.) which falls between field capacity to saturation.
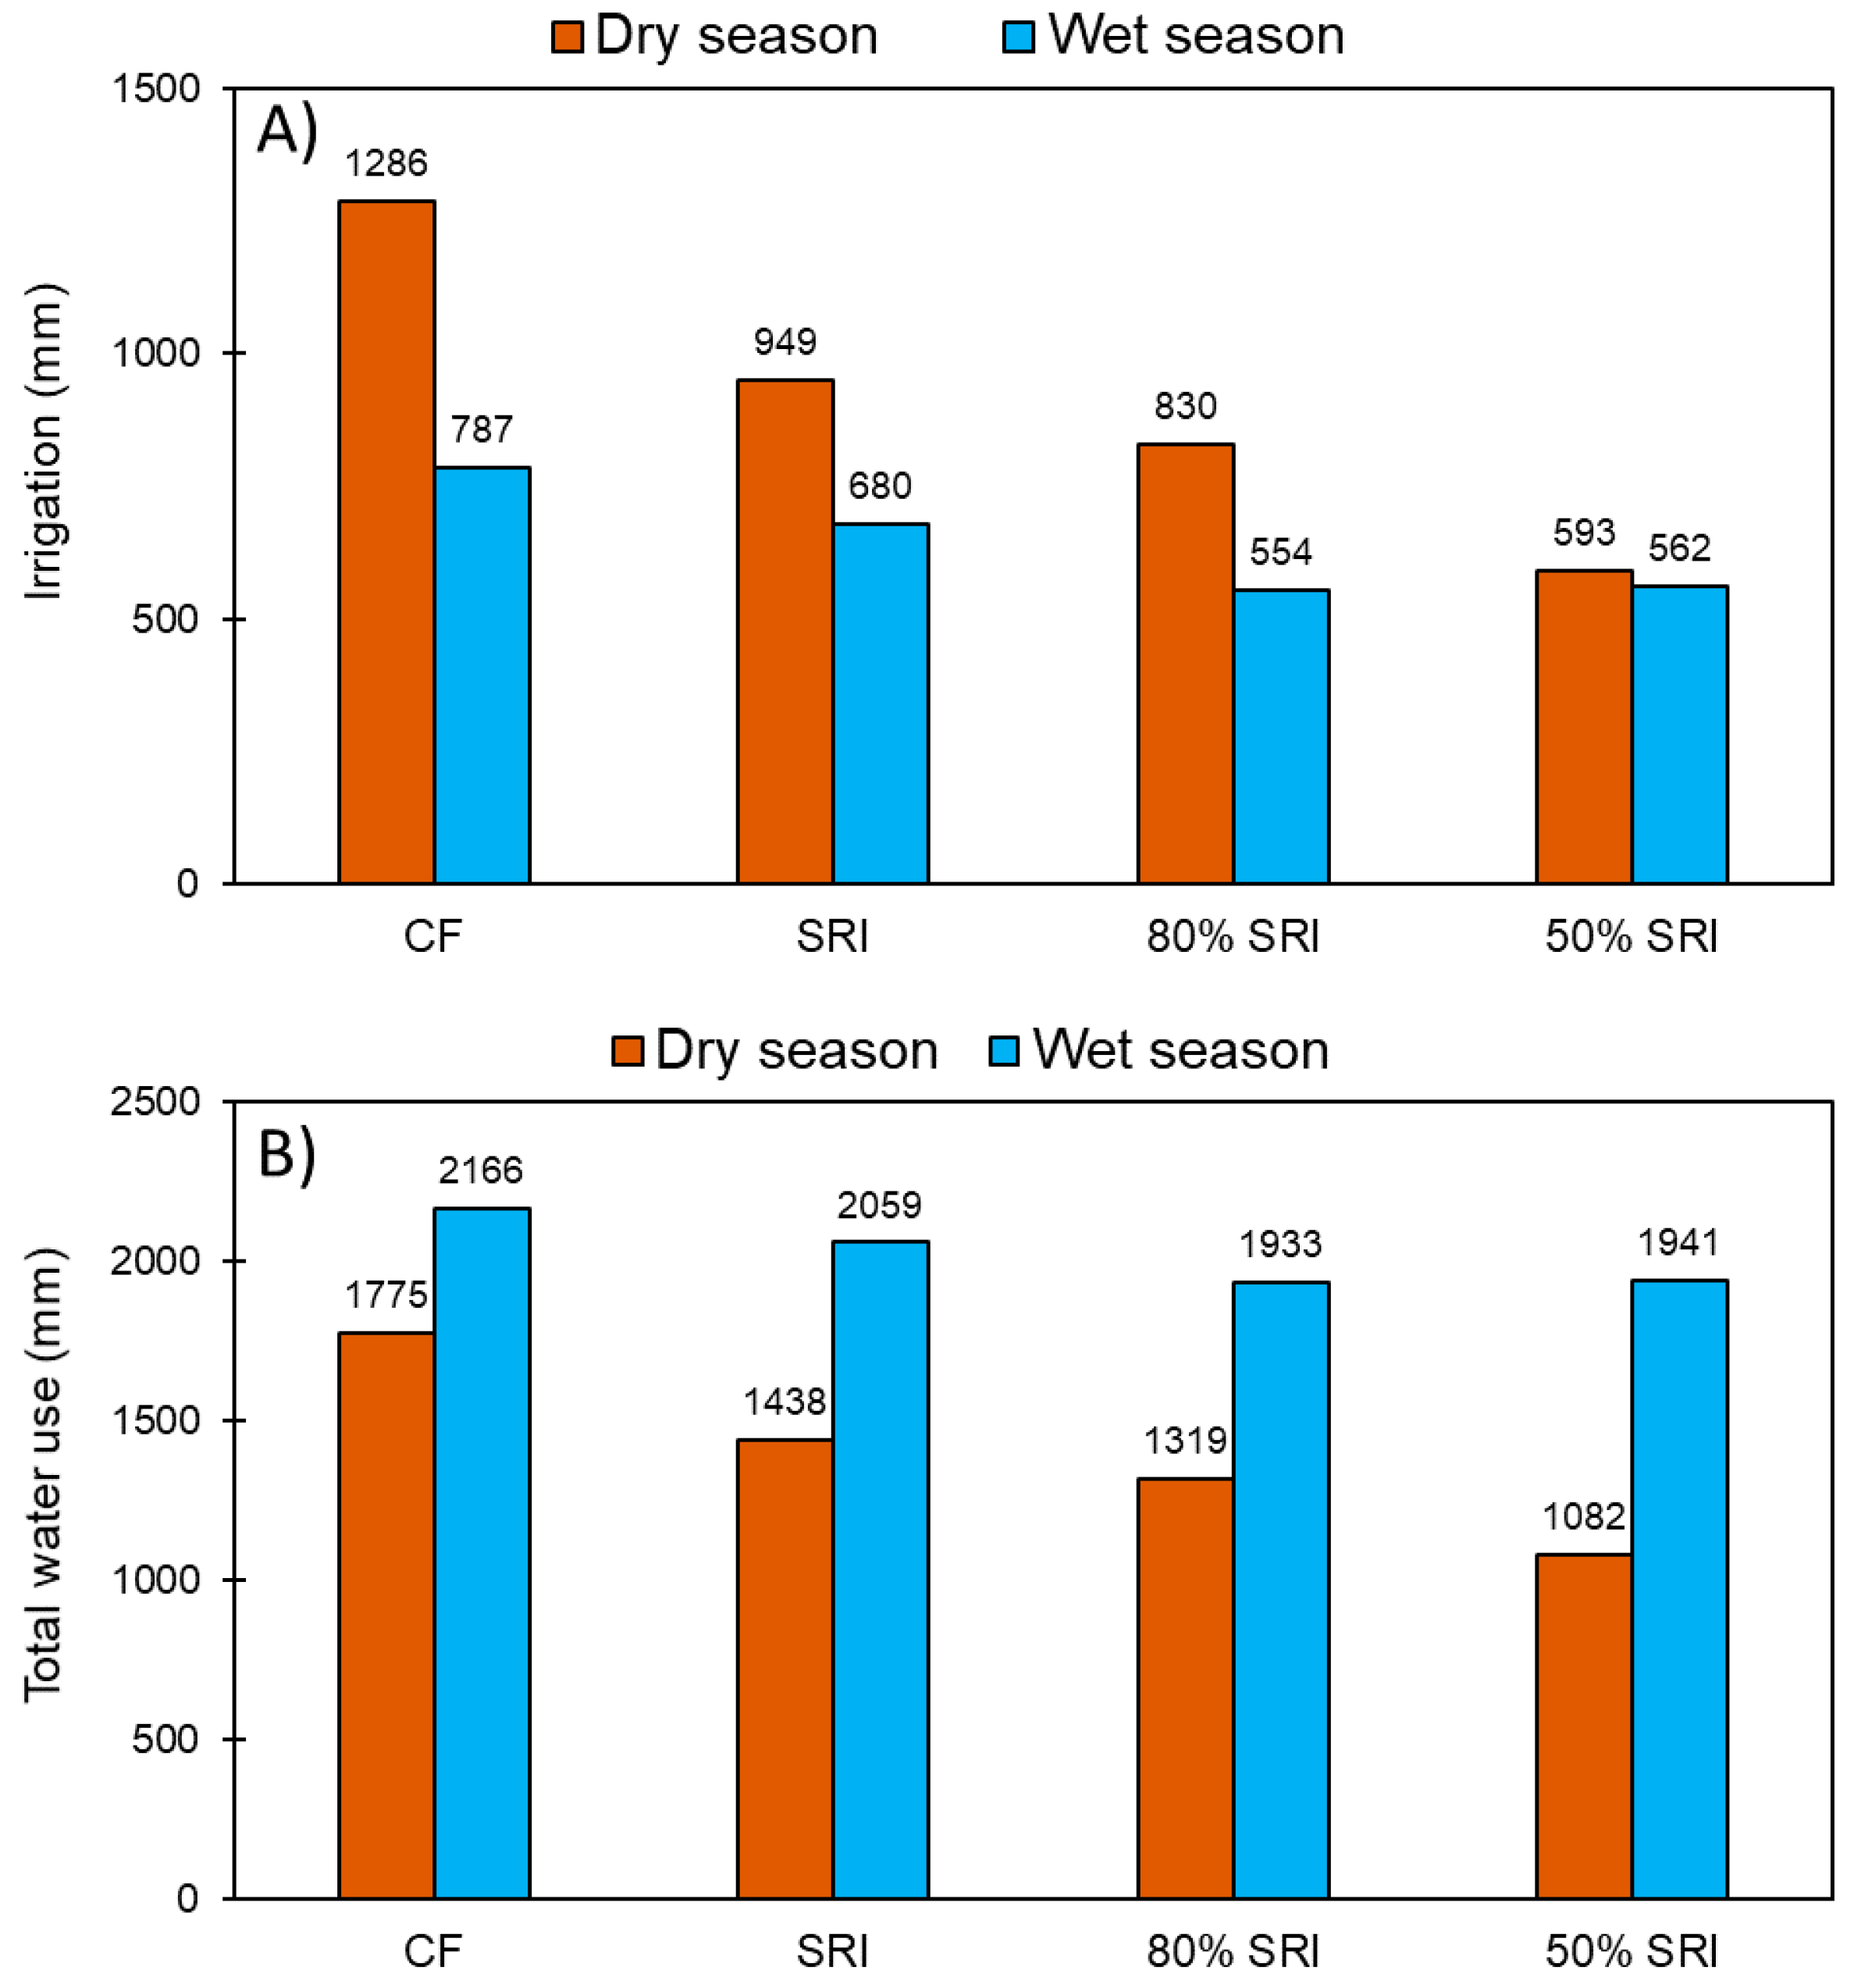
There was a large difference in the amount of water applied between the two seasons. In the dry season, total rainfall was 489 mm and irrigation volumes applied to the 80% SRI and CF treatments were 830 mm and 1286 mm, respectively (Figure 7A). On the other hand, during the wet season, there was a total of 1379 mm rainfall and the irrigation volume applied to the 80% SRI and CF were 554 mm and 787 mm, respectively (Figure 7). Frequent rainfall and variability in deep percolation losses resulted in similar water application for the 80% SRI and 50% SRI treatments (Figure 7). The irrigation volume varied depending on the rainfall, ET and deep percolation losses.
Results show that the 80% SRI can save 35% water compared to the CF during the dry season (Figure 7B). The water savings during the wet season will vary depending on rainfall. Tabbal et al. (2002) also reported that maintaining the soil moisture by alternate wetting and drying reduced irrigation volume by about 40–70%, compared with the traditional CF, without any significant loss in yield. In Ruaha basin of Tanzania, water abstracted from rivers for irrigation accounts for 56% of the wet season river flows and 93% of the dry season river flows [49]. Results from this study indicate that practicing the 80% SRI system for both rice growing seasons can achieve significant water savings which can be used for other purposes and/or help maintain environmental flows.
3.3.2. Economic Productivity of Water
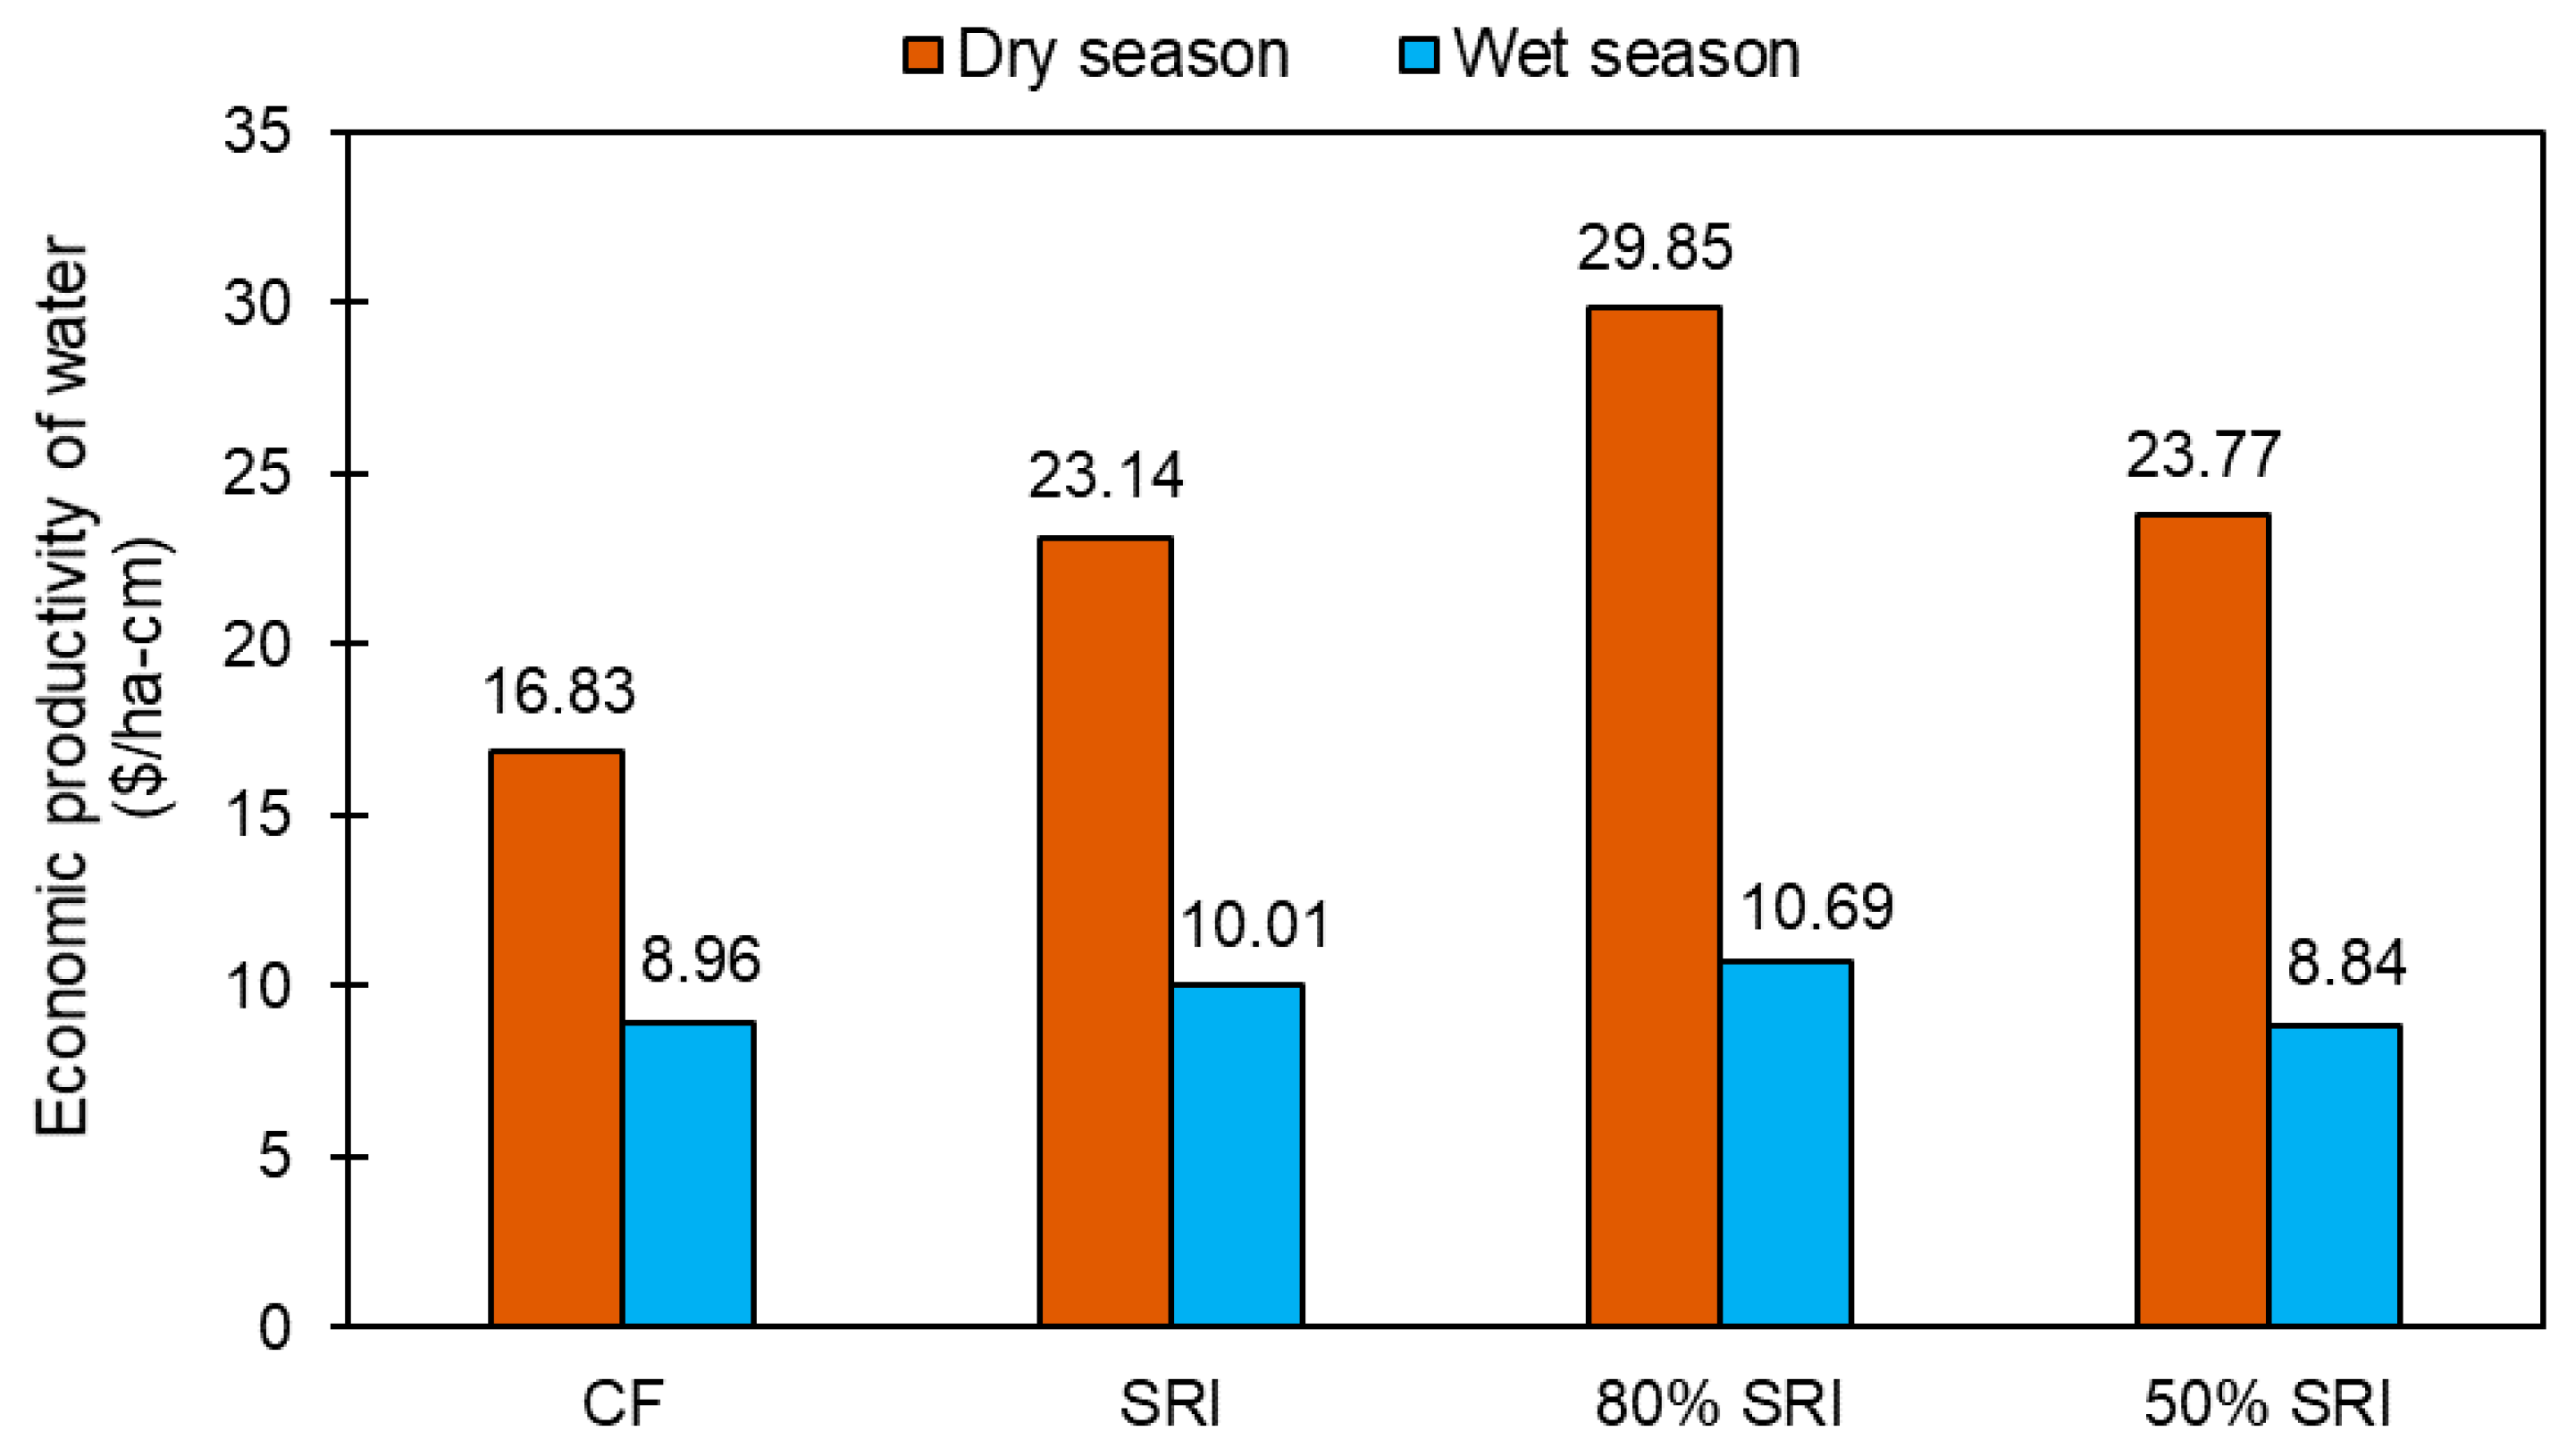
All three SRI treatments had higher economic productivity than the CF production system indicating higher “income per drop of water” under SRI. The 80% SRI had the highest economic productivity during both dry and wet seasons (Figure 8). Dry season economic productivity for the 80% SRI was almost twice that of the CF (Figure 8). The 80% SRI treatment was 29% more productive than the SRI during the dry season (Figure 8). As compared to the dry season, wet season economic productivity showed little differences between the treatments. Despite 14–30% (107–233 mm) of difference in irrigation applied between the CF and SRI treatments, high wet season rainfall (1379 mm) masked the treatment effects on economic productivity (Figure 8). However, the 80% SRI was still 19% more beneficial than the CF during the wet season (Figure 8). Considering the yield advantage from the 80% SRI for both seasons, it is a better irrigation management strategy compared to the SRI and the CF (Figure 8). Although the economic productivity for the 50% SRI was higher than the CF for the dry season, the yield loss from this treatment is not likely to result in its acceptance over the 80% SRI. However, for areas with limited water supply the 50% SRI is still a viable option because yield reductions from the 50% SRI were only 13% compared to the CF over the two seasons.
In 2014, 957,218 ha of paddy area was harvested in Tanzania [8] almost all utilizing the CF production system. The yield advantage and water savings from the 80% SRI are likely to vary depending on rainfall amount and distribution, soil properties, water availability, and management strategies. For example, light textured soils (sandy loam) typically require higher irrigation volume than heavy texture soils (e.g., clay) mainly due to higher soil hydraulic conductivity that results in higher deep percolation losses. Assuming that the results from this study are applicable to the entire rice production area in Tanzania, implementation of the 80% SRI will result in annual water savings of 3.29 billion cubic meters and achieve additional production of 1.5 million tons of rice. If used, this water saved from the CF to the 80% SRI conversion can support 50% increase in the current rice irrigated area in Tanzania. Achieving these water savings and yield benefits is likely to increase the sustainability of rice production system in Tanzania and create additional water supplies for industry, environment, and other users.
4. Conclusions
The traditional continuously flooded (CF) rice production system has no yield advantage over the SRI-AWD production system for both growing seasons in Tanzania. Consistently, highest yields were obtained from the 80% SRI system for both seasons which indicates that it is possible to increase yields while reducing the total irrigation volume. The 80% SRI system outperformed the CF system by 2762 kg/ha and 365 kg/ha with water savings of 456 mm and 233 mm during the dry and wet seasons, respectively. The water savings from the 80% SRI are 30–35% compared to the CF system. Given that 50% SRI system produced almost 90% yield compared to the CF during the wet season, the farmers in limited water supply regions are still likely to achieve a viable yield. For the farms that grow rice in both seasons, the annual water savings from the 80% SRI will be 689 mm with an additional production of 3127 kg/ha over the CF system. Considering that water savings from the 80% SRI accounts for 74% of annual rainfall (935 mm/year) in southern Tanzania, this irrigation management system has important implications for maintaining water supply and environmental flows in rivers.
To achieve large-scale yield and water saving benefits, there is a need to develop easy-to-understand water management recommendations for farmers in Tanzania. Maintaining 30 mm ponding depth (80% SRI) for three days followed by no irrigation for five days during transplanting to panicle initiation is an easy-to-follow recommendation. After panicle initiation, 20 mm ponding depth can be maintained to achieve increased yield with reduced irrigation. Farmers in the major river basins such as Ruaha are already experiencing water cuts which are likely to become more frequent or permanent in the future considering low reservoir levels for hydropower generation (e.g., Mtera and Kidatu power generation plants) [50]. Basin-scale implementation of the 80% SRI will not only help farmers sustain or improve the yields under current and future water cuts but also help maintain current power generation. One of the avenues for promoting large-scale implementation of the SRI system is to conduct on-farm demonstration studies. Furthermore, socio-economic factors including market prices, soil type, water availability, and existing irrigation infrastructure will have to be considered for wide-scale acceptance of the 80% SRI in Tanzania. Given the large-scale production of rice in Tanzania and projected water stress by 2025 [12], the 80% SRI has the potential to improve the well-being of farmers and contribute to food security in Tanzania.
Author Contributions
S.T.M., S.S., A.T., and S.D.T. conceived and designed the study, S.T.M. collected the data under the supervision of S.S., A.T. and S.D.T., S.T.M., S.S., and R.P.S. conducted the data analysis and wrote the manuscript.
Funding
This research was funded by the USAID, Feed the Future (iAGRI project) and Institute of Food and Agricultural Sciences, University of Florida.
Acknowledgments
The authors gratefully acknowledge D. N. Kimaro, Minde, and D. Kryabill for their helpful suggestions to improve this manuscript. We also thank Macha for data collection, Epignosis and Naza for their encouragement.
Conflicts of Interest
The authors declare no conflict of interest.
References
- Rijsberman, F.R. Water scarcity: Fact or fiction? Agric. Water Manag. 2006, 80, 5–22. [Google Scholar] [CrossRef] [Green Version]
- Hanjra, M.A.; Qureshi, M.E. Global water crisis and future food security in an era of climate change. Food Policy 2010, 35, 365–377. [Google Scholar] [CrossRef]
- AQUASTAT. Water Resources Development and Management Service; Food and Agriculture Organization of the United Nations: Rome, Italy, 2010; Available online: http://www.fao.org/nr/water/aquastat/main/index.stm (accessed on 30 June 2016).
- Siebert, S.; Burke, J.; Faures, J.M.; Frenken, K.; Hoogeveen, J.; Döll, P.; Portmann, F.T. Groundwater use for irrigation—A global inventory. Hydrol. Earth Syst. Sci. 2010, 14, 1863–1880. [Google Scholar] [CrossRef] [Green Version]
- Nguyen, N.V. (Ed.) Global Climate Changes and Rice Food Security; FAO: Rome, Italy, 2002; pp. 24–30. [Google Scholar]
- Geerts, S.; Raes, D. Deficit irrigation as an on-farm strategy to maximize crop water productivity in dry areas. Agric. Water Manag. 2009, 96, 1275–1284. [Google Scholar] [CrossRef] [Green Version]
- Balasubramanian, V.; Sie, M.; Hijmans, R.J.; Otsuka, K. Increasing rice production in sub-Saharan Africa: Challenges and opportunities. Adv. Agron. 2007, 94, 55–133. [Google Scholar]
- FAOSTAT. Statistical Databases; Food and Agriculture Organization of the United Nations: Rome, Italy, 2014. [Google Scholar]
- Africa Rice Center. Africa Rice Trends: Overview of Recent Developments in the Sub-Saharan Africa Rice Sector; Africa Rice Center: Cotonou, Benin, 2007. [Google Scholar]
- Nasrin, S.; Lodin, J.B.; Jirström, M.; Holmquist, B.; Djurfeldt, A.A.; Djurfeldt, G. Drivers of rice production: Evidence from five Sub-Saharan African countries. Agric. Food Secur. 2015, 4, 12. [Google Scholar] [CrossRef]
- United Republic of Tanzania (URT). State of the Environment Report—2006; Division of Environment, Vice President’s Office: Dar es Salaam, Tanzania, 2006; ISBN 9987-8990. [Google Scholar]
- World Bank. United Republic of Tanzania, Water Resources Assistance Stretagy, Improving Water Security for Sutaining Livelihoods and Growth; Report No. 35327-TZ; Water and Urban Unit 1, Africa Region; World Bank: Washington, DC, USA, 2006; Available online: http://documents.worldbank.org/curated/en/378981468117562281/Tanzania-Water-resources-assistance-strategy-improving-water-security-for-sustaining-livelihoods-and-growth (accessesd on 6 July 2017).
- Bouman, B.A.M.; Tuong, T.P. Field water management to save water and increase its productivity in irrigated rice. Agric. Water Manag. 2001, 49, 11–30. [Google Scholar] [CrossRef]
- Guerra, L.C. Producing More Rice with Less Water from Irrigated Systems; International Water Management Institute (IWMI): Colombo, Sri Lanka, 1998; Volume 5. [Google Scholar]
- Tuong, T.P.; Bouman, B.A.M. Rice production in water-scarce environments. Water Prod. Agric. Limits Oppor. Improv. 2003, 1, 13–42. [Google Scholar]
- Bouman, B.A.M.; Peng, S.; Castaneda, A.R.; Visperas, R.M. Yield and water use of irrigated tropical aerobic rice systems. Agric. Water Manag. 2005, 74, 87–105. [Google Scholar] [CrossRef]
- Nie, L.; Peng, S.; Chen, M.; Shah, F.; Huang, J.; Cui, K.; Xiang, J. Aerobic rice for water-saving agriculture. A review. Agron. Sustain. Dev. 2012, 32, 411–418. [Google Scholar] [CrossRef]
- Tabbal, D.F.; Bouman, B.A.M.; Bhuiyan, S.I.; Sibayan, E.B.; Sattar, M.A. On-farm strategies for reducing water input in irrigated rice; case studies in the Philippines. Agric. Water Manag. 2002, 56, 93–112. [Google Scholar] [CrossRef]
- Zhang, H.; Xue, Y.; Wang, Z.; Yang, J.; Zhang, J. An Alternate Wetting and Moderate Soil Drying Regime Improves Root and Shoot Growth in Rice. Crop Sci. 2009, 49, 2246–2260. [Google Scholar] [CrossRef]
- Lampayan, R.M.; Rejesus, R.M.; Singleton, G.R.; Bouman, B.A. Adoption and economics of alternate wetting and drying water management for irrigated lowland rice. Field Crops Res. 2015, 170, 95–108. [Google Scholar] [CrossRef]
- Bouman, B.A.M.; Feng, L.; Tuong, T.P.; Lu, G.; Wang, H.; Feng, Y. Exploring options to grow rice using less water in northern China using a modelling approach: II. Quantifying yield, water balance components, and water productivity. Agric. Water Manag. 2007, 88, 23–33. [Google Scholar] [CrossRef]
- Stoop, W.A.; Uphoff, N.; Kassam, A. A review of agricultural research issues raised by the system of rice intensification (SRI) from Madagascar: Opportunities for improving farming systems for resource-poor farmers. Agric. Syst. 2002, 71, 249–274. [Google Scholar] [CrossRef]
- Kassam, A.; Stoop, W.; Uphoff, N. Review of SRI modifications in rice crop and water management and research issues for making further improvements in agricultural and water productivity. Paddy Water Environ. 2011, 9, 163–180. [Google Scholar] [CrossRef]
- Mati, B.M.; Wanjogu, R.; Odongo, B.; Home, P.G. Introduction of the system of rice intensification in Kenya: Experiences from mwea irrigation scheme. Paddy Water Environ. 2011, 9, 145–154. [Google Scholar] [CrossRef]
- Thakur, A.K.; Uphoff, N.T.; Stoop, W.A. Scientific underpinnings of the system of rice intensification (SRI): What is known so far? In Advances in Agronomy; Academic Press: Cambridge, MA, USA, 2016; Volume 135, pp. 147–179. [Google Scholar]
- Uphoff, N. Agroecological implications of the system of rice intensification (SRI) in Madagascar. Environ. Dev. Sustain. 1999, 1, 297–313. [Google Scholar] [CrossRef]
- Zhao, L.; Wu, L.; Li, Y.; Lu, X.; Zhu, D.; Uphoff, N. Influence of the system of rice intensification on rice yield and nitrogen and water use efficiency with different N application rates. Exp. Agric. 2009, 45, 275–286. [Google Scholar] [CrossRef]
- Allen, R.G.; Pereira, L.S.; Raes, D.; Smith, M. Crop Evapotranspiration-Guidelines for Computing Crop Water Requirements—FAO Irrigation and Drainage Paper 56; FAO: Rome, Italy, 1998; Volume 300, D05109. [Google Scholar]
- Schaap, M.G.; Leij, F.J.; Van Genuchten, M.T. Rosetta: A computer program for estimating soil hydraulic parameters with hierarchical pedotransfer functions. J. Hydrol. 2001, 251, 163–176. [Google Scholar] [CrossRef]
- Cobos, D.R.; Chambers, C. Calibrating ECH2O Soil Moisture Sensors; Application Note; Decagon Devices: Pullman, WA, USA, 2010. [Google Scholar]
- Leib, B.G.; Jabro, J.D.; Matthews, G.R. Field evaluation and performance comparison of soil moisture sensors. Soil Sci. 2003, 168, 396–408. [Google Scholar] [CrossRef]
- Dukes, M.D.; Simonne, E.H.; Davis, W.E.; Studstill, D.W.; Hochmuth, R. Effect of sensor-based high frequency irrigation on bell pepper yield and water use. In Proceedings of the 2nd International Conference on Irrigation and Drainage, Phoenix, AZ, USA, 12–15 May 2003; pp. 12–15. [Google Scholar]
- Zotarelli, L.; Dukes, M.D.; Scholberg, J.M.S.; Femminella, K.; Munoz-Carpena, R. Irrigation scheduling for green bell peppers using capacitance soil moisture sensors. J. Irrig. Drain. Eng. 2010, 137, 73–81. [Google Scholar] [CrossRef]
- Yin, X.; Schapendonk, A.H.; Kropff, M.J.; van Oijen, M.; Bindraban, P.S. A generic equation for nitrogen-limited leaf area index and its application in crop growth models for predicting leaf senescence. Ann. Bot. 2000, 85, 579–585. [Google Scholar] [CrossRef]
- SAS Institute. SAS/IML 9.3 User’s Guide; SAS Institute: Cary, NC, USA, 2011. [Google Scholar]
- Somerville, P.N. On the conservatism of the Tukey-Kramer multiple comparison procedure. Stat. Probab. Lett. 1993, 16, 343–345. [Google Scholar] [CrossRef]
- Gleick, P.H.; Christian-Smith, J.; Cooley, H. Water-use efficiency and productivity: Rethinking the basin approach. Water Int. 2011, 36, 784–798. [Google Scholar] [CrossRef]
- Wilson, R.T.; Lewis, I. The Rice Value Chain in Tanzania, a Report from the Southern Highlands Food Systems Programme; Food and Agriculture Organization of the United Nations: Rome, Italy, 2015; pp. 1–15. [Google Scholar]
- Chaudhary, D.K. Effect of water regimes and NPK levels on mid duration rice. (Oryza sativa L). Master’s Thesis, Rajendra Agricultural University, Pusa, Bihar, 2003. [Google Scholar]
- Parihar, S.S. Effect of crop-establishment method, tillage, irrigation and nitrogen on production potential of rice (Oryza sativa)-wheat (Triticum aestivum) cropping system. Indian J. Agron. 2004, 49, 1–5. [Google Scholar]
- Panda, S.C.; Rath, B.S.; Tripathy, R.K.; Dash, B. Effect of water management practices on yield and nutrient uptake in the dry season rice. Oryza 1997, 34, 51–53. [Google Scholar]
- Gani, A.; Rahman, A.; Rustam, D.; Hengsdijk, H. Water management experiments in Indonesia. In Proceedings of the International Symposium on Water Wise Rice Production, IARI, New Delhi, India, 2–3 November 2003; pp. 29–37. [Google Scholar]
- Thakur, A.K.; Rath, S.; Patil, D.U.; Kumar, A. Effects on rice plant morphology and physiology of water and associated management practices of the system of rice intensification and their implications for crop performance. Paddy Water Environ. 2011, 9, 13–24. [Google Scholar] [CrossRef]
- Uphoff, N. Higher yields with fewer external inputs? The system of rice intensification and potential contributions to agricultural sustainability. Int. J. Agric. Sustain. 2003, 1, 38–50. [Google Scholar] [CrossRef]
- Takai, T.; Matsuura, S.; Nishio, T.; Ohsumi, A.; Shiraiwa, T.; Horie, T. Rice yield potential is closely related to crop growth rate during late reproductive period. Field Crops Res. 2006, 96, 328–335. [Google Scholar] [CrossRef]
- Vijayakumar, M.; Ramesh, S.; Chandrasekaran, B.; Thiyagarajan, T.M. Effect of system of rice intensification (SRI) practices on yield attributes yield and water productivity of rice (Oryza sativa L.). Res. J. Agric. Biol. Sci. 2006, 2, 236–242. [Google Scholar]
- Krishna, A.; Biradarpatil, N.K.; Channappagoudar, B.B. Influence of system of rice intensification (SRI) cultivation on seed yield and quality. Agric. Sci. 2008, 21, 369–372. [Google Scholar]
- Kombe, E. The System of Rice Intensification (SRI) as a Strategy for Adapting to the Effects of Climate Change and Variability: A Case Study of Mkindo Irrigation Scheme in Morogoro, Tanzania. Unpublished Master’s Thesis, Department of Agricultural Engineering and Land Planning, Sokoine University of Agriculture, Morogoro, Tanzania, 2012. [Google Scholar]
- Mwakalila, S. Water resource use in the Great Ruaha Basin of Tanzania. Phys. Chem. Earth Parts A/B/C 2005, 30, 903–912. [Google Scholar] [CrossRef]
- Makoye, K. Farmers to Lose Water Access as Tanzania’s Hydropower Runs Dry; Reuters: London, UK, 2015; Available online: http://www.reuters.com/article/tanzania-water-hydropower/farmers-to-lose-water-access-as-tanzanias-hydropower-runs-dry-idUSL8N0ZC0X320150626 (accessed on 19 June 2018).
Figure 1.
Average daily rainfall and reference ET (1971–2000) for Morogoro, Tanzania.

Figure 2.
(A) Dry season (October 2012 to January 2013) and (B) wet season (February 2013 to June 2013) total biomass for continuous flooding (CF), system of rice intensification (SRI), 80% SRI, and 50% SRI treatments. The 80% SRI and 50% SRI refers to 80% and 50% of the SRI ponding depth, respectively. 0 to 46, 47 to 60, 61 to 75, and 77 to 94 days after transplanting (DAT) corresponds to vegetative, flowering, panicle initiation, and senescence stages, respectively.

Figure 3.
(A) Dry season (October 2012 to January 2013) and (B) wet season (February 2013 to June 2013) leaf area index (LAI) for continuous flooding (CF), system of rice intensification (SRI), the 80% SRI, and 50% SRI treatments. The 80% SRI and 50% SRI refers to 80% and 50% of the SRI ponding depth, respectively. Days after transplanting (DAT) 0 to 46, 47 to 60, 61 to 75, and 77 to 90 corresponds to vegetative, panicle initiation, flowering, and senescence stages, respectively.

Figure 4.
Dry and wet seasons rice crop yields for continuous flooding (CF), system of rice intensification (SRI), 80% SRI, and 50% SRI. 80% SRI and 50% SRI refers to 80% and 50% of the SRI ponding depth, respectively.
Figure 4.
Dry and wet seasons rice crop yields for continuous flooding (CF), system of rice intensification (SRI), 80% SRI, and 50% SRI. 80% SRI and 50% SRI refers to 80% and 50% of the SRI ponding depth, respectively.

Figure 5.
Daily soil moisture at 30 cm depth during the (A) dry season (October 2012 to January 2013) and (B) wet season (February 2013 to June 2013). CF is continuous flooding, SRI is system of rice intensification, 80% SRI and 50% SRI refers to 80% and 50% of the SRI ponding depth, respectively DAT is days after transplanting.

Figure 6.
(A) Dry season (October 2012 to January 2013) and (B) wet season (February 2013 to June 2013) daily average soil moisture below the root zone (60 cm) against days after transplanting (DAT). The CF is continuous flooding, SRI is system of rice intensification, and 80% SRI and 50% SRI refers to 80% and 50% of the SRI ponding depth, respectively.

Figure 7.
(A) Irrigation applied and (B) total water (irrigation + rainfall) input for continuous flood (CF), system of rice intensification (SRI), 80% SRI and 50% SRI treatments during the dry and wet seasons. 80% SRI and 50% SRI refers to 80% and 50% of the SRI ponding depth, respectively.
Figure 7.
(A) Irrigation applied and (B) total water (irrigation + rainfall) input for continuous flood (CF), system of rice intensification (SRI), 80% SRI and 50% SRI treatments during the dry and wet seasons. 80% SRI and 50% SRI refers to 80% and 50% of the SRI ponding depth, respectively.

Figure 8.
Economic productivity of water (US$/ha-cm) under different water management options during the dry and wet seasons. The CF is continuous flooding and SRI is system of rice intensification. 80% SRI and 50% SRI refers to 80% and 50% of the SRI ponding depth, respectively.
Figure 8.
Economic productivity of water (US$/ha-cm) under different water management options during the dry and wet seasons. The CF is continuous flooding and SRI is system of rice intensification. 80% SRI and 50% SRI refers to 80% and 50% of the SRI ponding depth, respectively.


Table 1.
Crop management and development stages for dry and wet seasons.
| Event | Period (DAT *) | Dry Season | Wet Season |
|---|---|---|---|
| Field Preparations | - | 15 September 2012 | 8 February 2013 |
| Nursery | - | 24 September 2012 | 18 February 2013 |
| Transplanting | - | 6 October 2012 | 1 March 2013 |
| Tillering | 0–46 | 21 November 2012 | 16 April 2013 |
| Panicle initiation | 47–59 | 3 December 2012 | 29 April 2013 |
| Flowering | 60–72 | 15 December 2012 | 13 May 2013 |
| Grain filling | 73–90 | 1 January 2013 | 27 May 2013 |
| Harvesting | 111 (Wet season) 113 (Dry season) | 26 January 2013 | 19 June 2013 |
*: DAT-days after transplanting.
Table 2.
Plant height and number of tillers for the dry and wet seasons.
| Treatments * | Plant Height (m) | Number of Tillers | ||
|---|---|---|---|---|
| Dry Season | Wet Season | Dry Season | Wet Season | |
| CF | 0.49 a | 0.52 a | 40 a | 28 a |
| SRI | 0.44 a | 0.48 a | 42 a | 31 a |
| 80% SRI | 0.40 b | 0.47 b | 56b | 38 b |
| 50% SRI | 0.30 c | 0.40 c | 29 c | 25 c |
* CF—Continuously flooded, SRI—System of Rice Intensification, 80% SRI—80% of SRI ponding depth, and 50% SRI—50% of SRI ponding depth. Note: Treatments with different letters (superscripts) were significantly different at 0.05 significance level.
© 2018 by the authors. Licensee MDPI, Basel, Switzerland. This article is an open access article distributed under the terms and conditions of the Creative Commons Attribution (CC BY) license (http://creativecommons.org/licenses/by/4.0/).
Share and Cite
MDPI and ACS Style
Materu, S.T.; Shukla, S.; Sishodia, R.P.; Tarimo, A.; Tumbo, S.D. Water Use and Rice Productivity for Irrigation Management Alternatives in Tanzania. Water 2018, 10, 1018. https://doi.org/10.3390/w10081018
AMA Style
Materu ST, Shukla S, Sishodia RP, Tarimo A, Tumbo SD. Water Use and Rice Productivity for Irrigation Management Alternatives in Tanzania. Water. 2018; 10(8):1018. https://doi.org/10.3390/w10081018
Chicago/Turabian StyleMateru, Stanslaus Terengia, Sanjay Shukla, Rajendra P. Sishodia, Andrew Tarimo, and Siza D. Tumbo. 2018. "Water Use and Rice Productivity for Irrigation Management Alternatives in Tanzania" Water 10, no. 8: 1018. https://doi.org/10.3390/w10081018
Note that from the first issue of 2016, this journal uses article numbers instead of page numbers. See further details here.