Legionella Detection in Environmental Samples as an Example for Successful Implementation of qPCR
by

Daniela Toplitsch
, 
Sabine Platzer
,
Bettina Pfeifer
,
Jürgen Hautz
,
Franz Mascher
and
Clemens Kittinger
* Institute of Hygiene, Microbiology and Environmental Medicine, Medical University of Graz, 8010 Graz, Austria
*
Author to whom correspondence should be addressed.
Water 2018, 10(8), 1012; https://doi.org/10.3390/w10081012
Submission received: 21 June 2018
/
Revised: 27 July 2018
/
Accepted: 27 July 2018
/
Published: 31 July 2018
(This article belongs to the Section Water Quality and Contamination)
Abstract
:Waterborne diseases are a serious threat because of their ability to infect a high number of individuals in a short time span, such as during outbreaks of Legionellosis. This significantly highlights the need for the rapid detection and quantification of bacteria in environmental water samples. The aim of this study was to investigate the feasibility of quantitative Polymerase Chain Reaction (qPCR) for the detection of Legionella pneumophila (L. pneumophila) in environmental water samples and comparison of standard culture methods for Legionella detection with qPCR. Our study reached a negative predictive value (NPV) for L. pneumophila of 80.7% and for L. pneumophila serogroup 1 (sg1) the calculated NPV was 87.0%. The positive predictive value (PPV) for L. pneumophila was 53.9% and for L. pneumophila sg1 PPV was 21.4%. Results showed a correlation between qPCR and culture with an R2 value of 0.8973 for L. pneumophila, whereas no correlation was observed for the detection of L. pneumophila sg1. In our study, qPCR proved useful for the identification of L. pneumophila negative samples. However, despite the obvious benefits (sample handling, rapid generation of results), qPCR needs to be improved regarding the PPV before it can replace culture in water quality assessment.
1. Introduction
The genus Legionella spp. comprises more than 42 different strains, the best-known being Legionella pneumophila (L. pneumophila), due to its ability to cause disease. L. pneumophila can further be grouped into 16 different serogroups; however, L. pneumophila serogroup 1 (L. pneumophila sg1) is the causative agent in most cases in Europe (70% of all infections) [1]. After the inhalation of aerosols containing the respiratory pathogen L. pneumophila, vulnerable populations, such as immune-compromised patients or the elderly, can develop Legionnaires’ disease, a severe form of pneumonia with a high mortality rate, or the less severe disease form Pontiac Fever, which exhibits flu-like symptoms [1,2]. As of yet, human to human transmission of L. pneumophila has not been observed [3].
Legionella pollution for example results from growth in synthetic piped water distribution systems, as generally only low concentrations of Legionella spp. can be found in natural aquatic environments in Europe [2]. Most outbreaks of L. pneumophila infections can therefore be attributed to the human alteration of the environment since Legionella thrive in moist man-made environments [2,4]. Therefore, to avoid proliferation of Legionella in hot water systems they must be heated on to a minimum of 55 to 60 °C according to the Austrian Standards B 5019. Nevertheless, outbreaks are still possible and can be found in literature [5]. Water systems that produce aerosols are especially under inspection for Legionella contamination, e.g., cooling towers, hot- and cold-water systems or spa pools, which provide comfortable temperatures for bacterial growth ranging from 20 to 45 °C due to their heat-exchanging function and thus serve as ‘bacterial amplifiers’ [1,2,6]. In 2016, 161 cases of Legionellosis were registered in Austria, seven of those had a fatal outcome. 108 of these cases were acquired outside the hospital setting, and 17 of those cases could be tracked back to drinking water distribution systems and a spa pool [5]. Unfortunately, Legionella contamination cannot be fully eradicated from the before mentioned water sources using heat disinfection or chlorination methods, as the strains prove to be resistant and colonize the system again after a lag period [2,6,7]. Environmental Legionella strains found in a multispecies biofilm happen to be extremely resilient against biocides (mostly chlorine derivatives), often used in cooling towers to control microbial growth, and exposure to biocides triggers the switch of Legionella to the viable-but-not-culturable (VBNC) state. Intracellular Legionella hiding in amoebae hosts are also not strongly affected by chlorination treatment in comparison with planktonic Legionella cells [7]. These features make constant monitoring of possible contaminations in risk sources and epidemiological investigations following outbreaks in a timely manner a necessity for the public safety and health [2]. Recently, studies have shown success in eradication of Legionella from hospital water networks by using new methods: Totaro et al. propose the installation of time-flow taps in proximity to dead-legs in the pipe system for efficient flushing of the system, whereas others propose the use of monochloramine instead of the widely used chlorine dioxide or the use of hydrogen peroxide as a biocide against Legionella colonization in hospital water networks [8,9,10]. In Austria drinking water is not chlorinated, but often treated with UV according to ÖNORM M 5873. For sanitation of cooling towers and cooling waters a mixture of biocides is applied according to Austrian Standards B 5019.
Isolation of Legionella spp. from environmental samples first happens with the selection for l-cysteine auxotrophy, such as with the use of buffered charcoal yeast extract (BCYE) agar. Water samples sometimes also need centrifugation or filtration steps for concentration, and samples with a high background microbial flora need an acid or heat treatment before proceeding, as Legionella is thermotolerant up to 60 °C [3]. Plates are incubated at 36 °C for up to 14 days, with examination of the plates every two days. Laboratories experienced in the handling of Legionella samples are more likely to recover the organism, as there are significant problems with the cultivation methods: the more rapid generation times of other microbes present in the sample might obscure slow-growing Legionella on plates and the presence of Legionella in the VBNC state also is a problem [3,4].
In the case of Legionella outbreaks, quantitative Polymerase Chain Reaction (qPCR) has drastic benefits for the public health: samples can be tested with a high reproducibility, high sample throughput and a high specificity in a short time span, which allows to give out public health warnings faster [2]. qPCR is based on the simultaneous amplification of a nucleic acid target sequence, which can be calculated back to reach the amount of genomic units (GU) per liter. As of yet, a direct comparison with the amount of colony forming units (CFU) and GU has not been established [3].
The aim of this study was to investigate a qPCR method that is used in laboratories as a standard method as described in ISO 12869:2012 for the detection of L. pneumophila in environmental water samples and to compare the results obtained with those from the gold standard culture methods.
2. Materials and Methods
2.1. Water Samples
From April to December 2017, routine water samples (n = 83) screened for Legionella contamination were collected from the water laboratory at the Institute for Hygiene, Microbiology and Environmental Medicine at the Medical University of Graz. The samples were of different origin, with samples coming from drinking water (n = 20), cooling towers (n = 21), cooling water (n = 31) as well as other water samples (n = 11) and all were analyzed for possible Legionella contamination by culture as well as by qPCR.
2.2. Sample Preparation
Samples were collected in at least one sterile 250 mL plastic bottle (VWR International, Vienna, Austria) and 100–150 mL aliquots were used for quantification by culture and 100–250 mL aliquots, depending on the amount of sample sent to the water laboratory, were used for quantification by qPCR. Chlorinated water samples were routinely taken in bottles with thiosulfate to neutralize chloride (VWR International, Vienna, Austria). Samples were either analyzed immediately after arrival in the laboratory or within 24 h after arrival with storage at 4 °C until analysis.
For DNA extraction, aliquots were filtered through a 45 mm polycarbonate membrane with a 0.2 µm pore size (Isopore™ Membrane Filters, Merck Millipore Ltd., Darmstadt, Germany). Filters were stored until DNA extraction at −80 °C. DNA extraction was performed using the QIAGEN PowerWater Kit (QIAGEN GmbH, Hilden, Germany) according to the manufacturer’s protocol. The quantity and purity of the DNA extracts were measured by the NanoDrop2000 instrument (Thermo Fischer Scientific Inc., Waltham, MA, USA). To check for DNA extraction efficiency, DNA recovery of the QIAGEN PowerWater Kit (QIAGEN GmbH, Hilden, Germany) was determined by spiking 100 mL of double distilled water with a LENTICULE DISC (Culture Collections, Public Health England, Salisbury, UK) containing a defined number of 104 culturable L. pneumophila NCTC 12821 (according to the manufacturer’s data sheet) and following the below mentioned protocol for qPCR.
2.3. Quantification by Culture
The quantification of L. pneumophila sg 2–15 and sg1 by culture was performed according to ISO 11731:2004 in the water laboratory at the Institute for Hygiene, Microbiology and Environmental Medicine at the Medical University of Graz. Depending on the sample type, different culture methods were used: For samples with an expected low concentration of Legionella species and low concentration of other microorganisms, 100 mL of the sample were filtered, the filters were treated with acid solution according to ISO 11731:2004 and the filters were placed on BCYE agar (VWR International, Vienna, Austria). For samples with an expected low concentration of Legionella species and a high number of other microorganisms, the sample was filtered through a 47 mm mixed cellulose esters filter with a 0.45 µm pore size (EZ-Pak® Membrane Filters, Millipore, France). To obtain enumerable results, the filters were then treated with acid solution and placed on BCYE+AB agar (VWR International, Vienna, Austria). If the filters showed uncountable colony numbers (for both methods) serial dilutions by factor 10 (0.1, 0.01, 0.001) were made to receive enumerable results. Therefore it leads to a limit of detection (LOD) of 1/100 mL, or if the filters showed uncountable colony numbers and dilutions were made, the LOD was higher (for 0.1 dilution, the LOD is 10/100 mL and so forth). Plates were then incubated at 36 °C for 7 to 10 days under CO2 pressure (GENbox CO2, bioMérieux, Vienna, Austria) and colonies were counted at the end of the incubation period. Colonies were confirmed to be Legionella spp. by plating on Columbia blood agar plates (bioMérieux, Vienna, Austria) and BCYE+AB agar plates (VWR International, Vienna, Austria), colonies were Legionella spp. if no growth occurred on Columbia blood agar plates and growth occurred on BCYE+AB agar plates. We further performed serotyping of the obtained Legionella spp.: To test for L. pneumophila sg 1, serogroup 2–15 and non-L. pneumophila species, 3–5 Legionella colonies were then picked at random and analyzed using the LEGIONELLA LATEX TEST (Oxoid Limited, Hampshire, UK) according to the manufacturer’s instructions.
2.4. Quantification by Legionella-Specific qPCR
2.4.1. Polymerase Chain Reaction (PCR) Primers and Probe Sets
Primer and probe sets specific for mip and wzm (all from Eurofins Genomics, Ebersberg, Germany) were selected from current literature and used as previously described by Collins et al., 2015, with modification of fluorescence quenchers (see Table 1) [1]. Before starting qPCR experiments, primers and corresponding probes were tested for their specificity in a standard PCR. Product specificity was determined by agarose gel electrophoresis. For qPCR, primers were used together with TaqMan®-based hybridization probes. All gene targets are a single copy in the Legionella genome.
2.4.2. qPCR Conditions
Quantitative PCR was conducted using a modified duplex assay for L. pneumophila (mip) and L. pneumophila sg1 (wzm) according to Collins et. al., 2015 [1] with the following modifications: For all reactions, the LightCycler® 480 Probes Master (Roche Diagnostics GmbH, Vienna, Austria) was used, the reactions were carried out in a 20 µL reaction mix containing 400 nmol L−1 of each primer and 150 nmol L−1 of each probe. 5 µL of extracted DNA or isolated genomic DNA were taken as template. A positive control of L. pneumophila sg1 DSM 7513 (Leibnitz Institute DSMZ—German Collection of Microorganisms and Cell Cultures, Braunschweig, Germany) genomic DNA dilutions (1:10, 1:100 and 1:1000) (see below) and a non-template control PCR grade water (Promega Corporation, Innsbruck, Austria), were included in all assays. To determine the sensitivity of the qPCR, quantification was performed by comparison with a standard curve of 106 to 100 target gene copies (see below). Quantitative PCR was performed in a LightCycler 480 II System (Roche Austria GmbH, Vienna, Austria). For reproducibility, samples were duplicated on single runs and further randomly selected samples were repeated on a different qPCR run for control. PCR product specificity was determined by agarose gel electrophoresis on 2% agarose gel stained with Midori Green Advance (Biozym Scientific GmbH, Hessisch Oldendorf, Germany) and run at 80 V for one hour. Agarose gels were documented using a FluorChemFC3 gel documentation system (Biozym Scientific GmbH, Hessisch Oldendorf, Germany).
2.4.3. Positive Control
For the positive control, L. pneumophila sg1 DSM 7513 (Leibnitz Institute DSMZ—German Collection of Microorganisms and Cell Cultures, Braunschweig, Germany) genomic DNA was prepared using the DNeasy Blood and Tissue Kit (QIAGEN GmbH, Hilden, Germany) according to the manufacturer’s protocol, using the following modifications: L. pneumophila sg1 DSM 7513 was grown on BCYE agar plates (VWR International, Vienna, Austria) 36 °C for 7 to 10 days under CO2 pressure (GENbox CO2, bioMérieux, Austria) and 2 sterile inoculation loops with 1 µL volume (Greiner Bio-One International GmbH, Kremsmünster, Austria) were mixed into 180 µL buffer ATL, 20 µL proteinase K were added, vortexed, and incubated for 45 min at 56 °C. The quantity and purity of the DNA extracts were measured with the NanoDrop2000 instrument (Thermo Fischer Scientific Inc., Waltham, MA, USA). The extracted genomic DNA was then diluted down to 1:10, 1:100 and 1:1000 in PCR grade water (Promega Corporation, Innsbruck, Austria) for use as a positive control in the qPCR assays.
2.4.4. Standard Curves
To generate standard curves for the qPCR assays, the before mentioned L. pneumophila sg1 DSM 7513 (Leibnitz Institute DSMZ—German Collection of Microorganisms and Cell Cultures, Braunschweig, Germany) genomic DNA was used to perform a PCR: The PCR mix (50 μL) contained 0.1 µL Q5® High-Fidelity DNA Polymerase 2000 U/mL with 5 μL Q5® High-Fidelity 2X Master Mix (all by New England Biolabs® Inc., Frankfurt am Main, Germany) and 2 µL Deoxynucleotide (dNTP) Solution 1× Mix (New England Biolabs® Inc., Frankfurt am Main, Germany), and 38.9 µL PCR grade water (Promega Corporation, Innsbruck, Austria) as well as 1 µL of before mentioned primers (see Table 1). Thermal reaction conditions were 95 °C for 10 min followed by 35 cycles of 95 °C for 45 s, 60 °C for 45 s and 72 °C for 1 min and finally 72 °C for 10 min, all done using a Biometra® T3000 Thermocycler (Biometra GmbH, Göttingen, Germany). To confirm amplification of the correct fragments, PCR products were analyzed by agarose gel electrophoresis on 2% agarose gel stained with Midori Green Advance (Biozym Scientific GmbH, Hessisch Oldendorf, Germany) and run at 80 V for one hour. Agarose gels were photographed using a FluorChemFC3 gel documentation system (Biozym Scientific GmbH, Hessisch Oldendorf, Germany). The PCR product was then purified using the QIAquick PCR Purification Kit (QIAGEN GmbH, Hilden, Germany) according to the manufacturer’s instructions. The quantity and purity of the DNA extracts were measured by the NanoDrop2000 instrument (Thermo Fischer Scientific Inc., Waltham, MA, USA). The purified PCR products were further diluted down to reach 1010 gene copies to 100 gene copies, using the following formula to determine the copy number per µL in the purified PCR product:
where m: DNA concentration in ng/µL; AG: 6 × 10²³ molecules per mole; y: number of base pairs of amplified sequence; Mr: Molecular weight of one base pair in dsDNA (660 g/moL).
Dilutions ranging from 106 to 100 target gene copies were then used to generate standard curves for each qPCR assay.
2.4.5. Amplification Inhibition Tests
To check for possible inhibition of qPCR amplification reaction due to the sample matrix and subsequent false negative results, 100 mL of three selected samples were each spiked with one LENTICULLE DISC containing around 4.12 × 10⁴ CFU L. pneumophila NCTC12821 (Culture Collections, Public Health England, Salisbury, UK) and experimental procedure was performed in the same manner as for the other samples.
2.5. Data Analysis
The LightCycler 480 software (Roche Austria GmbH, Vienna, Austria) automatically calculated threshold baselines, slopes and efficiency by running the corresponding bacterial gene standard in a range of 106 to 100 copies. Furthermore, the software automatically calculated mean crossing point (cp) values for duplicates, which were used for the final calculations. The cp value of the last detectable standard was set as the LOD of the qPCR if the non-template control was not detectable. In the case where the non-template control also showed amplification, a cut-off principle was applied. Samples that had a higher cp value than the last detectable standard or the same cp value as the non-template control, were regarded as negative, only samples with lower cp values were regarded as positive [11].
Statistical analysis was performed using Microsoft Excel and the online program MEDCALC® statistical software [12]. The negative predictive value (NPV), as in the ability of a negative qPCR result to predict a negative culture result and the positive predictive value (PPV), as in the ability of a positive qPCR result to predict a positive culture result were calculated for the mip-specific qPCR as well as the wzm-specific qPCR. Comparison of L. pneumophila sg2–15 culture and qPCR results was performed using GraphPad Prism version 6.00 for Windows, GraphPad Software, La Jolla, CA, USA, www.graphpad.com.
3. Results
L. pneumophila Detection via ISO 11731 and qPCR
Of the 83 tested samples, 24.1% (20) were negative for Legionella spp. investigated with both methods. L. pneumophila was detected by culture at concentrations ranging from 2.0 × 100 to 1.0 × 10⁵ CFU/100 mL and L. pneumophila sg1 was detected at concentrations ranging from 2.0 × 100 to 4.0 × 10³ CFU/100 mL. The qPCR detected L. pneumophila (mip gene) in concentrations ranging from 1.44 × 10² to 2.97 × 10⁵ GU/100 mL, respectively, whereas L. pneumophila sg1 (wzm gene) was detected at concentrations ranging from 2.78 × 10³ to 1.79 × 10⁷ GU/100 mL. qPCR and culture only led to the same result in 56.6% (47) samples. LOD for qPCR was 2 × 10² GU/100 mL for mip (L. pneumophila) and 2 × 10³ GU /100 mL for wzm (L. pneumophila sg1), values below LOD were set to zero. LOD for culture was 1 CFU/100 mL. More information is available in the supplementary data.
We analyzed 20 drinking water samples. 85.0% (17) of these samples tested positive in culture as well as qPCR for L. pneumophila. The qPCR detected L. pneumophila DNA in 90.0% (18) of all samples tested, whereas there were 95.0% (19) positive samples in culture. 21 samples that came from cooling towers were tested. For the sample type cooling tower, samples only tested positive using both methods in 14.3% (3) of the cases, and further 42.9% (9) of samples tested negative using both methods (Table 2). 31 of the samples collected in this study were cooling water samples. qPCR and culture both showed a positive result in 22.6% (7) of the samples tested, and both showed a negative result in 32.3% (10) of the samples tested (Table 2). Eleven of the samples investigated were not classified specifically and were therefore grouped as “other”. 9.1% (1) of these samples tested both positive in culture as well as using qPCR, whereas 54.5% (5) where negative in qPCR and culture (Table 2).
qPCR detected L. pneumophila sg1 DNA in 10.0% (2) of all drinking water samples tested, which differs from 5.0% (1) positive samples in culture. 85% (17) of the screened drinking water samples did not show L. pneumophila sg1 contamination, both for qPCR and culture (see Table 3). For cooling towers, qPCR could detect L. pneumophila sg1 occurrence in 14.3% (3) of the samples, whereas culture showed a positive result in 23.8% (5) of all cases. qPCR did not find L. pneumophila sg1 DNA in 85.7% (18) of samples tested, and culture showed a negative result for 76.2% (16) of the samples investigated (see Table 3). qPCR and culture for cooling water both display a positive result for L. pneumophila sg1 occurrence in 3.2% (1) of the samples tested, and both display a negative result in 71.0% (22) of the samples tested. 25.8% (8) of the samples tested positive for L. pneumophila sg1 using qPCR, whereas culture only isolated L. pneumophila sg1 in 6.5% (2) of all cases. Accordingly, qPCR led to a negative result in 74.2% (23) of the cases, and culture in 93.5% (29) of the samples. 9.1% (1) of these samples tested both positive in culture as well as using qPCR, whereas 63.6% (7) samples were negative for both detection methods. qPCR was able to reveal L. pneumophila sg1 contamination in 9.1% (1) cases, and the culture method showed L. pneumophila sg1 contamination in 36.4% (4) cases. Consequently, qPCR led to a negative result in 90.9% (10) of the samples tested and culture was negative for 63.6% (7) (see Table 3).
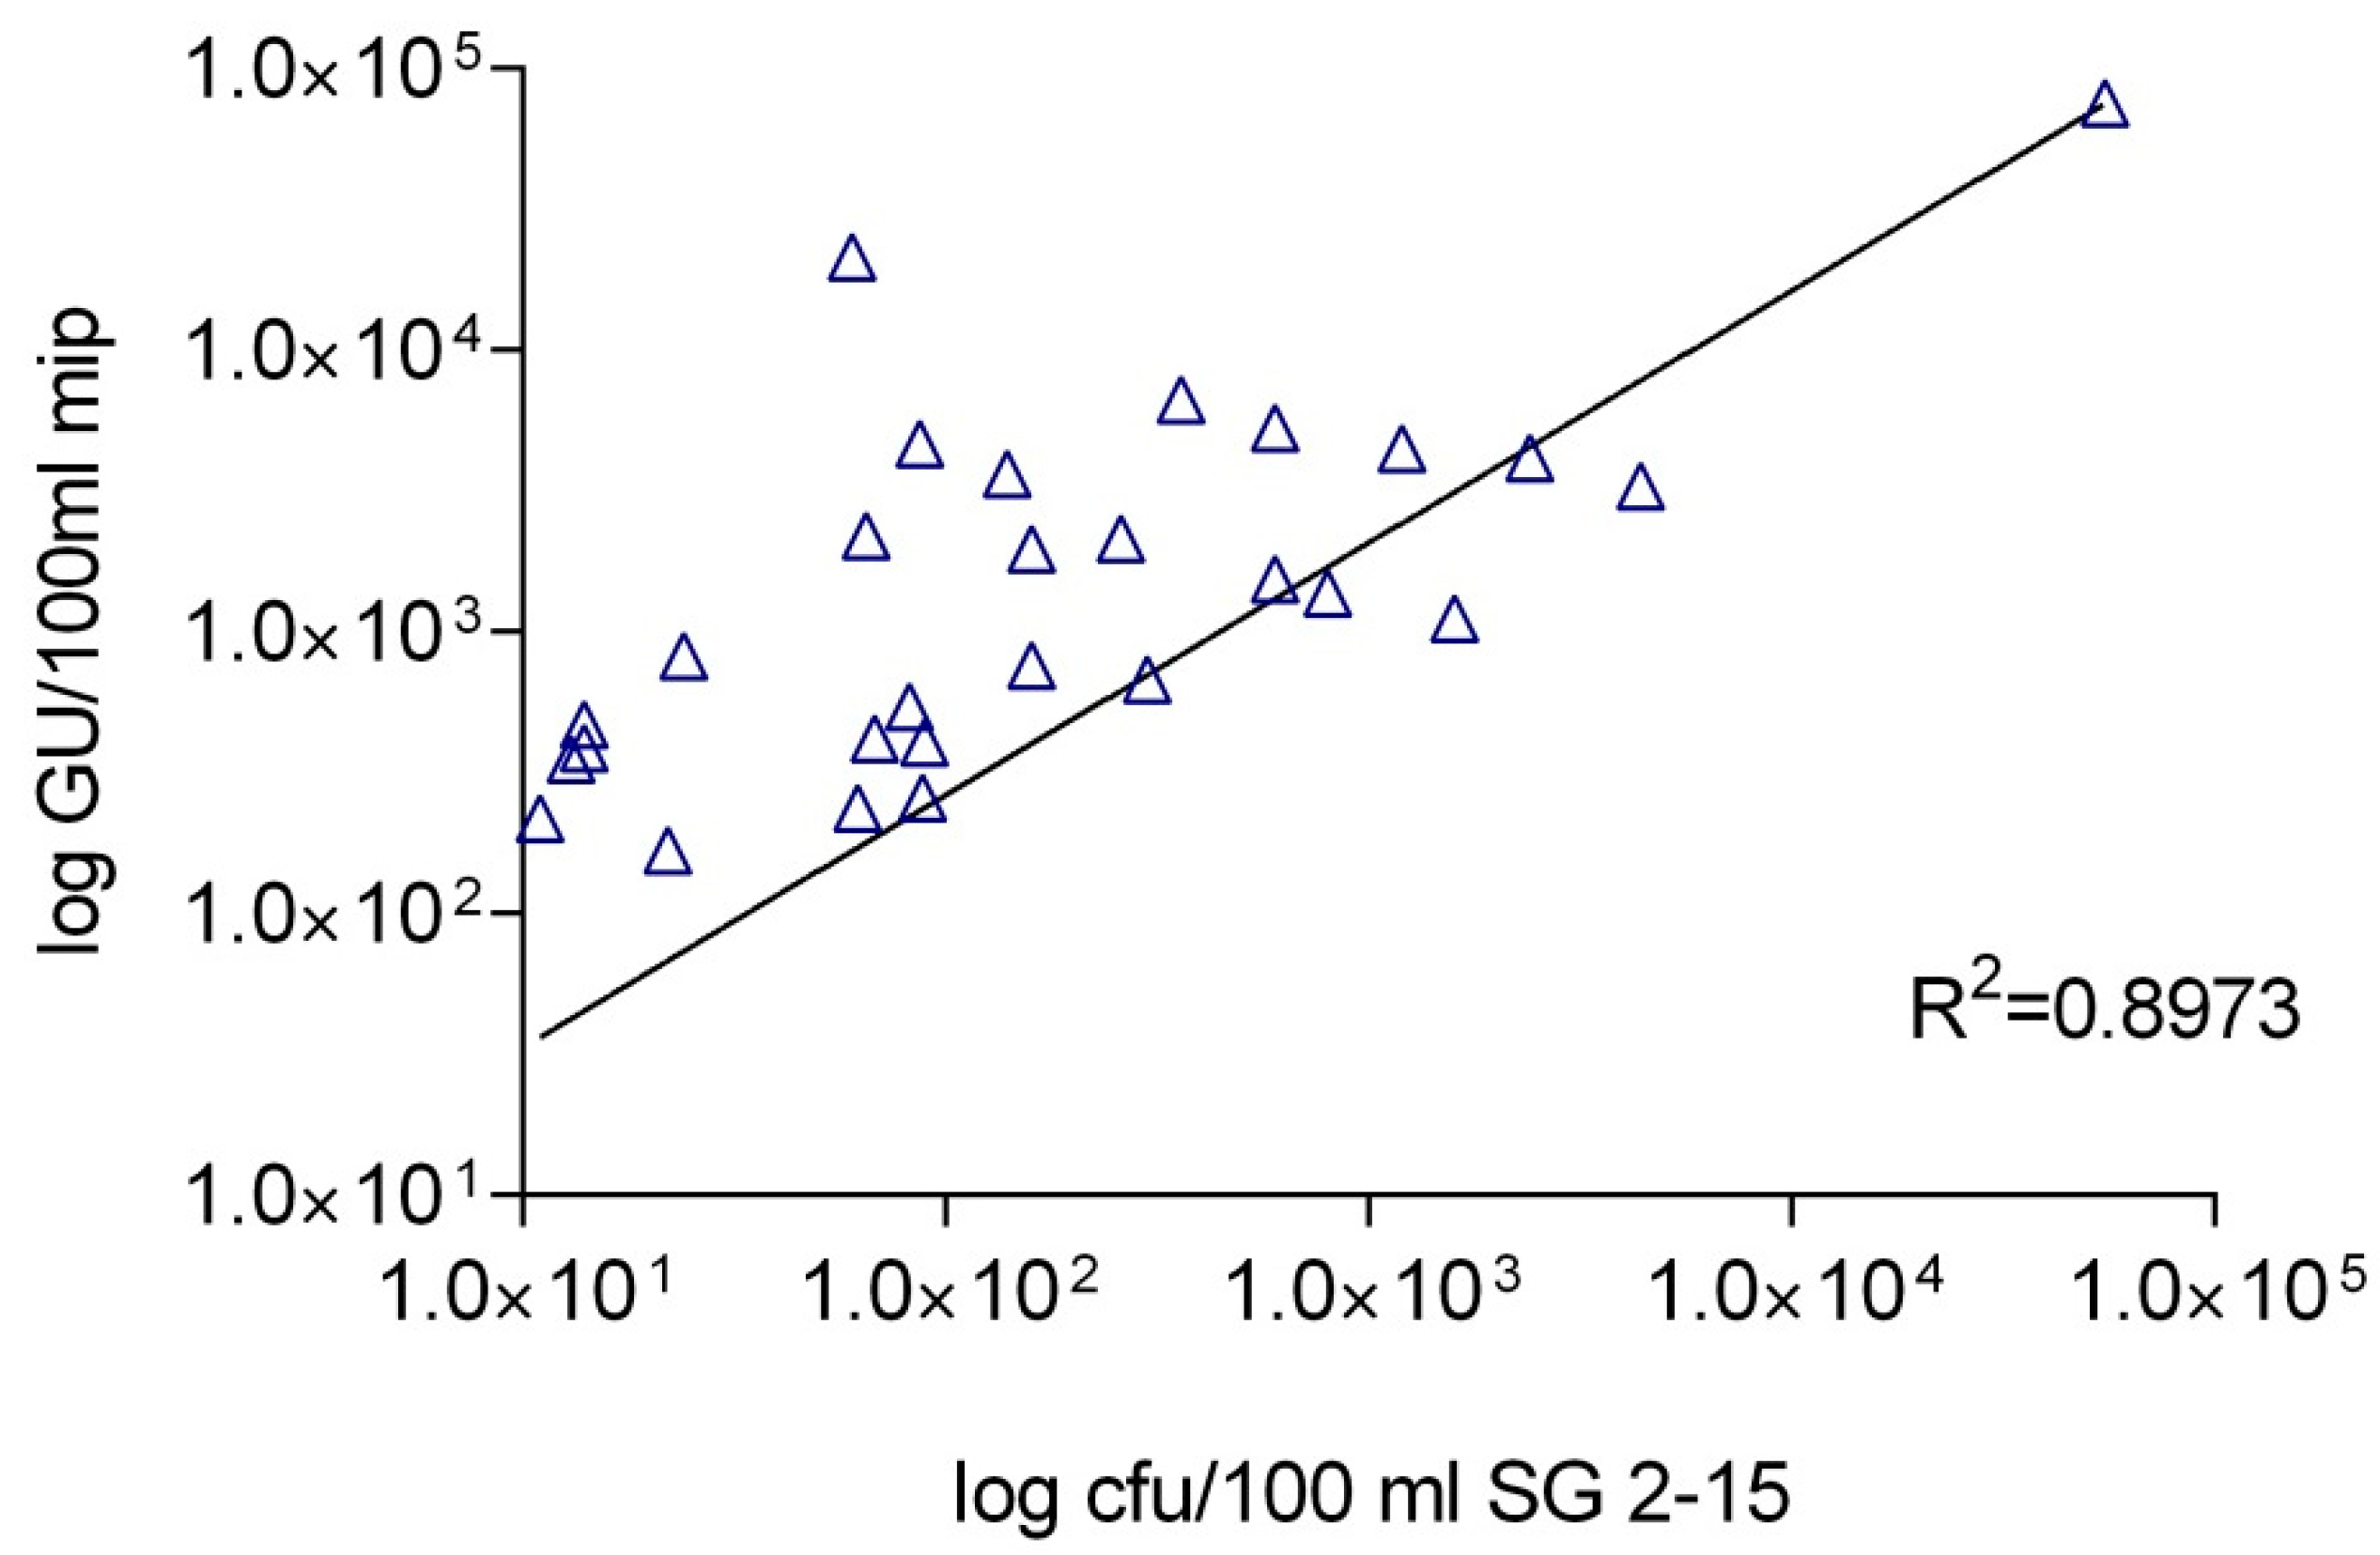
For the mip-specific qPCR, our study included 24 qPCR positive—culture negative results, as well as six qPCR negative—culture positive results, which leads to a PPV of 53.9%. The corresponding NPV was 80.7%. Linear regression for the sample readings with both positive results for culture and qPCR shows a correlation (R2 = 0.8973) between culture and qPCR (see Figure 1). For the wzm-specific qPCR, our study included eleven qPCR positive—culture negative results, as well as nine qPCR negative—culture positive results, which leads to a PPV of 21.4%. The corresponding NPV was 87.0%. For L. pneumophila sg1 no correlation between culture and qPCR results was observed. Samples which were negative in qPCR but positive in culture were repeated for the mip-specific as well as the wzm-specific qPCR on a separate occasion for control, and no change in results was observed.
For control of the DNA extraction efficiency, double distilled water was spiked with one LENTICULE DISC containing around 4.12 × 10⁴ CFU L. pneumophila NCTC12821 and experimental procedure was performed in the same manner as for the other samples. qPCR showed a L. pneumophila concentration of 1.8 × 10⁶ GU/100 mL, which indicates high extraction efficiency. The difference between GU levels and CFU levels in the LENTICULE DISC was also recognized by the supplier [13]. DNA recovery was done twice in triplicates and showed a recovery of 147.0% (L. pneumophila) and 144.8% (L. pneumophila sg1) (see Table 4).
For amplification inhibition testing, three samples with complex matrix (cooling water) were spiked with one LENTICULE DISC containing around 4.12 × 10⁴ CFU L. pneumophila NCTC12821 and experimental procedure was performed in the same manner as for the other samples. Samples spiked with a LENTICULE DISC showed GU levels in the same range as the DNA extraction efficiency control, which indicates that the qPCR reactions were not inhibited (see Table 4).
4. Discussion
qPCR has been proposed by several researchers as a fast and less labor-intensive alternative for screening of environmental samples for contamination with Legionella spp. qPCR can be performed out of the same water sample as the culture, so one suggestion of researchers has been that qPCR and culture-dependent methods could be run simultaneously: qPCR could then be used as a method for screening out negative samples in as quick as half a day after receipt of the sample in the laboratory, and qPCR negative samples would then not go into the culture for testing. In our study, we aimed to investigate L. pneumophila—qPCR as an example for an already established qPCR method that is used in some laboratories already as a standard method and compare the results with the gold standard culture method according to ISO 11731.
Our study reached an NPV for L. pneumophila of 80.7% and for L. pneumophila sg1 the calculated NPV was 87.0%, which confirms the possibility of the use of qPCR as a tool to screening out negative samples before culture. On the other hand, the PPV for L. pneumophila was 53.9% and for L. pneumophila sg1 the calculated NPV was 21.4%, which are both quite low in comparison to the gold standard culture method. Our study showed a correlation between qPCR and culture with an R2 value of 0.8973 for L. pneumophila, whereas no correlation was observed for the detection of L. pneumophila sg1.
Due to the low detection limit of the culture method (LOD = 1 CFU/100 mL) in comparison with the higher detection limit of the qPCR (LOD = 2 × 10² GU/100 mL or 2 × 10³ GU/100 mL, respectively) samples with low L. pneumophila concentration might be negative in qPCR but positive in culture: This was the case for six samples out of 83 for L. pneumophila, with the samples coming from different origins: sample nr. 170359 and 1606342 were cooling water samples, sample nr. 1707843 and 1707077 were classified as “other”, and samples nr. 1707195 and 1707076 were drinking water. For L. pneumophila sg1, nine samples out of 83 tested negative in qPCR, but positive in culture: sample nr. 1703556, 1703557, 170614 and 1704319 came from cooling towers, 1704378 was a drinking water sample, 1707175 was a cooling water sample and samples 1707622, 1707393 and 1707224 were classified as “other”. Samples in question remained negative after repeat on separate occasion.
Furthermore, ISO 11731 allows the enumeration of all Legionella species by differentiating them from other bacteria via the occurrence of growth on BCYE agar plates and no growth on Columbia blood agar plates. Further strain identification and serotyping of L. pneumophila isolates is only performed by picking 3–5 colonies at random and subjecting them to an agglutination test, which accounts for L. pneumophila sg 2–15 and sg1 as well as non-L. pneumophila species. This of course introduces a bias in the present results, as it may well be that with serotyping only a few colonies one might detect few L. pneumophila, whereas it might be possible that the majority of the remaining colonies identified actually be Legionella spp. Experience of the laboratory personnel in handling Legionella plays a central role in cultivation of the organism [4].
As yet, in the case of a positive qPCR result, one would still need to use conventional culture methods for confirmation of the results. This was the case for 52 samples in this study (61.5%). Right now, qPCR might be more useful for screening out negative samples as said before but relying only on qPCR for the detection of Legionella might not be fully possible yet. This is also highlighted by the fact that some samples in qPCR are positive for L. pneumophila sg1, but then not for L. pneumophila, which occurred in 11 (13.3%) samples, this occurrence may be due to the difference in fragment length detected by the different PCR: the wzm-target has a fragment length of 70 bp, which might be more likely to be amplified or found in fragmented DNA, as opposed to the mip-target fragment of 115 bp [14].
Some suggest that from a public health viewpoint, reporting very low numbers of Legionella cells is not recommended, as in the European Guidelines the alert level lies at 103 CFU/mL [15]. Of course, the time factor is of great importance in a public health setting and qPCR could be used to give out public health warnings after one day, whereas culture can give results after a ten-day incubation period, which could delay successful decontamination of the outbreak source.
The discrepancy found between qPCR and culture has been discussed in literature at great length and is mostly due to the detection of dead cells or VBNC cells via qPCR which then lead to an overestimation of the bacterial burden of the sample. qPCR detects cells that entered the VBNC state after the use of disinfectants or Legionella living in protozoa, which would not be detected using the culture method [8]. The culture method has several limitations, too; Legionella might get inhibited or overgrown by competing microbiota and the method is also biased towards the isolation of L. pneumophila sg1 [2,16].
The addition of propidium monoazide (PMA), a DNA intercalating dye that links to the DNA and prevents DNA amplification during the PCR reaction has been proposed to overcome amplification of DNA from dead cells. Thus, the DNA from cells with a compromised membrane would be excluded. However, these methods are not completely reliable yet: First not all types of disinfection lead to membrane damage (e.g., UV treatment rather damages the genetic material) [15] and as a matter of this PMA could be excluded. PMA cannot be used with all sample types as turbidity limits crosslinking of PMA to the DNA, and finally amplicon length also plays a role: It is more unlikely for shorter amplicons to incorporate PMA into the DNA and so inhibit amplification [17].
Another difficulty in the comparison of qPCR and culture is the difference between GU and CFU, where a conversion equation for Legionella has not been established yet. Elevated detection of L. pneumophila by qPCR is also displayed in the low PPV values [18,19,20,21,22]. The sample type also seems to determine the ability to compare qPCR and culture results. In our study, for drinking water samples the qPCR method detects L. pneumophila DNA in n = 18 (90.0%) of all samples tested, which goes in line with n = 19 (95.0%) positive samples found in culture. Other sample types, such as cooling towers, showed a discrepancy between qPCR and culture: qPCR could detect L. pneumophila occurrence in 12 (57.1%) of the samples, whereas the culture-dependent methods gave a positive result in only 3 (14.3%) of all cases.
These findings suggest that the sample type strongly influences cultivability and qPCR results. In addition, this finally proposes the need for an evaluation and validation of different qPCR tools in the own laboratory before implementation of the method in to the routine water quality assessment.
Supplementary Materials
Supplementary materials can be found at https://www.mdpi.com/2073-4441/10/8/1012/s1. Figure S1: Standard curve for mip-gene based qPCR: serial dilutions ranging from 106 to 100 target gene copies were used in the qPCR; Figure S2: Linearity of mip-gene based qPCR: The qPCR shows a LOD of 2 × 10² GU/100 mL; Figure S3: Standard curve for wzm-gene based qPCR: serial dilutions ranging from 106 to 100 target gene copies were used in the qPCR; Figure S4: Linearity of wzm-gene based qPCR: The qPCR shows a LOD of 2 × 10³ GU/100 mL; Table S1: Results for qPCR and culture for L. pneumophila and L. pneumophila sg1. LOD for qPCR was 2 × 10² GU/100 mL for mip (L. pneumophila) and 2 × 10³ GU/100 mL for wzm (L. pneumophila sg1 ), values below LOD were set to zero. LOD for culture was 1/100 mL.
Author Contributions
C.K. conceived and designed the study; S.P., B.P. and J.H. analyzed samples via culture and F.M. provided samples as well as background information of the samples. D.T. performed the DNA extraction and qPCR experiments. D.T. and C.K. analyzed the data. D.T., F.M. and C.K. wrote the manuscript. D.T. and C.K. edited the manuscript.
Funding
This research received no external funding.
Conflicts of Interest
The authors declare no conflict of interest.
References
- Collins, S.; Jorgensen, F.; Willis, C.; Walker, J. Real-time PCR to supplement gold-standard culture-based detection of Legionella in environmental samples. J. Appl. Microbiol. 2015, 119, 1158–1169. [Google Scholar] [CrossRef] [PubMed]
- Collins, S.; Stevenson, D.; Walker, J.; Bennett, A. Evaluation of Legionella real-time PCR against traditional culture for routine and public health testing of water samples. J. Appl. Microbiol. 2017, 122, 1692–1703. [Google Scholar] [CrossRef] [PubMed]
- Whiley, H.; Taylor, M. Legionella detection by culture and qPCR: Comparing apples and oranges. Crit. Rev. Microbiol. 2016, 42, 65–74. [Google Scholar] [CrossRef] [PubMed]
- World Health Organization. Legionella and the Prevention of Legionellosis; World Health Organization: Geneva, Switzerland, 2007. [Google Scholar]
- Wewalka, G.; Schmid, D. Nationale Referenzzentrale für Legionella—Infektionen Jahresbericht 2016; AGES: Vienna, Austria, 2017. [Google Scholar]
- Leclerc, H. Relationships between Common Water bacteRia and Pathogens in Drinking-Water. In Heterotrophic Plate Counts and Drinking-Water Safety; World Health Organization, Ed.; IWA Publishing: London, UK, 2003. [Google Scholar]
- Berjeaud, J.M.; Chevalier, S.; Schlusselhuber, M.; Portier, E.; Loiseau, C.; Aucher, W.; Lesouhaitier, O.; Verdon, J. Legionella pneumophila: The Paradox of a Highly Sensitive Opportunistic Waterborne Pathogen Able to Persist in the Environment. Front. Microbiol. 2016, 7, 486. [Google Scholar] [CrossRef] [PubMed]
- Casini, B.; Baggiani, A.; Totaro, M.; Mansi, A.; Costa, A.L.; Aquino, F.; Miccoli, M.; Valentini, P.; Bruschi, F.; Lopalco, P.L.; et al. Detection of viable but non-culturable legionella in hospital water network following monochloramine disinfection. J. Hosp. Infect. 2018, 98, 46–52. [Google Scholar] [CrossRef] [PubMed]
- Casini, B.; Aquino, F.; Totaro, M.; Miccoli, M.; Galli, I.; Manfredini, L.; Giustarini, C.; Costa, A.L.; Tuvo, B.; Valentini, P.; et al. Application of Hydrogen Peroxide as an Innovative Method of Treatment for Legionella Control in a Hospital Water Network. Pathogens 2017, 6, 15. [Google Scholar] [CrossRef] [PubMed]
- Totaro, M.; Valentini, P.; Costa, A.L.; Giorgi, S.; Casini, B.; Baggiani, A. Rate of Legionella pneumophila colonization in hospital hot water network after time flow taps installation. J. Hosp. Infect. 2018, 98, 60–63. [Google Scholar] [CrossRef] [PubMed]
- Gensberger, E.T.; Polt, M.; Konrad-Koszler, M.; Kinner, P.; Sessitsch, A.; Kostic, T. Evaluation of quantitative PCR combined with PMA treatment for molecular assessment of microbial water quality. Water Res. 2014, 67, 367–376. [Google Scholar] [CrossRef] [PubMed]
- MedCalc Software bvba MedCalc®. Diagnostic Test Evaluation Calculator. Easy to Use Statistical Software. Available online: https://www.medcalc.org/calc/diagnostic_test.php (accessed on 3 March 2018).
- Public Health England, Food and Environmental Proficiency Testing Unit (FEPTU). Summary of Results Legionella Molecular Scheme External Quality Assessment for Water Microbiology; Public Health England: London, UK, 2017. [Google Scholar]
- Debode, F.; Marien, A.; Janssen, É.; Bragard, C.; Berben, G. The influence of amplicon length on real-time PCR results. Biotechnol. Agron. Soc. Environ. 2017, 21, 3–11. [Google Scholar]
- Ditommaso, S.; Giacomuzzi, M.; Ricciardi, E.; Zotti, C.M. Viability-qPCR for detecting Legionella: Comparison of two assays based on different amplicon lengths. Mol. Cell. Probes 2015, 29, 237–243. [Google Scholar] [CrossRef] [PubMed]
- Kirschner, A.K.T. Determination of viable legionellae in engineered water systems: Do we find what we are looking for? Water Res. 2016, 93, 276–288. [Google Scholar] [CrossRef] [PubMed] [Green Version]
- Seidel, L.; Strathmann, M.; Nocker, A. The feasibility of improved live-dead distinction in qPCR-based microbial source tracking. J. Microbiol. Methods 2017, 140, 23–31. [Google Scholar] [CrossRef] [PubMed]
- Yaradou, D.F.; Hallier-Soulier, S.; Moreau, S.; Poty, F.; Hillion, Y.; Reyrolle, M.; Andre, J.; Festoc, G.; Delabre, K.; Vandenesch, F.; et al. Integrated real-time PCR for detection and monitoring of Legionella pneumophila in water systems. Appl. Environ. Microbiol. 2007, 73, 1452–1456. [Google Scholar] [CrossRef] [PubMed]
- Joly, P.; Falconnet, P.A.; Andre, J.; Weill, N.; Reyrolle, M.; Vandenesch, F.; Maurin, M.; Etienne, J.; Jarraud, S. Quantitative real-time Legionella PCR for environmental water samples: Data interpretation. Appl. Environ. Microbiol. 2006, 72, 2801–2808. [Google Scholar] [CrossRef] [PubMed]
- Diaz-Flores, A.; Montero, J.C.; Castro, F.J.; Alejandres, E.M.; Bayon, C.; Solis, I.; Fernandez-Lafuente, R.; Rodriguez, G. Comparing methods of determining Legionella spp. in complex water matrices. BMC Microbiol. 2015, 15, 91. [Google Scholar] [CrossRef] [PubMed]
- Fittipaldi, M.; Codony, F.; Morató, J. Comparison of conventional culture and real-time quantitative PCR using SYBR Green for detection of Legionella pneumophila in water samples. Water SA 2010, 36. [Google Scholar] [CrossRef]
- Guillemet, T.A.; Levesque, B.; Gauvin, D.; Brousseau, N.; Giroux, J.P.; Cantin, P. Assessment of real-time PCR for quantification of Legionella spp. in spa water. Lett. Appl. Microbiol. 2010, 51, 639–644. [Google Scholar] [CrossRef] [PubMed] [Green Version]
Figure 1.
Comparison of L. pneumophila sg2–15 culture and qPCR results (mip gene) for 83 water samples: Only pairs of results with values positive both in culture and qPCR are shown and used for calculation of the correlation coefficient (n = 28). The R2 value of 0.8973 indicates a correlation between culture and qPCR.


Table 1.
qPCR conditions, primers and probes for L. pneumophila and L. pneumophila sg1.
| Temperature (°C) | Time | |||
|---|---|---|---|---|
| prae-incubation | 95 | 10 min | ||
| amplification | 95 | 15 s | 45 cycles | |
| 60 | 1 min | |||
| primer forward | mip fwd | TTGTCTTATAGCATTGGTGCCG | (L. pneumophila) | |
| primer reverse | mip rev | CCAATTGAGCGCCACTCATAG | ||
| probe | Legionella-mip | CY5-CGGAAGCAATGGCTAAAGGCATGCA-BHQ11 | ||
| product size | 115 bp | |||
| primer forward | wzm fwd | TGCCTCTGGCTTTGCAGTTA | (L. pneumophila sg1) | |
| primer reverse | wzm rev | CACACAGGCACAGCAGAAACA | ||
| probe | Legionella-wzm | HEX-TTTATTACTCCACTCCAGGCGAT-BHQ11 | ||
| product size | 70 bp | |||
| positive control | L. pneumophila sg1 DSM 7513 Philadelphia strain 1 | |||
1 Black Hole Quencher®.
Table 2.
Detection of L. pneumophila via culture and qPCR (mip gene).
| L. pneumophila | |||||||
|---|---|---|---|---|---|---|---|
| Sample Type | Amount | Both Positive | Both Negative | PCR Positive | Culture Positive | PCR Negative | Culture Negative |
| drinking water | 20 | 85.0% (17) | 0.0% (0) | 90.0% (18) | 95.0% (19) | 10.0% (2) | 5.0% (1) |
| cooling tower | 21 | 14.3% (3) | 42.9% (9) | 57.1% (12) | 14.3% (3) | 42.9% (9) | 85.7% (18) |
| cooling water | 31 | 22.6% (7) | 32.3% (10) | 61.3% (19) | 29.0% (9) | 38.7% (12) | 71.0% (22) |
| other | 11 | 9.1% (1) | 54.5% (6) | 27.3% (3) | 27.3% (3) | 72.7% (8) | 72.7% (8) |
Table 3.
Detection of L. pneumophila sg1 via culture and qPCR (wzm gene).
| L. pneumophila sg1 | |||||||
|---|---|---|---|---|---|---|---|
| Sample Type | Amount | Both Positive | Both Negative | PCR Positive | Culture Positive | PCR Negative | Culture Negative |
| drinking water | 20 | 0.0% (0) | 85.0% (17) | 10.0% (2) | 5.0% (1) | 90.0% (18) | 95.0% (19) |
| cooling tower | 21 | 4.8% (1) | 66.7% (14) | 14.3% (3) | 23.8% (5) | 85.7% (18) | 76.2% (16) |
| cooling water | 31 | 3.2% (1) | 71.0% (22) | 25.8% (8) | 6.5% (2) | 74.2% (23) | 93.5% (29) |
| other | 11 | 9.1% (1) | 63.6% (7) | 9.1% (1) | 36.4% (4) | 90.9% (10) | 63.6% (7) |
Table 4.
DNA extraction efficacy and amplification inhibition control, values given in GU/100 mL.
| L. pneumophila | ||
| Sample nr. | Spiked Samples | Native Sample |
| 1706745 | 3.98 × 10⁶ | 1.55 × 10³ |
| 1706746 | 1.83 × 10⁶ | 0.00 × 100 |
| 1706747 | 2.13 × 10⁶ | 5.45 × 10² |
| dd H20 | 1.80 × 10⁶ | 0.00 × 100 |
| L. pneumophilasg1 | ||
| Sample nr. | Spiked Samples | Native Sample |
| 1706745 | 5.24 × 10⁶ | 0 |
| 1706746 | 2.31 × 10⁶ | 0 |
| 1706747 | 2.79 × 10⁶ | 0 |
| dd H20 | 2.38 × 10⁶ | 0 |
© 2018 by the authors. Licensee MDPI, Basel, Switzerland. This article is an open access article distributed under the terms and conditions of the Creative Commons Attribution (CC BY) license (http://creativecommons.org/licenses/by/4.0/).
Share and Cite
MDPI and ACS Style
Toplitsch, D.; Platzer, S.; Pfeifer, B.; Hautz, J.; Mascher, F.; Kittinger, C. Legionella Detection in Environmental Samples as an Example for Successful Implementation of qPCR. Water 2018, 10, 1012. https://doi.org/10.3390/w10081012
AMA Style
Toplitsch D, Platzer S, Pfeifer B, Hautz J, Mascher F, Kittinger C. Legionella Detection in Environmental Samples as an Example for Successful Implementation of qPCR. Water. 2018; 10(8):1012. https://doi.org/10.3390/w10081012
Chicago/Turabian StyleToplitsch, Daniela, Sabine Platzer, Bettina Pfeifer, Jürgen Hautz, Franz Mascher, and Clemens Kittinger. 2018. "Legionella Detection in Environmental Samples as an Example for Successful Implementation of qPCR" Water 10, no. 8: 1012. https://doi.org/10.3390/w10081012
Note that from the first issue of 2016, this journal uses article numbers instead of page numbers. See further details here.