A New Vulnerability Measure for Water Distribution Network
by
 , , and
Mario Maiolo
1 ,
,
Daniela Pantusa
2,* ,
,
Manuela Carini
1,
Gilda Capano
1,
Francesco Chiaravalloti
3 and
Antonio Procopio
3 1
Department of Environmental and Chemical Engineering, University of Calabria, street Pietro Bucci, cube 42b, 87036 Rende, Italy
2
Innovation Engineering Department, University of Salento, Via Monteroni, Ecotekne, I-73100 Lecce, Italy
3
Research Institute for Geo-Hydrological Protection (IRPI), CNR, 87036 Rende (CS), Italy
*
Author to whom correspondence should be addressed.
Water 2018, 10(8), 1005; https://doi.org/10.3390/w10081005
Submission received: 25 June 2018
/
Revised: 25 July 2018
/
Accepted: 27 July 2018
/
Published: 30 July 2018
(This article belongs to the Section Urban Water Management)
Abstract
:The main objective of a water distribution network is to provide water to users in compliance with quality and service standards under different conditions. The ability to meet the water demand at the nodes, under the required pressures head, depends on many characteristic factors of the water network, such as various infrastructural components. A water distribution network is a complex system consisting of numerous structural elements and dependent by several factors. Resilience, robustness and vulnerability are of great interest, for these systems, in relation to the possible failure conditions which may compromise the network’s ability to fulfill the project conditions. Vulnerability measures how much the network is fragile: a higher value of vulnerability means that the network is prone to fail in achieving the project conditions. In the present work, a new vulnerability measure based on a topological approach is proposed. A first application of the proposed vulnerability measure on two water networks known in the literature is described, and the obtained results are compared with other performance indices showing a significant correlation.
1. Introduction
A network (or graph) is a collection of points called nodes or vertices, linked by segments called edges or arcs. A network is useful as a mathematical representation of a set of interconnected objects. Different kinds of networks exist, based on the properties of the arcs. If every arc has a scalar quantity (weight) associated, the network is called weighted, otherwise it is called unweighted. If the arcs can be travelled in both directions, the network is undirected, while if the direction of the arcs is fixed, the network is directed. In the case of a distribution network, in which the users receive goods stocked in or produced by a source, an obvious representation would be a network in which the nodes represent the users and the source, while the transportation routes are represented by the arcs. Water Distribution Networks (WDNs) are complex networks for structure and functionality, and can be associated with a directed or undirected graph, allowing the use of graph theory to study its characteristics [1,2,3]. The topological structure of a generic WDN considers that the nodes are represented by the sources of water supply and by the utilities, while the arcs represent the pipelines. The structure complexity depends on the possible combinations of the pipeline dimensions and materials, the position of the source nodes and destinations, the demand and loads variability, the pumping stations, and the tanks capacity.
Given the growing problems related to water resources, important is the analysis of the different factors that affect the drinking water service. Actually, the management and design of WDN is a recurring problem in hydraulic engineering and there are several aspects of research connected with this issue. Current research topics are those related to optimization models for design and management but also those concerning the aspects of pipe failures and maintenance of the efficiency of the plant parts, the adequate response to natural and made-man damages and emergencies, and the assessment of the impacts of climate change [4,5,6,7,8,9,10,11].
It is known that the adequate functioning of a WDN depends on its ability to satisfy the design demand, which is correlated to the network geometry. Several WDN performance indices are present in the literature. Reliability, robustness, vulnerability, and resilience (see Table 1), often combined together to characterize the system response to different events [12], are among the most used indices. An overview about these indices applied to WDN can be found in [13,14,15].
These indices refer to different theoretical frameworks and they are based on different approaches like entropy approach, hydraulic approach, topological approach. Regarding the approach based on entropy, Tanyimboh and Templeman [16] proposed the use of maximum entropy flows for single-source networks, based on Shannon entropy formulation, as a surrogate reliability measure. Others examples of use of the concept of entropy in looped network redundancy as a surrogate measure of network reliability are described in [17,18].
Instead, a hydraulic approach that uses the concept of resilience was proposed by Todini [19]. According to this approach, resilience is strongly linked to the intrinsic capacity of the system to overcome failures in relation to pressure head surplus in normal operating conditions which allows the network to overcome critical operating conditions. Prasad and Park [20] extended Todini’s concept by combining the effects of both surplus power and reliable loops. Authors stated that reliable loops can be ensured if the pipes connected to a node are not widely varying in diameter. They defined the pipe diameter uniformity, for each node, as the ratio of the average of the diameters of the pipes connected to a node to the maximum diameter at that node. A modified resilience index was proposed by [21] as an improvement over the Todini resilience index, in terms of applicability to networks with multiple sources. A new heuristic method was proposed by authors for use in design and rehabilitation problems that aim to maximize network performance while minimizing the life cycle cost. The concept of “availability” as resilience of a WDN was proposed by Jayaram and Srinivasan [22]; “availability” was defined as the fraction of water supplied to demand nodes during disruptions and is related to the water flow supplied to the ith node at time t, to the water demand required at ith node at time t, to the total time period under system disruption, and to the total number of nodes. A robustness index that limits the range of the system function variability is described [23]. Authors proposed a robustness index to consider the variation of WDS performance to uncertain conditions. As a constraint in an optimal design model, the robustness index limits the range of variability of system function by constraining the coefficient of variation (CV) of stochastic pressures due to demand and pipe roughness variability. First-order second-moment (FOSM) approach is used for uncertainty quantification and NSGA-II is used to solve the multiobjective optimization problem. Wright et al. [24] suggested a resilience measure based on the concept of “reserve capacity”. Reserve capacity was defined as a demand multiplier that represents how close a WDN is operating to a minimum service level. The reserve capacity is estimated at a critical node where the difference between allowable head and the head at the node shows a minimum value. A method for the calculation of the reserve capacity has been presented based on a Newton method. A global resilience measure related to social, technical, and environmental system performance was proposed by Cimellaro et al. [25]. The social, technical, and environmental performance was defined as the functionality of each domain under disruptions compared to their functionality under normal operating conditions. The proposed resilience index is related to the number of users temporarily without water, to the water level in the tank, and to the water quality.
Instead, the topological approaches refer to network connectivity and physical connections between the demand nodes and the sources of water supply. According to this approach, Pinto et al. [26] proposed the Theory of the Vulnerability of Water Pipe Network (TVWPN) based on connectivity and quality analysis of piping in a WDN. In [27], the WDN structural vulnerability and robustness was analyzed by detecting the cut-sets, that is the components groups whose removal determines the disconnection. A method for evaluation of nodal vulnerability of WDNs under the cascading failures was proposed by Shuang et al. [28]. Monitored pressures in different nodes and flows in different pipes was used by authors to estimate the network topological structure and the consequences of nodal failure. The failure consequences were analyzed from the aspects of network topology structure, nodal pressures and flow distributions. The nodal vulnerability was evaluated based on the connectivity loss of topological structure. A topological vulnerability analysis was proposed by Agathokleous et al. [12], which aims to identify the interest nodes in a water distribution system, assigning nodal betweenness centrality values to each one. In this work, it is shown that the network topological robustness changes, and consequently the vulnerability index, changing the network operating conditions. This demonstration was reinforced by a comparison between a network with Continuous Water Supply and a network with Intermittent Water Supply. A novel index of network resilience (INR) for urban water distribution systems is presented in [29]. This index incorporates six network attributes based on the topology of the WDN. A multi-criteria analysis (MCA) was employed to evaluate the alternative configurations which would satisfy the demand and other hydraulic requirements, and the Analytic hierarchy process (AHP) was used to assign weights to the attributes. Another topological approach was proposed by Herrera et al. [30]; the resilience of WDNs was assessed from a topological perspective where properties such as network configuration and redundancy in connectivity are considered together with physical-based flow properties. In particular, authors described a novel graph-theoretic approach for the assessment of resilience for large scale water distribution networks.
The present work proposes a new measure to compute WDN vulnerability.
In particular, the proposed measure considers the topological characteristics of the components in the network and it is based on a graph theory approach.
Some authors discussed about the limitations of the purely topological graph representation and topological approach. In [31,32], topological connectivity analysis is discussed, which may be viewed as a fundamental and necessary yet insufficient basis for water distribution systems reliability and vulnerability analysis, due to the restricted access to system component data. However, using weighted and directed network models and techniques based on the available information on component attributes and system hydraulics may considerably improve such connectivity analysis through strengthening the analogy between network graphs and real systems.
Regarding reliability measure in [33] is reported that the topological reliability measures should not be solely used because they do not account for system hydraulics or guarantee system performance under uncertain demand and roughness conditions. The topological analysis, as it is structured, is to be understood as associable with other hydraulic and energetic evaluations.
Therefore, the use of weighted and directed network models and hydraulic and energy assessments make the topological approach a useful and necessary tool for the vulnerability analysis. In fact, these limitations do not diminish the scientific validity of the research related to the topological approach which remains a topic of current scientific interest.
In this paper, the analytic discussion is presented below and the applicability to the two water networks known in the literature (Walski network [34,35] and Ozger and Mays network [36]) is verified. To strengthen the proposed new formulation, the correlation between the new vulnerability index and some performance indices known in the literature has been evaluated.
2. Materials and Methods
2.1. Proposed Vulnerability Measure
According to graph theory, a water distribution network can be represented as a directed and weighted network: the direction of the arcs is represented by the direction of the water along the pipes, while the weight of an arch is relative to the flow.
It is important to stress that the water direction is not constant in a water distribution network, but it is possible to consider, as a starting analysis, a steady-state type analysis in daily average conditions [37].
As defined by Hashimoto et al. [38], in this paper, the vulnerability is understood as a measure of the significance (or consequences) of failure. In particular, vulnerability refers to demand deficit during pipe failure events and therefore is related to capacity of the system to guarantee the satisfaction of every user in the network.
For the vulnerability measure, it is possible to assign to each pipe a weight equal to the daily average flow; this weight is subsequently normalized with respect to the sum of all the weights:
where the sum at the denominator runs over every pipe in the network.
The pipe with the greatest average daily flow rate is not necessarily the most vulnerable in the network, this also in relation to the aspects of redundancy of the network itself. In fact, considering only the flow rate of each pipe may bring to an analysis which takes into accounts the pipes as elements in itself and not as parts of a bigger system. In this kind of network, it is better to consider the sum of the water quantities transported by the arcs reachable after following the one considered. Thus, for the arc going from to , we call this quantity .
It is obviously important to know the number of nodes from which a pipe is reachable, too: we call this number . In fact, these “predecessor” nodes will be an important feature whenever a pipe fails along the route: in the designed and optimized scenario, the water flows through a predetermined route, but if a pipe along this path in unavailable, the water needs to be redirected along another way, passing through other pipes. Thus, if there are few nodes from which is possible to reach the pipe in question, it is plausible to mark the pipe as very vulnerable, because it could be very difficult to reach.
As for the weights, a normalization is also needed for : a good and trivial normalization is over the total amount of water needed to satisfy every user. The normalized value will be:
where is the amount of water needed by the node , and the sum at the denominator runs over all the nodes in the network. The vulnerability measure should be higher for arcs which are difficult to reach: instead of , we consider .
It is also favorable to assign the opposite of the sum of the weights in the whole network as a weight to the arcs which transport a null amount of water: in this way we obtain −1, and the arc is considered useless.
A linear combination of these three values is a good candidate to be a vulnerability measure for an arc going from to :
where and can be chosen accordingly to how much each of the three addends is considered important.
To have a normalized measure, with values in the range , it is needed that , that is . With this constraint, the measure depends pn only two parameters :
2.2. Study Networks
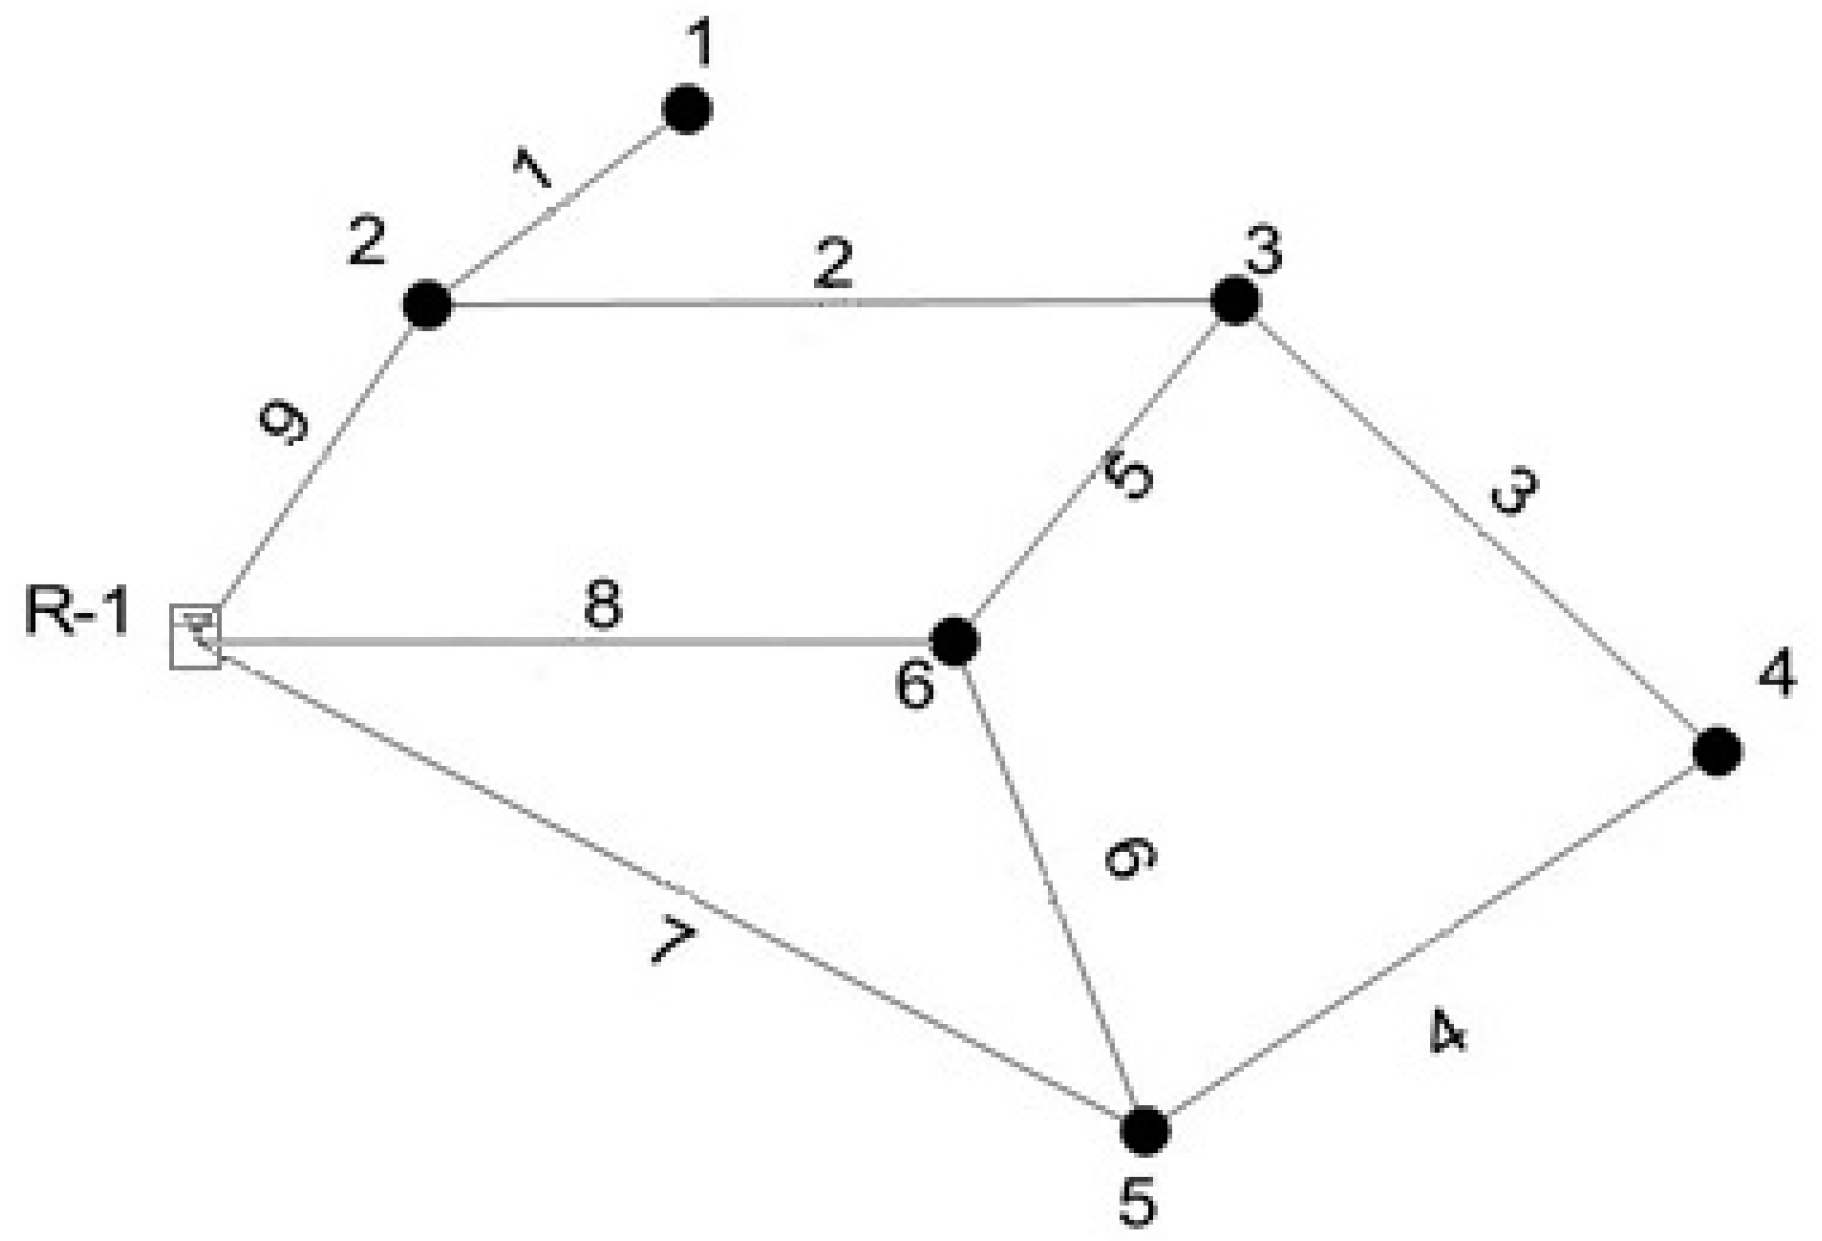
The proposed vulnerability measure has been applied on two water distribution networks; the first network is the one proposed by Walski [34,35] while the second is the one described by Ozger and Mays [36]. Walski’s network is shown in Figure 1, while pipe and node characteristics are described in Table 2 and Table 3.
The hydraulic grade line elevation at the tank is 60.9 m and the minimum pressure head threshold has been set at 45 m for all junctions of the network.
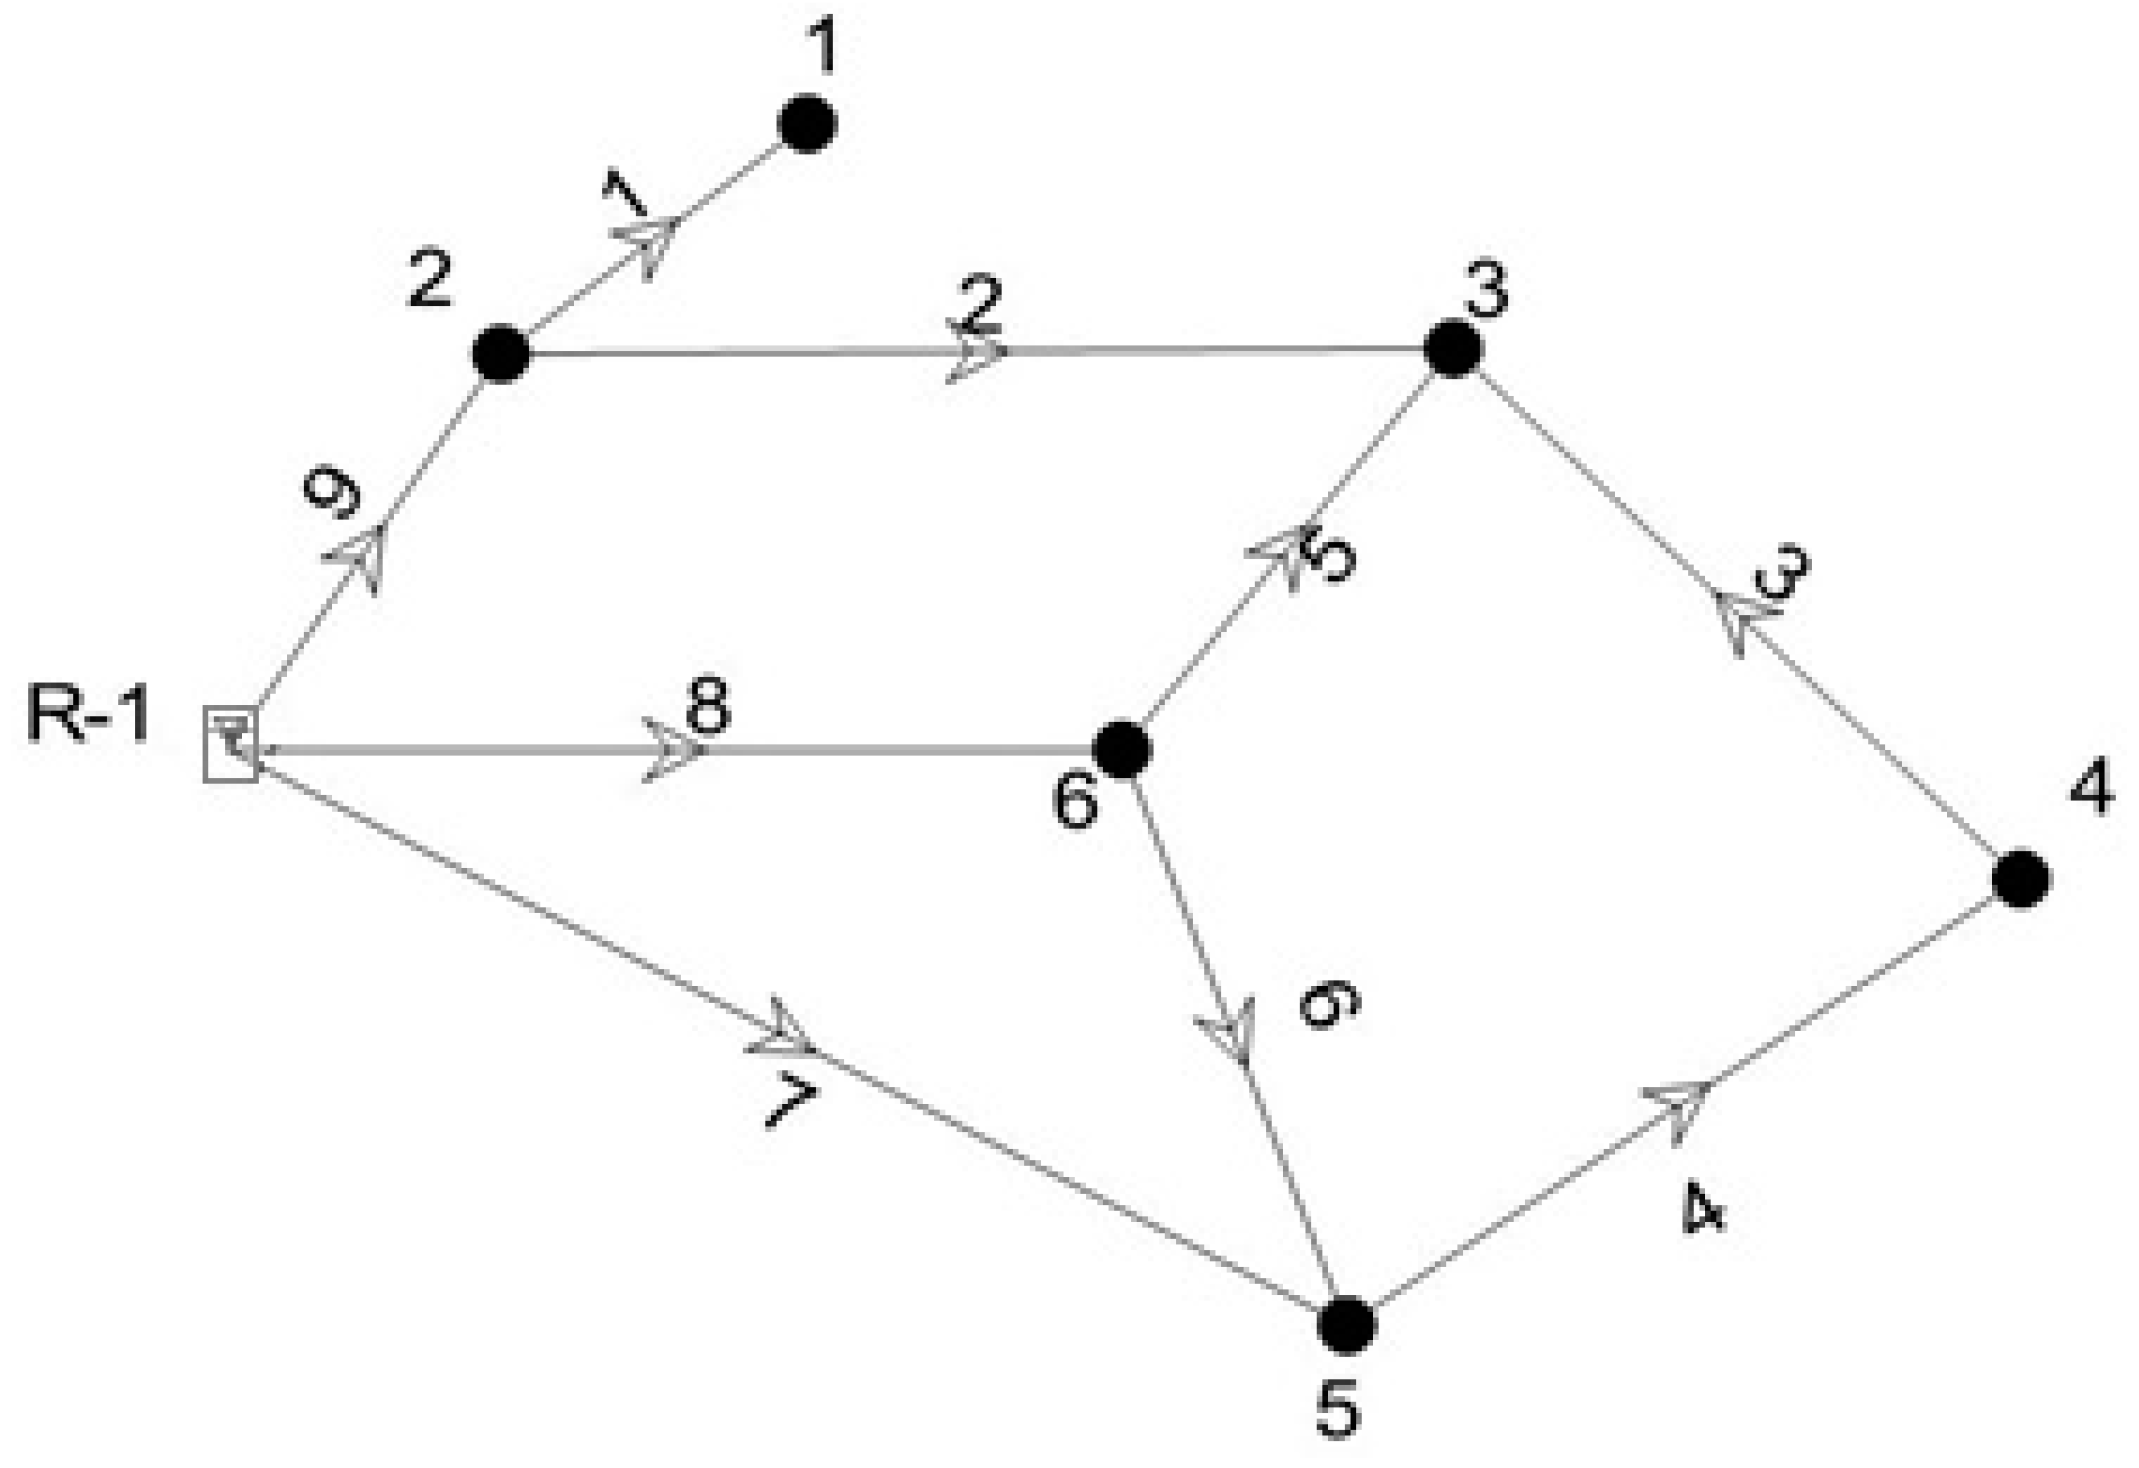
The network has been first analyzed in a condition of full function without pipe failures.
In this condition, the demand as well as the minimum pressure head threshold are satisfied for all the nodes. The hydraulic simulations have been carried out by means of the WaterCad software (https://www.bentley.com/it/products/product-line/hydraulics-and-hydrology-software/watercad). The results of the simulation are shown in Figure 2 and Table 4.
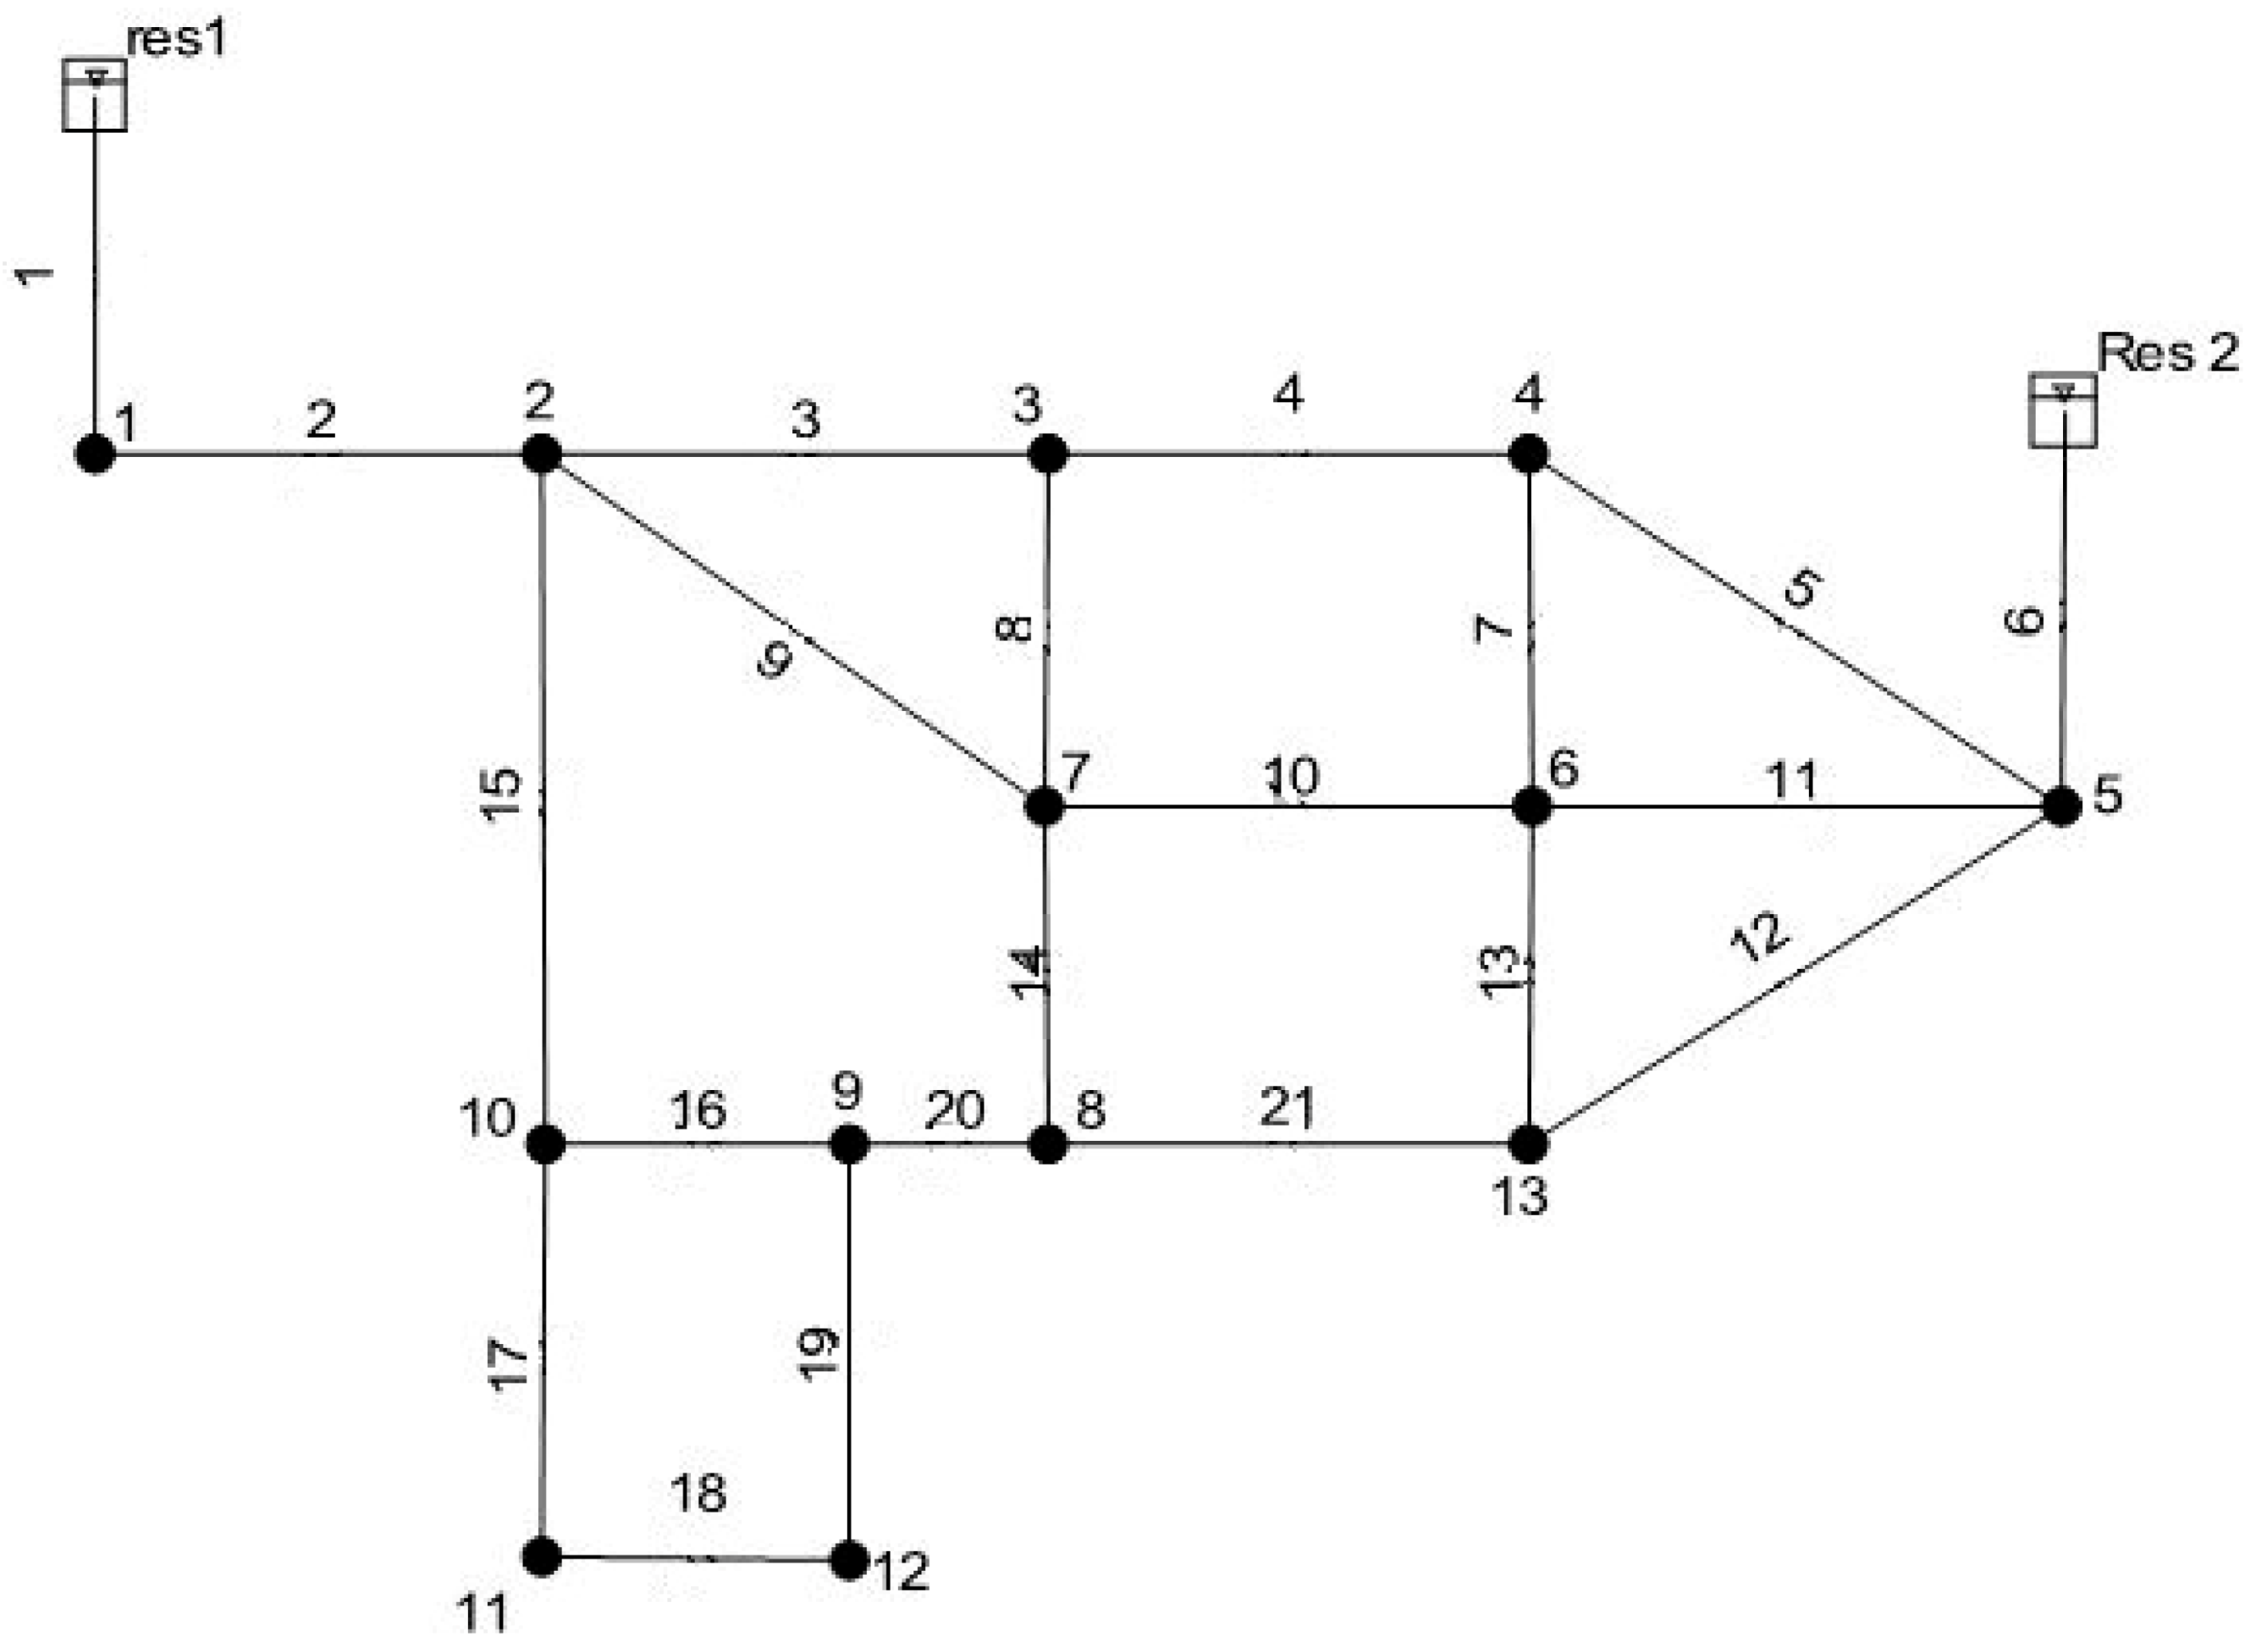
The second network analyzed [36] is shown in Figure 3, while pipe and node characteristics are described in Table 5 and Table 6.
The total network demand is 3146.4 m3/h, the hydraulic grade line elevation at each tank is set at 70 m and the minimum pressure head threshold is taken as 15 m for all junctions of the network.
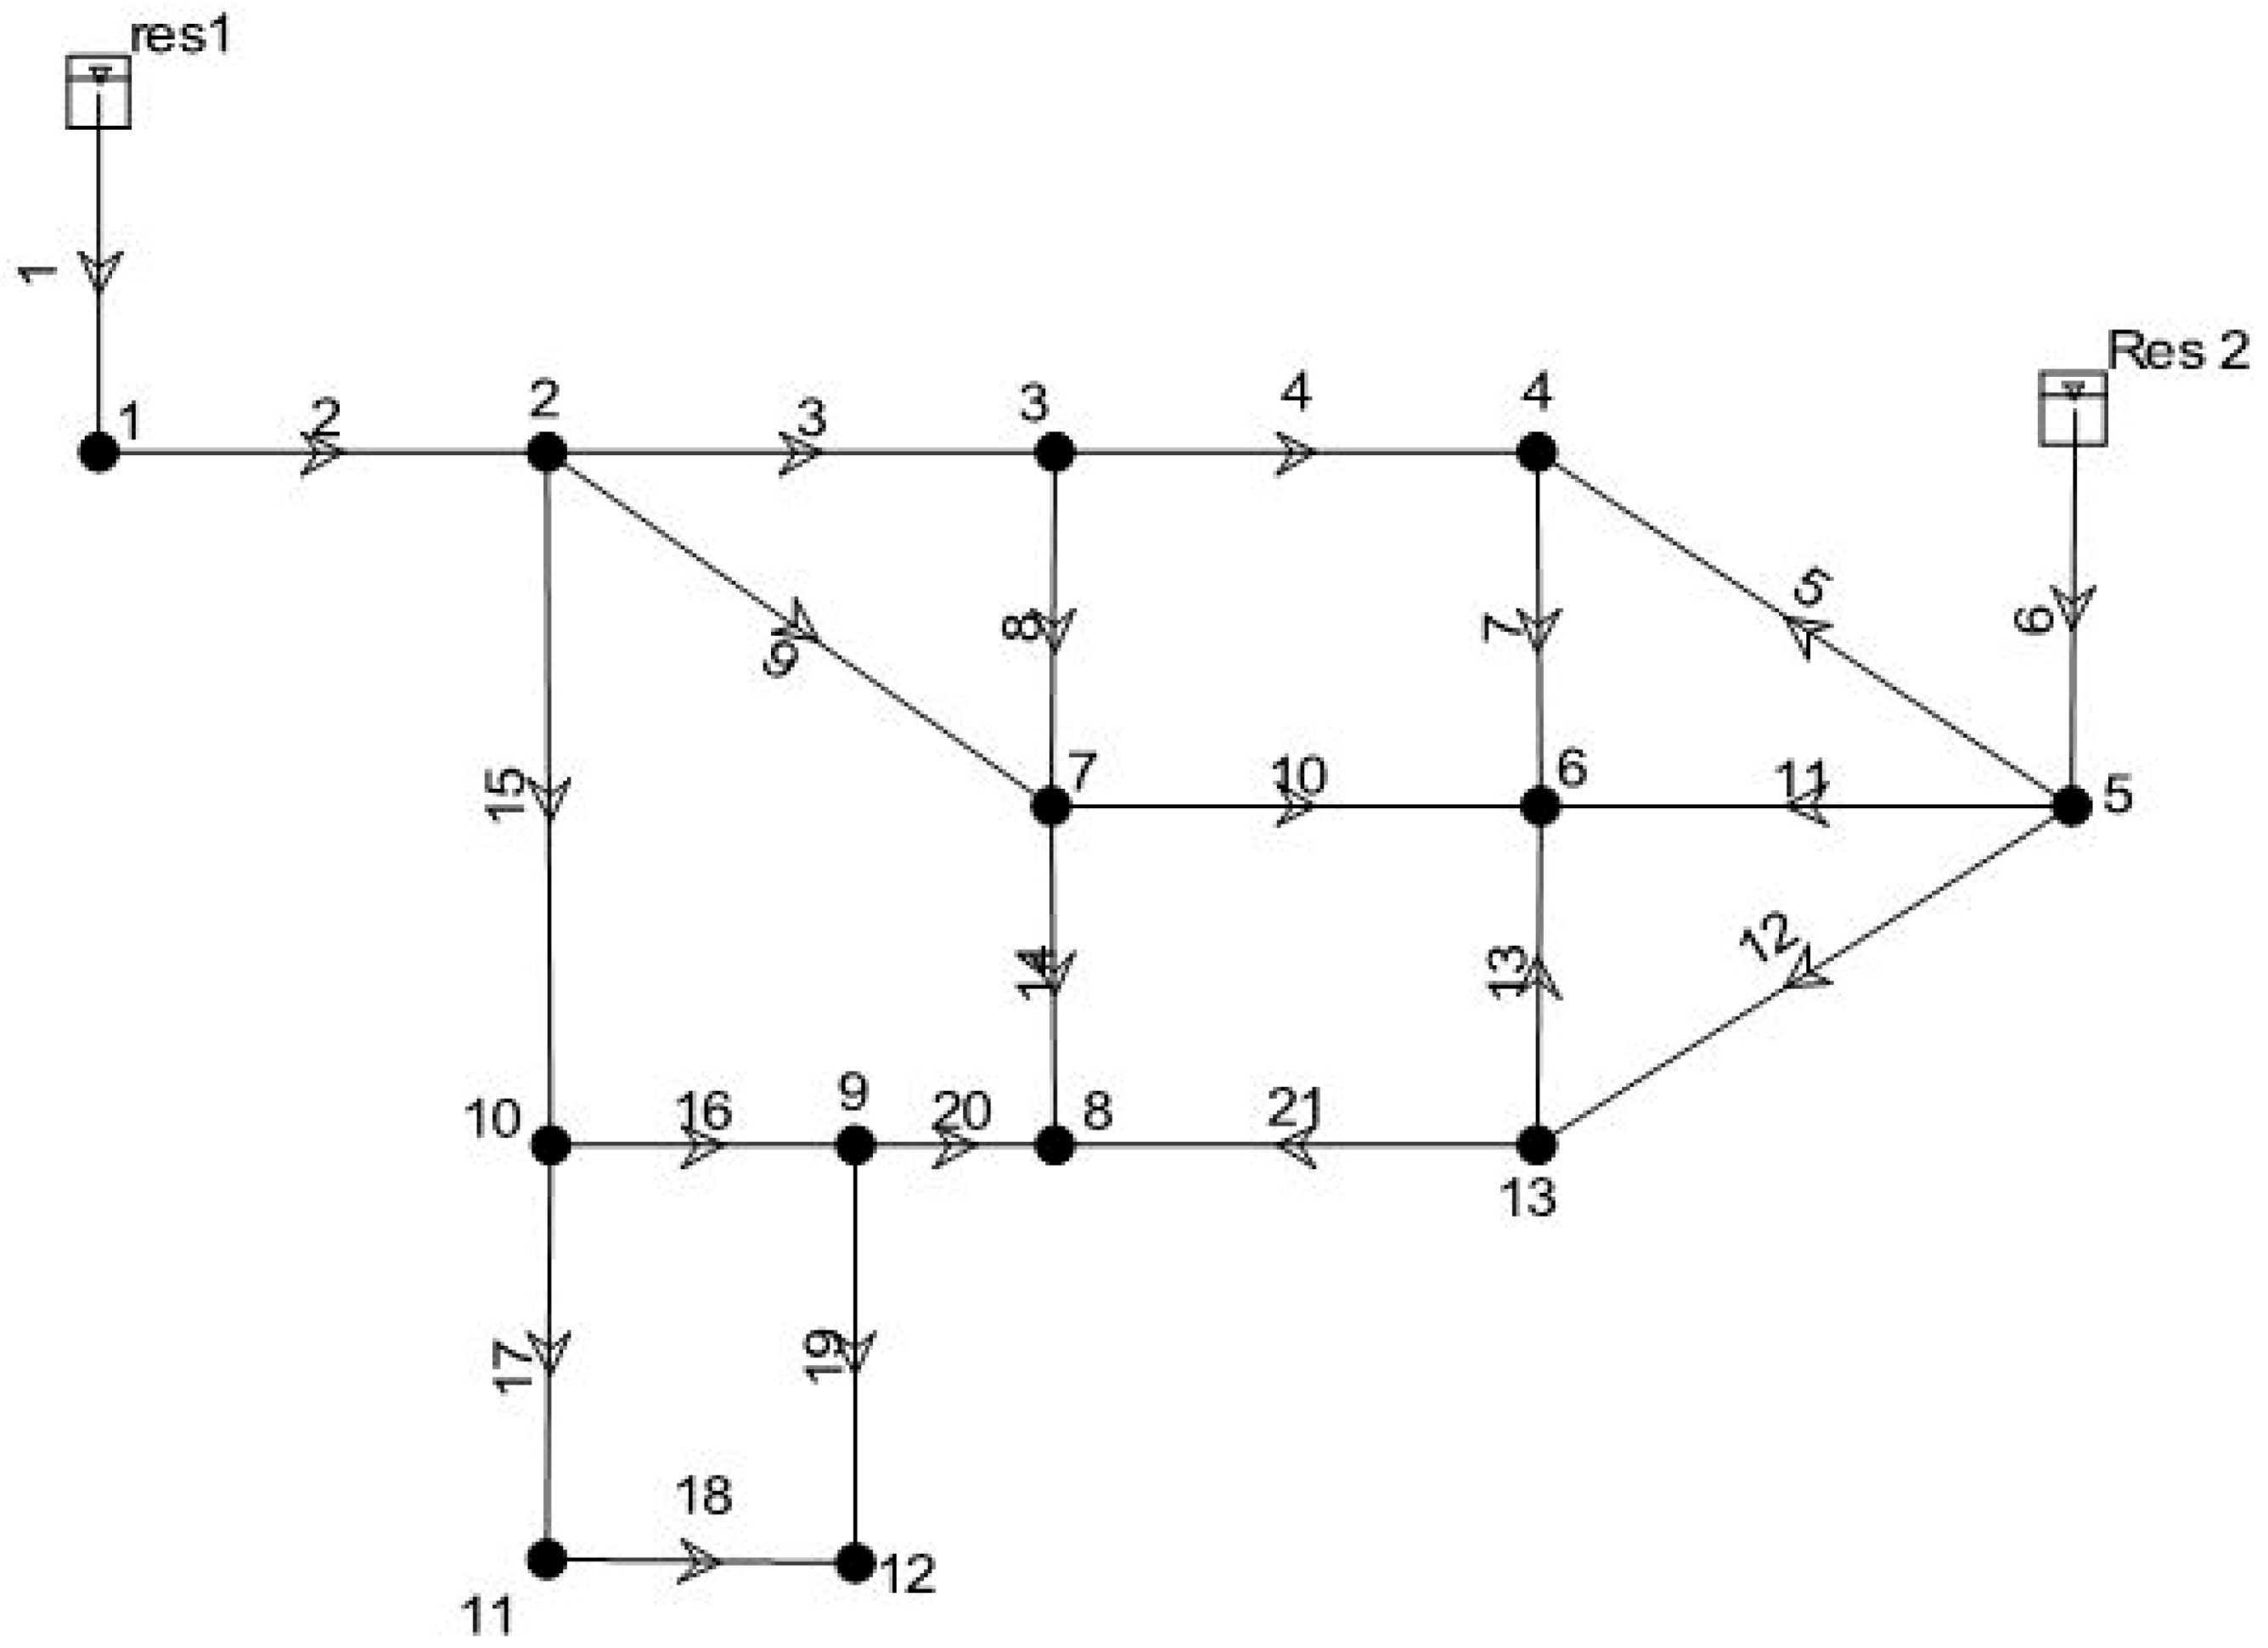
Similar to the first one, this network has been first analyzed in a condition of full function without pipe failures and under this condition the demand and the minimum pressure head threshold are satisfied for all the junctions. The results of the simulation are shown in Figure 4 and Table 7.
To test the proposed measure, comparisons with others indices has been made.
The first index considered is the Resilience Index Ir proposed by Todini [19]
where Pint is the amount of power dissipated internally in the network to satisfy the demands for all nodes while Pint,max is the maximum power that could be dissipated internally to satisfy the constraints in terms of nodal demands and the nodal heads.
Pint is defined as:
where is the specific weight of water, nn is the number of nodes of the network and Ptot is the total power available at the entrance of the network, expressed as:
where Qk is the flow delivered by the reservoir k and Hk is the head at the reservoir k and nr is the number of reservoirs of the network.
Pint,max is calculated as follows:
where is the minimum required head at node i.
After appropriate substitutions, the resilience index, for networks without pumps, can be expressed as:
The Resilience Index is a real number in the range [0,1] if the design requirements are fulfilled, but it may assume negative values for situations in which are not. The Resilience Index provides an overall evaluation of the reliability of a WDN and of the possibility to make changes in it; in particular, the index decreases as the network performance decreases.
Another considered index is that proposed by Prasad & Park [20]; this index stated that reliable loops can be ensured if the pipes connected to a node are not widely varying in diameter. The authors defined the pipe diameter uniformity, for each node, as the ratio of the average of the diameters of the pipes connected to a node to the maximum diameter at that node. The network resilience is thus defined as:
in which is the pipe diameter uniformity for node i.
Instead, Jayaram & Srinivasan [21] proposed a modified resilience index (), defined as the amount of surplus power available at the demand nodes in terms of percentage of the sum of the minimum required power at the demand nodes:
where nn is the number of nodes, Qjreq is the demand at node j, Hj is the head at node j and Hmin,j is the minimum required head at node j at which the nodal demands are to be supplied.
Another hydraulic performance index which has been also considered is the mean head surplus index, HS [39]:
In the above equation, n is the number of the nodes, Q*D,j is the demand at node j, Q is the total flow delivered by the network through demand nodes, Hj is the head at node j, and Hj* is the minimum required head at node j.
It should be noted that the evaluation of the vulnerability of WDNs (as well as the reliability) is not easy to calculate; generally, to do it indices such as those described above are used, which represents surrogate measures, even if they present some weaknesses. In this first phase of research activity, it has been preferred to use such indices to test the proposed measure. Future developments in research activity aim to make comparisons and evaluations considering approaches closer to the real vulnerability of the network.
3. Results and Discussion
In this study, the satisfaction of every node is regarded as the most important thing. As a second priority, if not every node can be served, it should be favored the setting in which the majority of nodes are satisfied. Obviously, if it is necessary to leave a node unsatisfied, it is preferred to serve the node which needs more water. To comply with these concepts, and after some experiments, the parameters α = 1/5 and β = 1/9 were chosen. The results for the Walski’s network [34,35] and for the network proposed by Ozger and Mays [36] are presented in Table 8 and Table 9.
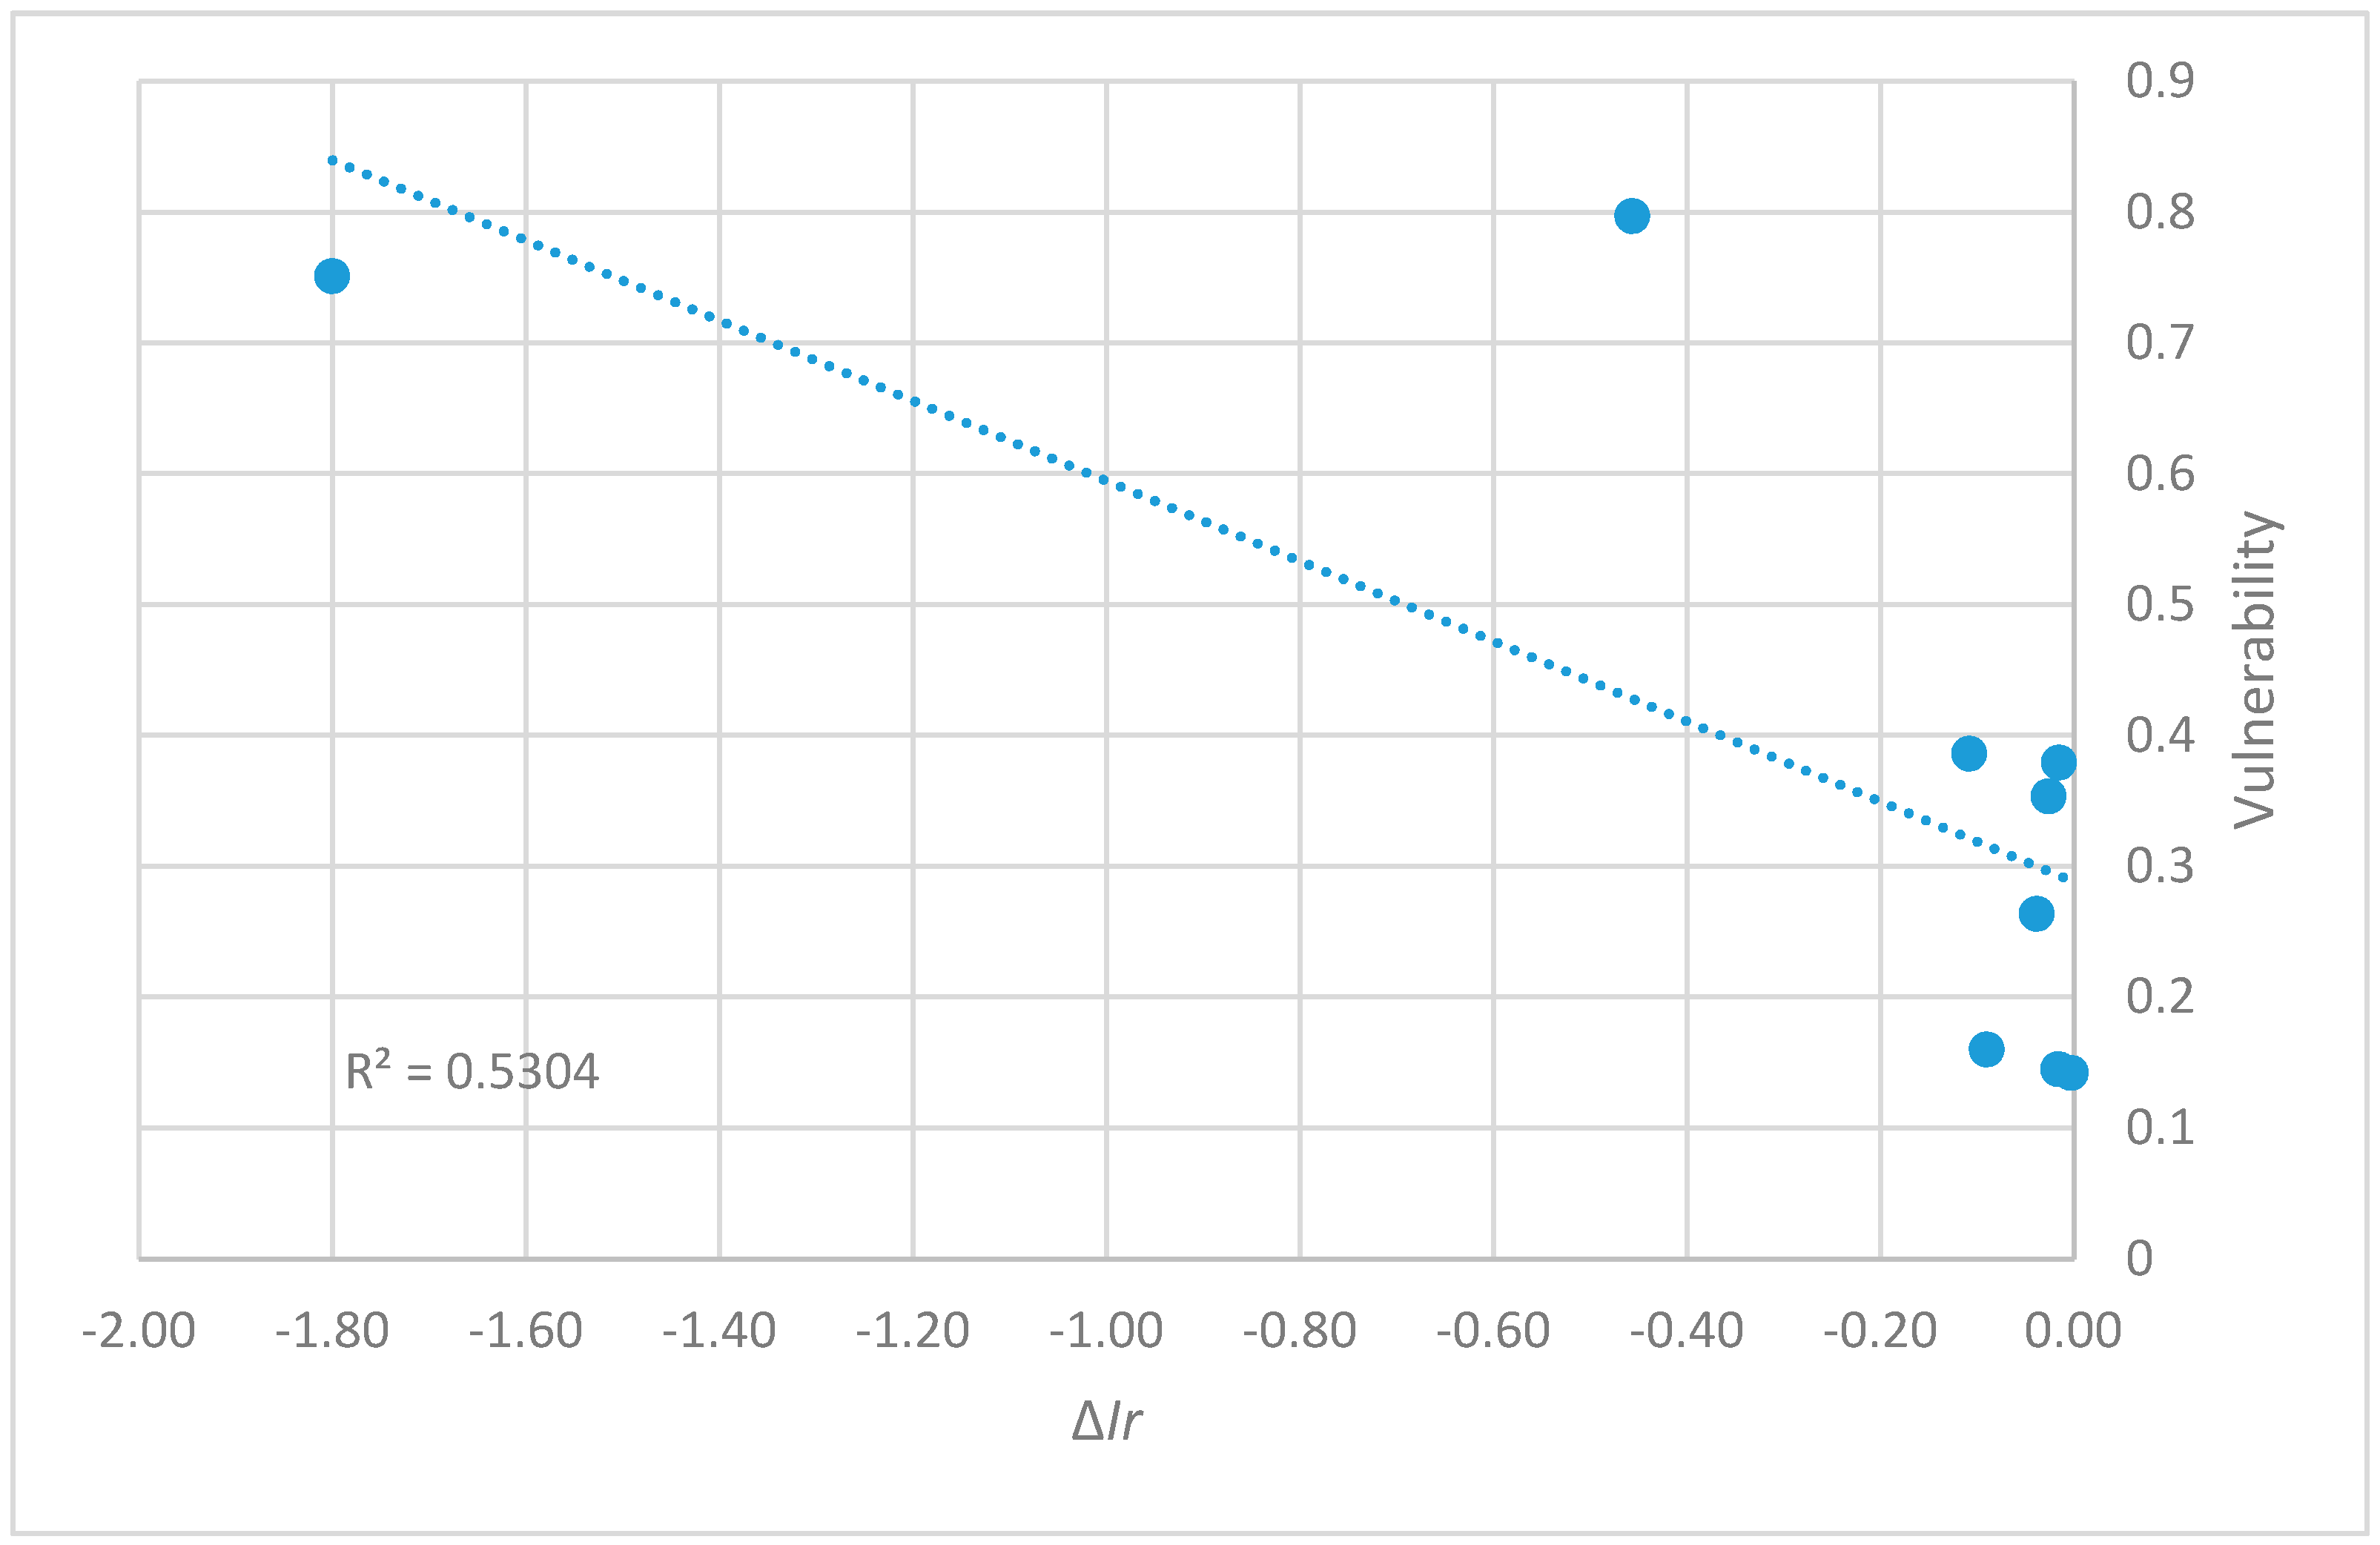
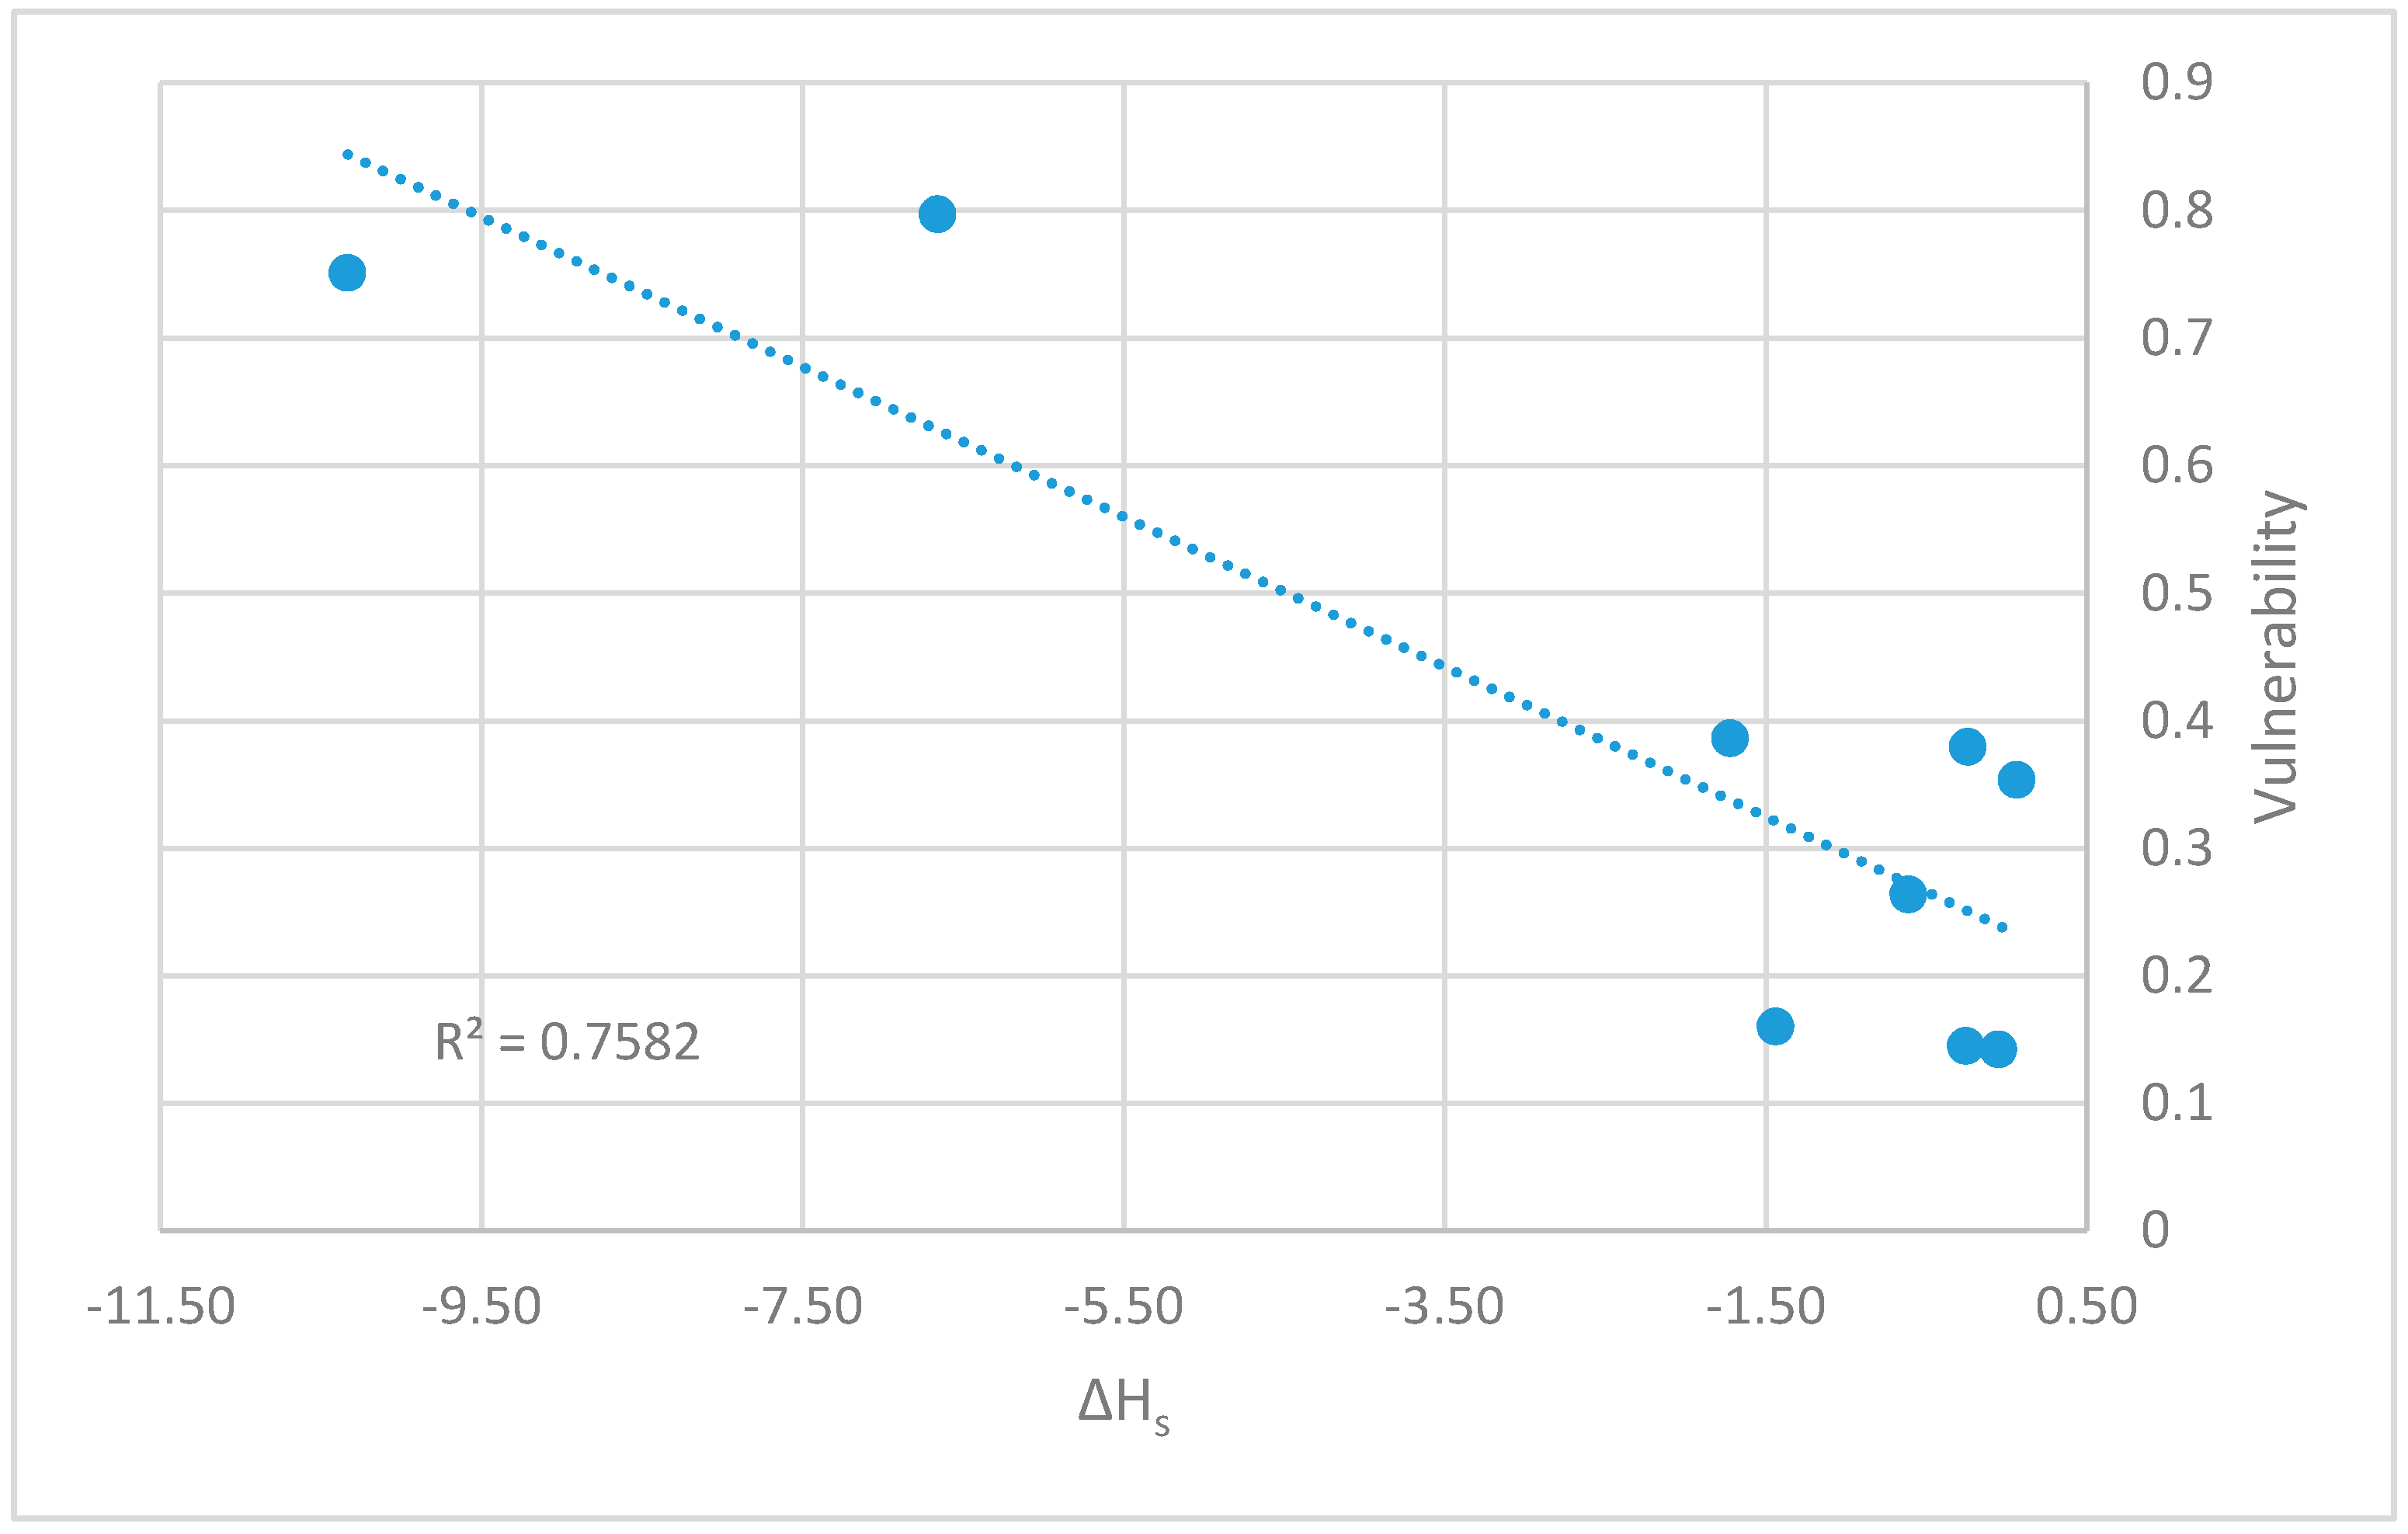
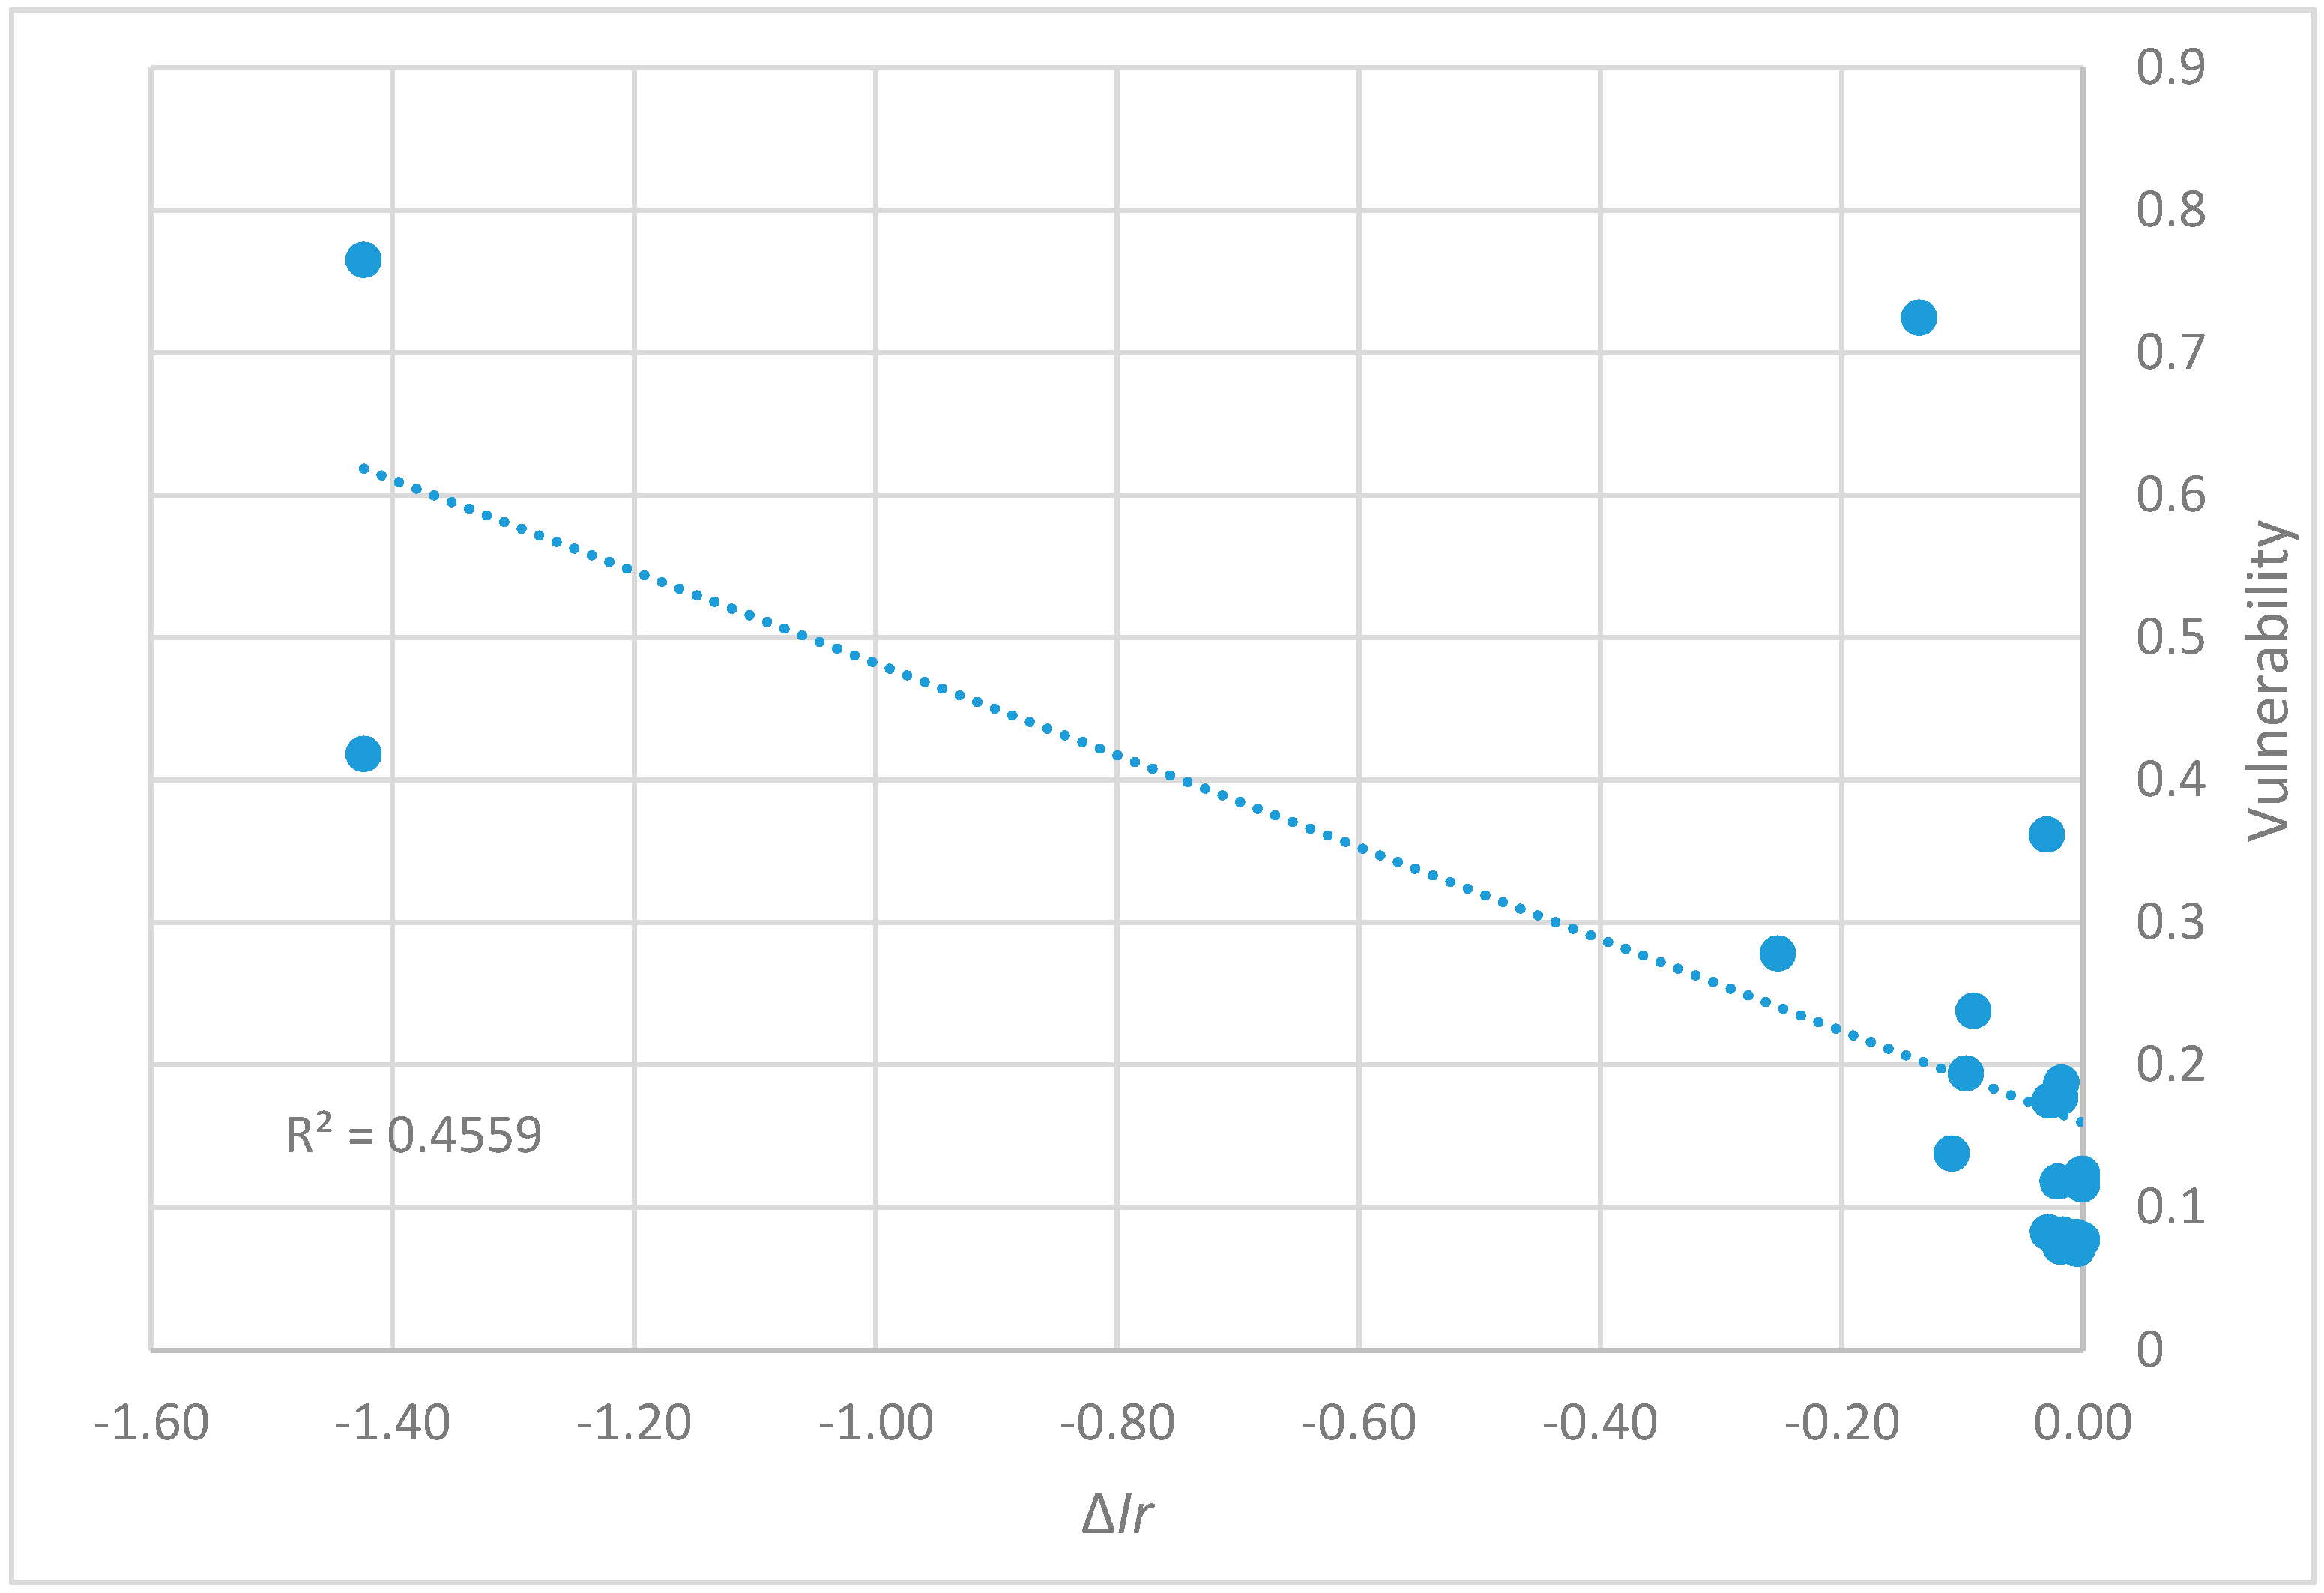
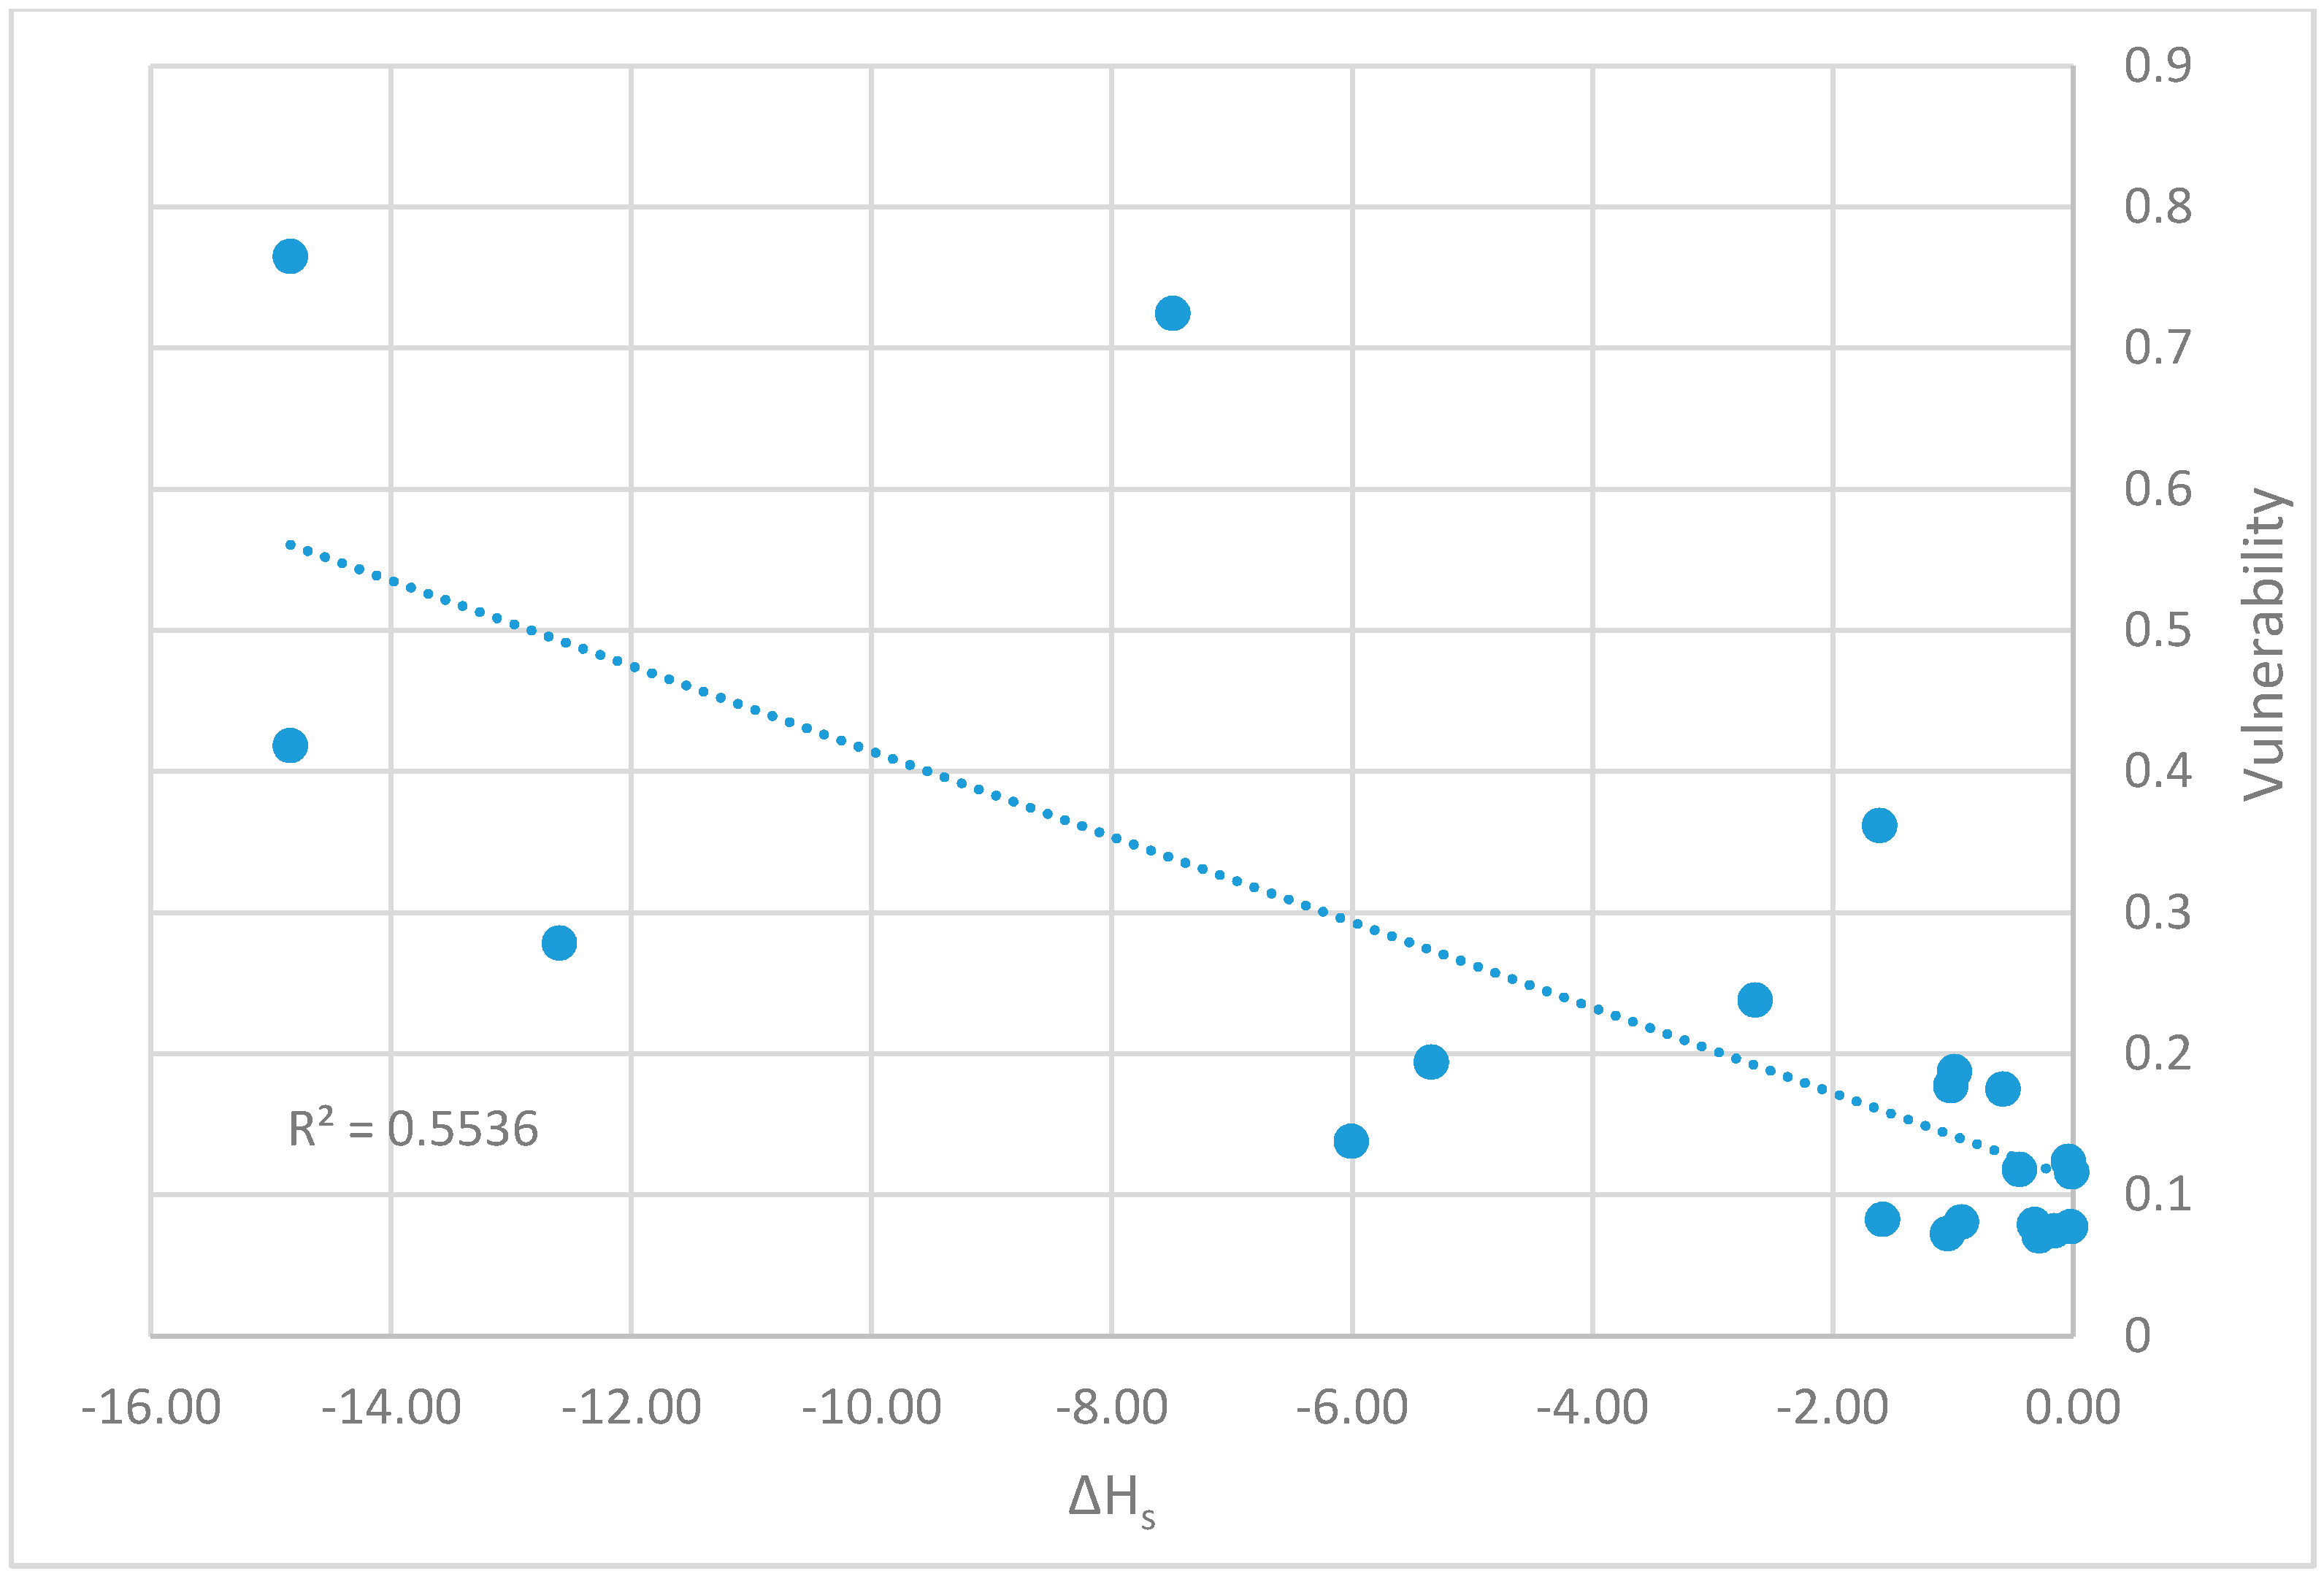
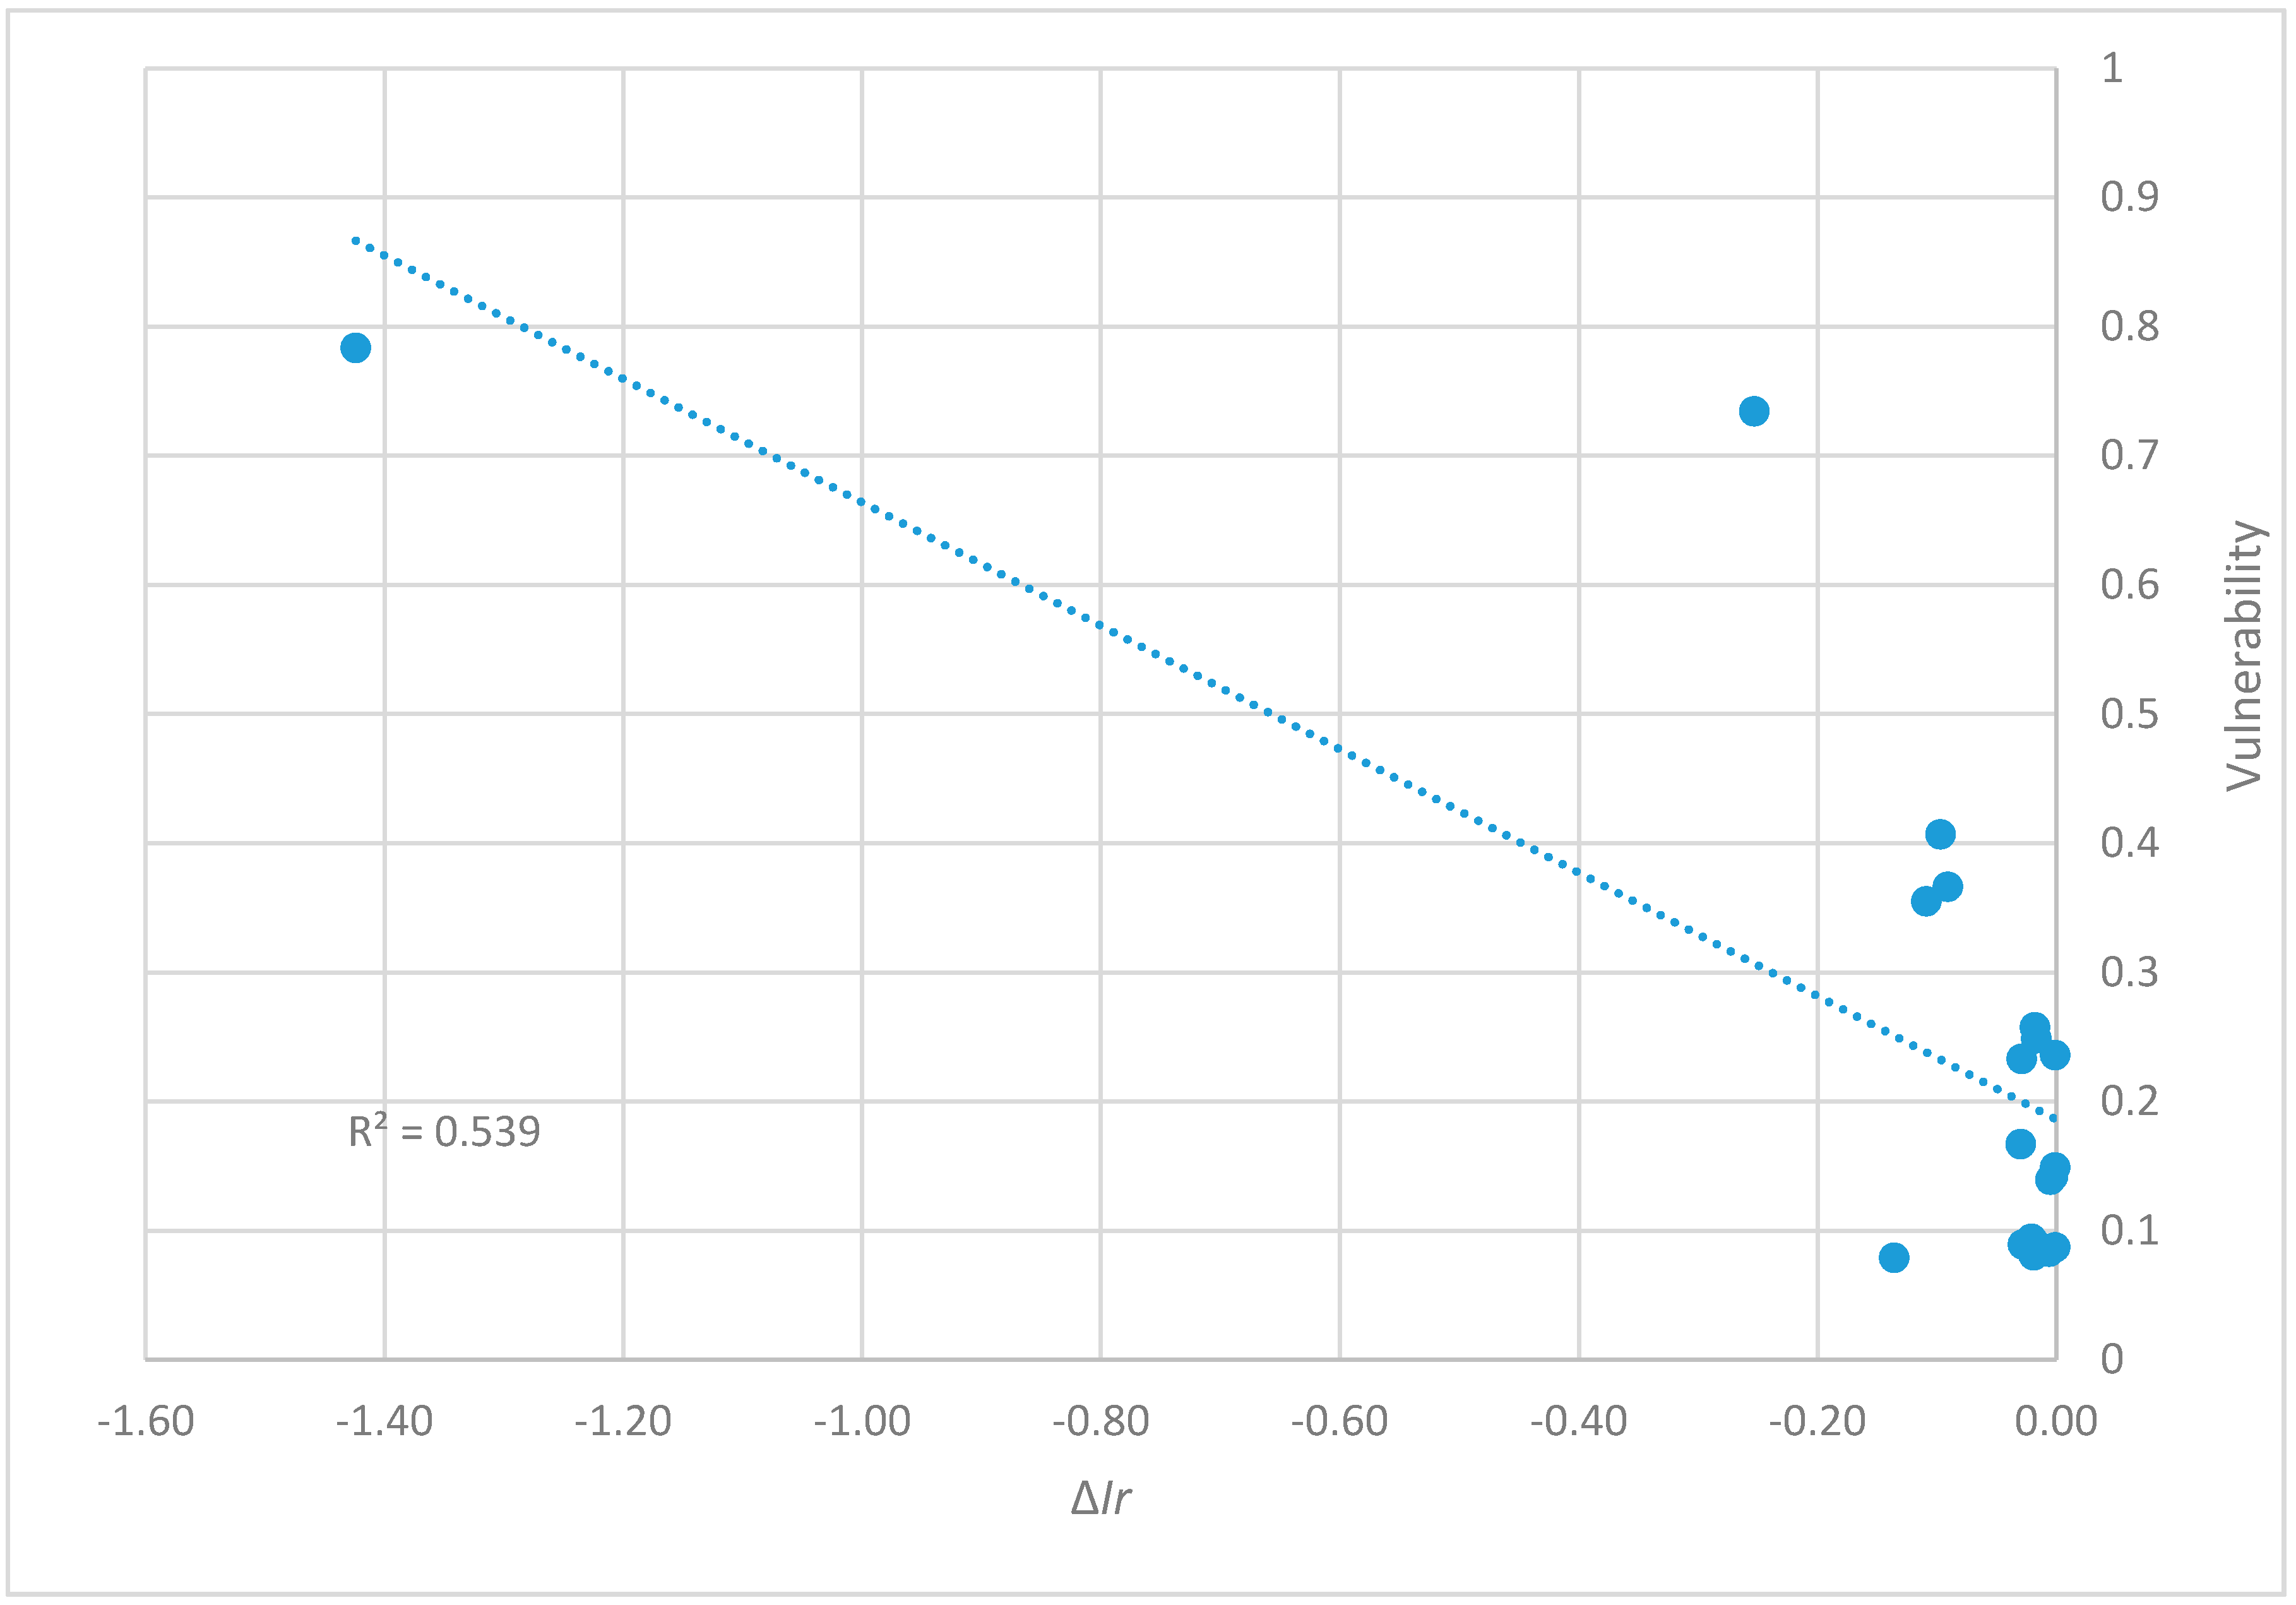
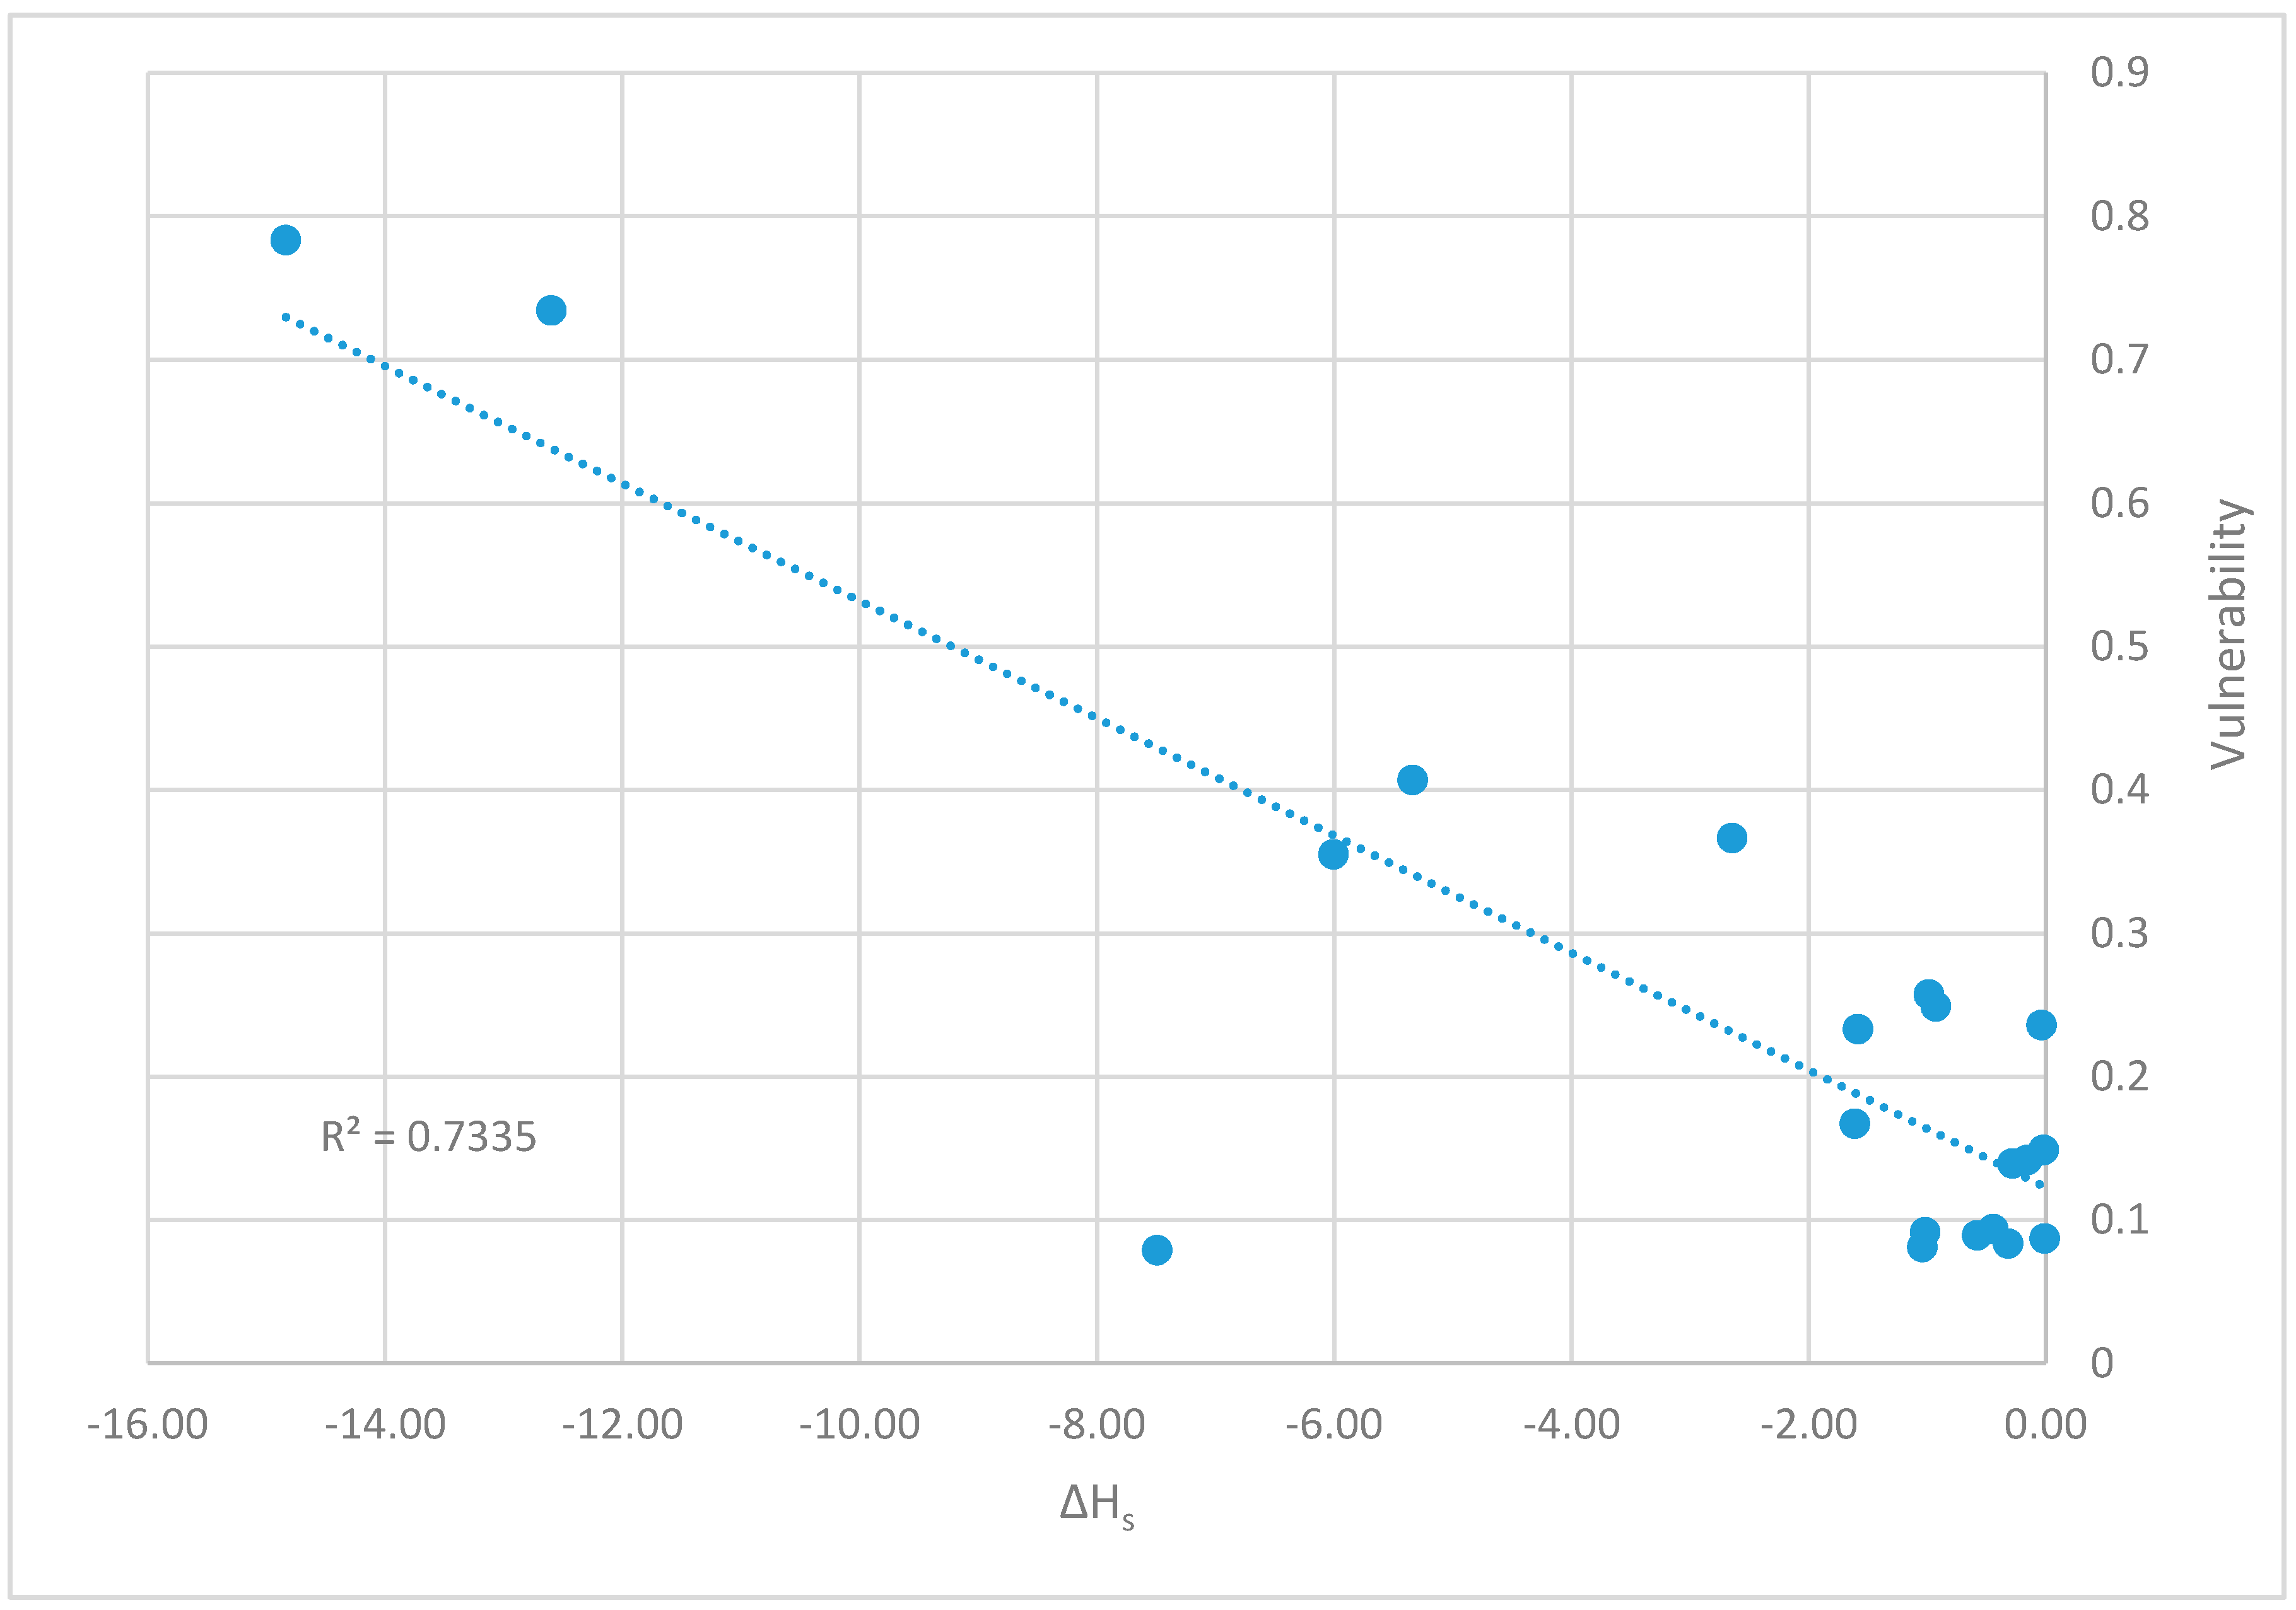
As previously mentioned, to test the proposed vulnerability measure, comparisons with others indices have been made. The indices have been computed for the two analyzed networks. First analysis has been made considering a condition of full function without pipe failures; then, a pipe at a time has been removed from the network and the indices have been computed again. This procedure has been repeated for every pipe to be able to compute the decrease in indices values. Table 10 and Table 11 show the results of these indices obtained for the network proposed by Walski [34,35] and the network proposed by Ozger and Mays [36], respectively. These decrease in values have been compared with the proposed vulnerability measure. The correlation between the measures is significant for both networks (see Figure 5, Figure 6, Figure 7 and Figure 8). Because of the almost perfect correlation among Ir, NRI and MIr, only the comparison between the proposed measure and the decrease in the values of Ir is reported.
The application of the vulnerability measure to the two WDNs has been conducted with the following aims:
- test the vulnerability measure to assess its applicability and the computational burden;
- demonstrate the usefulness of this measure for managers to identify the most vulnerable pipelines to carry out proper management and maintenance of the network; and
- bring out any critical issues or interesting aspects of possible future developments.
Regarding the first goal the application carried out to the two WDNs has demonstrated the feasibility of the measure and the computational burden were not excessive.
The main aim of the proposed vulnerability measure is to underline which pipes are essential to guarantee the satisfaction of every user in the network. The results obtained from the application allowed identifying which are the most vulnerable pipelines. It is easy to see that the vulnerability score completely agrees with the assumptions made, in fact, the most vulnerable pipes are the ones starting from the source node: they are the pipes with the highest water flow and if one of them is removed, many nodes remains completely unsatisfied.
It is worth noting that in Walski’s network pipe 6 is more vulnerable than pipe 1: this shows that the values for α and β were chosen correctly; in fact, the second pipe leads to one node only, while the first one carries a water flow needed to satisfy node 5 and all the water needed by node 4. The comparison between the values obtained from the measure of vulnerability and the decrease in value for the various considered indices shows a satisfactory degree of correlation as shown in Figure 5 and Figure 6. In the case of the Walski’s network, the correlation is about 0.45 for Ir, MIr, and NRI, while the value increase at about 0.73 for HS index.
For the Ozger and Mays network, the correlation is similar and equal to 0.45 for Ir, MIr, and NRI, and 0.55 for Hs.
The application did not highlight critical aspects but an interesting one emerged for the Ozger and Mays network, which has some nodes with zero demand. Interesting is the case of node 1, which in addition to a null demand, has only one incoming and one outgoing pipe. This condition makes the values obtained for the different indices for pipelines 1 and 2 equal. Moreover, from a geometrical point of view, the presence of node 1 is redundant. Therefore, the evaluation of the proposed measure has been performed anew on a modified Ozger and Mays network where the tank is directly linked to node 2.
The results obtained, shown in Figure 9 and Figure 10, led to better correlations, in line with the results obtained for Walski’s network which does not have the same condition (null demand for a node with one incoming and one outgoing pipe).
It should also be noted that the same approach cannot be applied for the other nodes with null demand (9, 10 and 13), since the elimination of these nodes, to which three pipes are connected each, would radically change the network topology. An interesting future work is therefore the possibility of associating an “equivalent graph” to a real WDN to better interpret particular topological situations such as the one previously described.
Table 12 shows pipe vulnerability values for modified Ozger and Mays network.
It is worth highlighting that many of the vulnerability measures found in the literature [40] have a global meaning and they consist of a score useful to compare different networks and tell which one is more vulnerable to a random failure. These kinds of measures can be considered when the goal is to find the best network among many possible ones, for example in a planning phase. If the studied network is real and already existing, usually, it is impossible or disadvantageous to replace completely the network with a brand new one. In these cases, it is suitable to have a vulnerability measure that gives a score to each part of the network, locally, to make feasible the comparison of the several components forming the network.
Regarding WDN the performance indices previously mentioned (see Table 1) use only a global approach and are representative of the global network functioning while the proposed vulnerability measure refers to the specific characteristics of the individual components defined to belong to the global system. In fact, the proposed measure considers the components of the network and evaluates the level of vulnerability of each pipe. It is also worth highlighting that the proposed measure is useful not only for the correct management and maintenance of the network but also in the design phase. In this phase, in fact, based on the most vulnerable pipelines, the proposed measure permits identifying topologically new pipelines to be inserted to make the network more reliable. Therefore, this measure could be a useful tool for water system managers, also considering the ease of use and the non-excessive computational burden.
4. Conclusions
WDN optimization, in both planning and management phases, is a topic of current interest. In the literature, there are different approaches and measures to evaluate the ability of a network to satisfy users with reference to the concepts of robustness, resilience and vulnerability. In this context, the present paper proposes a measure of vulnerability for WDNs, based on a topological approach, related to the ability to satisfy demand in conditions of pipeline failure.
In the context of the literature, the main features of the proposed index are:
- the consideration of the components of the network and the evaluation of the level of vulnerability of each pipe; and
- based on topological evaluations.
The results of the application carried out on two networks made it possible to evaluate the applicability of the measure. The comparison with some literature indices, which require hydraulic simulation of the network dynamics, showed a good correlation, especially considering that the used approach is totally topological based and does not require a large computational burden.
In particular, the application allowed identifying the most vulnerable pipelines without excessive computational burden. This confirmed the possibility of considering the index as an easy tool to be used by managers for the management and planning of interventions, in agreement with the aim of the research activity; the index can also be useful in the design phase, allowing to define optimization solutions through the identification of new pipelines to be built to make the network more reliable.
The obtained results are promising and can be seen as a starting point for a future development of a topological based vulnerability measure which takes into account peculiar scenarios such as a node with null demand that behaves exclusively as “redistributors” of water. For example, nodes with null demand having one incoming and one outgoing pipe, which emerged in the presented analysis, are redundant for the developed approach, and they can be replaced with a direct connection. A possible development for the proposed approach is to evaluate the possibility of replacing these nodes with appropriate connections, obtaining a sort of “equivalent graph” that maintains the structure of user nodes with a real demand.
Finally, the application made and the result obtained from the comparison with the different indices encourage the continuation of the research activity with the aim of making vulnerability analysis closer to the real vulnerability of the WDN.
Author Contributions
Conceptualization, Funding acquisition, and Supervision, M.M.; Formal analysis and Validation, D.P.; Methodology (definition of the mathematical structure aimed at hydraulic modeling), M.M. and D.P.; Methodology (definition of the basic mathematical structure), M.C., F.C., and A.P.; Software, F.C. and A.P.; Writing—original draft, D.P. and F.C., and G.C.; Writing—review and editing, M.M., D.P., and M.C.
Funding
The research was supported by Italian Regional Project (POR CALABRIA FESR-FSE 2014-2020 – Grant Number J48C17000170006)-Innovation and Competitiveness (I&C)-project: “origAMI—original Advanced Metering Infrastructure”.
Conflicts of Interest
The authors declare no conflict of interest.
References
- Di Nardo, A.; Di Natale, M. A heuristic design support methodology based on graph theory for district metering of water supply networks. Eng. Optimiz. 2011, 43, 193–211. [Google Scholar] [CrossRef]
- Di Nardo, A.; Di Natale, M.; Santonastaso, G.F.; Tzatchkov, V.G.; Alcocer-Yamanaka, V.H. Water network sectorization based on graph theory and energy performance indices. J. Water Resour. Plann. Manag. 2013, 140, 620–629. [Google Scholar] [CrossRef]
- Ferrari, G.; Savic, D.; Becciu, G. (Graph-theoretic approach and sound engineering principles for design of district metered areas. J. Water Resour. Plann. Manag. 2014, 140, 04014036. [Google Scholar] [CrossRef]
- Jafar, R.; Shahrour, I.; Juran, I. Application of Artificial Neural Networks (ANN) to model the failure of urban water mains. Math. Comput. Model. 2010, 51, 1170–1180. [Google Scholar] [CrossRef]
- Vasan, A.; Simonovic, S.P. Optimization of water distribution network design using differential evolution. J. Water Res. Plan. Manag. 2010, 136, 279–287. [Google Scholar] [CrossRef]
- Zheng, F.; Simpson, A.R.; Zecchin, A.C. A combined NLPdifferential evolution algorithm approach for the optimization of looped water distribution systems. Water Resour. Res. 2011, 47. [Google Scholar] [CrossRef]
- D’Ambrosio, C.; Lodi, A.; Wiese, S.; Bragalli, C. Mathematical programming techniques in water network optimization. Eur. J. Oper. Res. 2015, 243, 774–788. [Google Scholar] [CrossRef]
- Carini, M.; Maiolo, M.; Pantusa, D.; Chiaravalloti, F.; Capano, G. Modelling and optimization of least-cost water distribution networks with multiple supply sources and user. Ric. Mater. 2017, 1–15. [Google Scholar] [CrossRef]
- Maiolo, M.; Mendicino, G.; Pantusa, D.; Senatore, A. Optimization of Drinking Water Distribution Systems in Relation to the Effects of Climate Change. Water 2017, 9, 803. [Google Scholar] [CrossRef]
- Maiolo, M.; Pantusa, D. Combined reuse of wastewater and desalination for the management of water systems in conditions of scarcity. Water Ecol. 2017, 72, 116–126. [Google Scholar] [CrossRef]
- Maiolo, M.; Pantusa, D. Infrastructure Vulnerability Index of drinking water systems to terrorist attacks. Cog. Eng. 2018, 5, 1–21. [Google Scholar] [CrossRef]
- Agathokleous, A.; Christodoulou, C.; Christodoulou, S.E. Topological Robustness and Vulnerability Assessment of Water Distribution Networks. Water Resour. Manag. 2017, 31, 4007–4021. [Google Scholar] [CrossRef]
- Ostfeld, A. Reliability analysis of water distribution systems. J. Hydroinform. 2004, 6, 281–294. [Google Scholar] [CrossRef] [Green Version]
- Gheisi, A.; Forsyth, M.; Naser, G. Water distribution systems reliability: A review of research literature. J. Water Resour. Plan. Manag. 2016, 142, 04016047. [Google Scholar] [CrossRef]
- Shin, S.; Lee, S.; Judi, D.R.; Parvania, M.; Goharian, E.; McPerson, T.; Burian, S.J. A Systematic Review of Quantitative Resilience Measures for Water Infrastructure Systems. Water 2018, 10, 164. [Google Scholar] [CrossRef]
- Tanyimboh, T.T.; Templeman, A.B. Calculating Maximum Entropy Flows in Networks. J. Oper. Res. Soc. 1993, 44, 383–396. [Google Scholar] [CrossRef]
- Tanyimboh, T.T.; Templeman, A.B. A quantified assessment of the relationship between the reliability and entropy of water distribution systems. Eng. Opt. 2000, 33, 179–199. [Google Scholar] [CrossRef]
- Setiadi, Y.; Tanyimboh, T.T.; Templeman, A.B. Modelling errors, entropy and the hydraulic reliability of water distribution systems. Adv. Eng. Softw. 2005, 36, 780–788. [Google Scholar] [CrossRef]
- Todini, E. Looped water distribution networks design using a resilience index based heuristic approach. Urban Water J. 2000, 2, 115–122. [Google Scholar] [CrossRef]
- Prasad, T.D.; Park, N.S. Multiobjective genetic algorithms for design of water distribution networks. J. Water Resour. Plann. Manag. 2004, 130, 73–82. [Google Scholar] [CrossRef]
- Jayaram, N.; Srinivasan, K. Performance-based optimal design and rehabilitation of water distribution networks using life cycle costing. Water Resour. Res. 2008, 44, W01417. [Google Scholar] [CrossRef]
- Zhuang, B.; Lansey, K.; Kang, D. Resilience/availability analysis of municipal water distribution system incorporating adaptive pump operation. J. Hydraul. Eng. 2013, 139, 527–537. [Google Scholar] [CrossRef]
- Jung, D.; Kang, D.; Kim, J.H.; Lansey, K. Robustness-based design of water distribution systems. J. Water Resour. Plan. Manag. 2014, 140, 04014033. [Google Scholar] [CrossRef]
- Wright, R.; Herrera, M.; Parpas, P.; Stoianov, I. Hydraulic resilience index for the critical link analysis of multi-feed water distribution networks. Procedia Eng. 2015, 119, 1249–1258. [Google Scholar] [CrossRef]
- Cimellaro, G.P.; Tinebra, A.; Renschler, C.; Fragiadakis, M. New resilience index for urban water distribution networks. J. Struct. Eng. 2015, 142, C4015014. [Google Scholar] [CrossRef]
- Pinto, J.; Varum, H.; Bentes, I.; Agarwal, J. A Theory of Vulnerability of Water Pipe Network (TVWPN). Water Resour. Manag. 2010, 24, 4237–4254. [Google Scholar] [CrossRef]
- Yazdani, A.; Jeffrey, P. Complex network analysis of water distribution systems. Chaos 2011, 21, 016111. [Google Scholar] [CrossRef] [PubMed]
- Shuang, Q.; Zhang, M.; Yuan, Y. Node vulnerability of water distribution networks under cascading failures. Reliab. Eng. Syst. Saf. 2014, 124, 132–141. [Google Scholar] [CrossRef]
- Pandit, A.; Crittenden, J.C. Index of network resilience for urban water distribution systems. Int. J. Crit. Infrastruct. 2016, 12, 120–142. [Google Scholar] [CrossRef]
- Herrera, M.; Abraham, E.; Stoianov, I. A Graph-Theoretic Framework for Assessing the Resilience of Sectorised Water Distribution Networks. Water Resour. Manag. 2016, 30, 1685–1699. [Google Scholar] [CrossRef] [Green Version]
- Yazdani, A.; Jeffrey, P. Applying network theory to quantify the redundancy and structural robustness of water distribution systems. J. Water Res. Plan. Manag. 2012, 138, 153–161. [Google Scholar] [CrossRef]
- Yazdani, A.; Jeffrey, P. Water distribution system vulnerability analysis using weighted and directed network models. Water Resour. Res. 2012, 48, W06517. [Google Scholar] [CrossRef]
- Jung, D.; Kim, J.H. Water Distribution System Design to Minimize Costs and Maximize Topological and Hydraulic Reliability. J. Water Res. Plan. Manag. 2018, 144, 06018005. [Google Scholar] [CrossRef]
- Walski, T.M. Technique for calibrating network models. J. Water Resour. Plan. Manag. 1983, 109, 360–372. [Google Scholar] [CrossRef]
- Walski, T.M. Case study: Pipe network model calibration issues. J. Water Resour. Plan. Manag. 1986, 112, 238–249. [Google Scholar] [CrossRef]
- Ozger, S.S.; Mays, L.W. A Semi-Pressure-Driven Approach to Reliability Assessment of Water Distribution Networks. Ph.D. Thesis, Arizona State University, Tempe, AZ, USA, January 2003. [Google Scholar]
- Walski, T.M.; Chase, D.V.; Savic, D.A.; Grayman, W.; Beckwith, S.; Koelle, E. Advanced Water Distribution Modeling and Management; HAESTAD Press: Waterbury, CT, USA, 2003. [Google Scholar]
- Hashimoto, T.; Stedinger, J.R.; Loucks, D.P. Reliability, resiliency and vulnerability criteria for water resource system performance evaluation. Water Resour. Res. 1982, 18, 14–20. [Google Scholar] [CrossRef]
- Greco, R.; Di Nardo, A.; Santonastaso, G. Resilience and entropy as indices of robustness of water distribution networks. J. Hydroinform. 2012, 14, 761–771. [Google Scholar] [CrossRef] [Green Version]
- Kanwar, K.; Kumar, H.; Kaushal, S. A Metric to Compare Vulnerability of the Graphs of Different Sizes. Electron. Notes Discret. Math. 2017, 63, 525–533. [Google Scholar] [CrossRef]
Figure 1.
Walski’s network.

Figure 2.
Results of simulation for Walski’s network.

Figure 3.
Network proposed by Ozger and Mays.

Figure 4.
Results of simulation for the network proposed by Ozger and Mays.

Figure 5.
Correlation between vulnerability measure and the decrease in the Ir values in Walski’s network.
Figure 5.
Correlation between vulnerability measure and the decrease in the Ir values in Walski’s network.

Figure 6.
Correlation between vulnerability measure and the decrease in the HS values in Walski’s network.
Figure 6.
Correlation between vulnerability measure and the decrease in the HS values in Walski’s network.

Figure 7.
Correlation between vulnerability measure and the decrease in the Ir values in Ozger and Mays network.
Figure 7.
Correlation between vulnerability measure and the decrease in the Ir values in Ozger and Mays network.

Figure 8.
Correlation between vulnerability measure and the decrease in the HS values in Ozger and Mays network.
Figure 8.
Correlation between vulnerability measure and the decrease in the HS values in Ozger and Mays network.

Figure 9.
Correlation between vulnerability measure and the decrease in the Ir values in the modified Ozger and Mays network.
Figure 9.
Correlation between vulnerability measure and the decrease in the Ir values in the modified Ozger and Mays network.

Figure 10.
Correlation between vulnerability measure and the decrease in the HS values in the modified Ozger and Mays network.
Figure 10.
Correlation between vulnerability measure and the decrease in the HS values in the modified Ozger and Mays network.


Table 1.
Literature summary.
| References | Indices | Analysis Type |
|---|---|---|
| Tanyimboh and Templeman [16] | Entropy as surrogate for reliability | Entropy approach |
| Tanyimboh and Templeman [17] | Entropy/Reliability | Entropy approach |
| Setiadi et al. [18] | Entropy/Reliability | Entropy approach |
| Todini [19] | Resilience | Hydraulic approach |
| Prasad and Park [20] | Resilience | Hydraulic approach |
| Jayaram and Srinivasan [21] | Resilience | Hydraulic approach |
| Zhuang et al. [22] | Resilience | Hydraulic approach |
| Jung et al. [23] | Robustness | Hydraulic approach |
| Wright et al. [24] | Resilience | Hydraulic approach |
| Cimellaro et al. [25] | Resilience | Hydraulic approach |
| Pinto et al. [26] | Vulnerability | Topological approach |
| Yazdani and Jeffrey [27] | Vulnerability and robustness | Topological approach |
| Shuang et al. [28] | Vulnerability | Topological approach |
| Agathokleos et al. [12] | Vulnerability and robustness | Topological approach |
| Pandit and Crittenden [29] | Resilience | Topological approach |
| Herrera et al. [30] | Resilience | Topological approach |
Table 2.
Pipe characteristics of Walski’s network.
| Pipe ID | Length (m) | D (mm) | C (H–W) |
|---|---|---|---|
| 1 | 304.8 | 203.2 | 90 |
| 2 | 609.6 | 304.8 | 110 |
| 3 | 609.6 | 304.8 | 110 |
| 4 | 304.8 | 304.8 | 110 |
| 5 | 457.2 | 304.8 | 120 |
| 6 | 152.4 | 203.2 | 120 |
| 7 | 914.4 | 254.0 | 110 |
| 8 | 762.0 | 406.4 | 130 |
| 9 | 609.6 | 304.8 | 110 |
Table 3.
Node characteristics of Walski’s network.
| Node ID | Elevation (m) | Demand (l/s) |
|---|---|---|
| 1 | 0 | 25.2 |
| 2 | 0 | 63.1 |
| 3 | 0 | 94.6 |
| 4 | 0 | 31.5 |
| 5 | 0 | 31.5 |
| 6 | 0 | 126.2 |
Table 4.
Flow values for the simulation in full function condition without pipe failures for Walski’s network.
Table 4.
Flow values for the simulation in full function condition without pipe failures for Walski’s network.
| Pipe ID | Flow (CMH) |
|---|---|
| 1 | 25.2 |
| 2 | 20.1 |
| 3 | 11.9 |
| 4 | 43.5 |
| 5 | 62.6 |
| 6 | 27.7 |
| 7 | 47.3 |
| 8 | 216.5 |
| 9 | 108.4 |
Table 5.
Pipe characteristics of network proposed by Ozger and Mays.
| Pipe ID | Length (m) | D (mm) | C (H–W) |
|---|---|---|---|
| 1 | 609.60 | 762 | 130 |
| 2 | 243.80 | 762 | 128 |
| 3 | 1524.00 | 609 | 126 |
| 4 | 1127.76 | 609 | 124 |
| 5 | 1188.72 | 406 | 122 |
| 6 | 640.08 | 406 | 120 |
| 7 | 762.00 | 254 | 118 |
| 8 | 944.88 | 254 | 116 |
| 9 | 1676.40 | 381 | 114 |
| 10 | 883.92 | 305 | 112 |
| 11 | 883.92 | 305 | 110 |
| 12 | 1371.60 | 381 | 108 |
| 13 | 762.00 | 254 | 106 |
| 14 | 822.96 | 254 | 104 |
| 15 | 944.88 | 305 | 102 |
| 16 | 579.00 | 305 | 100 |
| 17 | 487.68 | 203 | 98 |
| 18 | 457.20 | 152 | 96 |
| 19 | 502.92 | 203 | 94 |
| 20 | 883.92 | 203 | 92 |
| 21 | 944.88 | 305 | 90 |
Table 6.
Node characteristics of network proposed by Ozger and Mays.
| Node ID | Elevation (m) | Demand (CMH) |
|---|---|---|
| 1 | 27.43 | 0 |
| 2 | 33.53 | 212.4 |
| 3 | 28.96 | 212.4 |
| 4 | 32.00 | 640.8 |
| 5 | 30.48 | 212.4 |
| 6 | 31.39 | 684.0 |
| 7 | 29.56 | 640.8 |
| 8 | 31.39 | 327.6 |
| 9 | 32.61 | 0 |
| 10 | 34.14 | 0 |
| 11 | 35.05 | 108.0 |
| 12 | 36.58 | 108.0 |
| 13 | 33.53 | 0 |
Table 7.
Flow values for the simulation in full function condition without pipe failures for the Ozger and Mays network.
Table 7.
Flow values for the simulation in full function condition without pipe failures for the Ozger and Mays network.
| Pipe ID | Flow (CMH) |
|---|---|
| 1 | 2253.3 |
| 2 | 2253.3 |
| 3 | 1211.9 |
| 4 | 791.1 |
| 5 | 66.4 |
| 6 | 893.1 |
| 7 | 216.7 |
| 8 | 208.4 |
| 9 | 545.2 |
| 10 | 37 |
| 11 | 304.4 |
| 12 | 309.9 |
| 13 | 125.9 |
| 14 | 75.5 |
| 15 | 283.9 |
| 16 | 164.8 |
| 17 | 119.1 |
| 18 | 11.1 |
| 19 | 96.9 |
| 20 | 67.9 |
| 21 | 184.0 |
Table 8.
Pipe vulnerability values for Walski’s network.
| Pipe ID | Vulnerability Measure |
|---|---|
| 8 | 0.7969 |
| 9 | 0.7510 |
| 7 | 0.3861 |
| 6 | 0.3792 |
| 1 | 0.3534 |
| 4 | 0.2637 |
| 5 | 0.1600 |
| 2 | 0.1449 |
| 3 | 0.1420 |
Table 9.
Pipe vulnerability values for Ozger and Mays network.
| Pipe ID | Vulnerability Measure |
|---|---|
| 1 | 0.7648 |
| 6 | 0.7243 |
| 2 | 0.4181 |
| 12 | 0.3615 |
| 3 | 0.2782 |
| 15 | 0.2378 |
| 9 | 0.1938 |
| 8 | 0.1872 |
| 16 | 0.1771 |
| 17 | 0.1748 |
| 4 | 0.1377 |
| 5 | 0.1235 |
| 19 | 0.1180 |
| 18 | 0.1161 |
| 11 | 0.0825 |
| 7 | 0.0807 |
| 13 | 0.0790 |
| 10 | 0.0772 |
| 14 | 0.0744 |
| 21 | 0.0724 |
| 20 | 0.0707 |
Table 10.
Values of the indices obtained for the Walski’s network.
| Condition | Ir | NRI | MIr | Hs |
|---|---|---|---|---|
| No pipe failures | 0.650 | 0.153 | 22.967 | 10.335 |
| Failure pipe 1 | 0.624 | 0.509 | 16.330 | 10.400 |
| Failure pipe 2 | 0.634 | 0.555 | 22.408 | 10.084 |
| Failure pipe 3 | 0.647 | 0.566 | 22.860 | 10.287 |
| Failure pipe 4 | 0.612 | 0.530 | 21.609 | 9.724 |
| Failure pipe 5 | 0.560 | 0.477 | 19.771 | 8.897 |
| Failure pipe 6 | 0.635 | 0.553 | 22.435 | 10.096 |
| Failure pipe 7 | 0.542 | 0.472 | 19.141 | 8.614 |
| Failure pipe 8 | −1.150 | −1.005 | −40.643 | 0.000 |
| Failure pipe 9 | 0.194 | 0.153 | 6.844 | 3.676 |
Table 11.
Values of the indices obtained for the Ozger and Mays network.
| Condition | Ir | NRI | MIr | HS |
|---|---|---|---|---|
| No pipe failures | 0.269 | 0.214 | 98.504 | 14.838 |
| Failure pipe 1 | −1.155 | −0.923 | −423.644 | 0.000 |
| Failure pipe 2 | −1.155 | −0.923 | −423.657 | 0.000 |
| Failure pipe 3 | 0.016 | 0.011 | 5.743 | 2.239 |
| Failure pipe 4 | 0.160 | 0.127 | 58.546 | 8.830 |
| Failure pipe 5 | 0.268 | 0.214 | 98.294 | 14.799 |
| Failure pipe 6 | 0.133 | 0.104 | 48.665 | 7.345 |
| Failure pipe 7 | 0.252 | 0.200 | 92.320 | 13.907 |
| Failure pipe 8 | 0.251 | 0.199 | 91.932 | 13.849 |
| Failure pipe 9 | 0.172 | 0.136 | 62.979 | 9.497 |
| Failure pipe 10 | 0.268 | 0.214 | 98.373 | 14.816 |
| Failure pipe 11 | 0.240 | 0.191 | 87.965 | 13.251 |
| Failure pipe 12 | 0.239 | 0.190 | 87.805 | 13.226 |
| Failure pipe 13 | 0.263 | 0.209 | 96.384 | 14.516 |
| Failure pipe 14 | 0.266 | 0.211 | 97.473 | 14.680 |
| Failure pipe 15 | 0.178 | 0.137 | 65.353 | 12.190 |
| Failure pipe 16 | 0.250 | 0.199 | 91.743 | 13.819 |
| Failure pipe 17 | 0.241 | 0.190 | 88.292 | 14.256 |
| Failure pipe 18 | 0.268 | 0.214 | 98.440 | 14.825 |
| Failure pipe 19 | 0.248 | 0.196 | 91.057 | 14.392 |
| Failure pipe 20 | 0.264 | 0.210 | 96.644 | 14.554 |
| Failure pipe 21 | 0.250 | 0.198 | 91.574 | 13.794 |
Table 12.
Pipe vulnerability values for modified Ozger and Mays network.
| Pipe ID | Vulnerability Measure |
|---|---|
| 2 (1) | 0.7834 |
| 3 | 0.7343 |
| 9 | 0.4068 |
| 15 | 0.3663 |
| 4 | 0.3550 |
| 8 | 0.2574 |
| 7 | 0.2489 |
| 5 | 0.2359 |
| 11 | 0.2330 |
| 12 | 0.1671 |
| 10 | 0.1489 |
| 14 | 0.1419 |
| 20 | 0.1394 |
| 19 | 0.0937 |
| 16 | 0.0915 |
| 17 | 0.0892 |
| 18 | 0.0870 |
| 13 | 0.0836 |
| 21 | 0.0811 |
| 6 | 0.0789 |
© 2018 by the authors. Licensee MDPI, Basel, Switzerland. This article is an open access article distributed under the terms and conditions of the Creative Commons Attribution (CC BY) license (http://creativecommons.org/licenses/by/4.0/).
Share and Cite
MDPI and ACS Style
Maiolo, M.; Pantusa, D.; Carini, M.; Capano, G.; Chiaravalloti, F.; Procopio, A. A New Vulnerability Measure for Water Distribution Network. Water 2018, 10, 1005. https://doi.org/10.3390/w10081005
AMA Style
Maiolo M, Pantusa D, Carini M, Capano G, Chiaravalloti F, Procopio A. A New Vulnerability Measure for Water Distribution Network. Water. 2018; 10(8):1005. https://doi.org/10.3390/w10081005
Chicago/Turabian StyleMaiolo, Mario, Daniela Pantusa, Manuela Carini, Gilda Capano, Francesco Chiaravalloti, and Antonio Procopio. 2018. "A New Vulnerability Measure for Water Distribution Network" Water 10, no. 8: 1005. https://doi.org/10.3390/w10081005
Note that from the first issue of 2016, this journal uses article numbers instead of page numbers. See further details here.