Characteristics of Spatial-Temporal Evolution of Meteorological Drought in the Ningxia Hui Autonomous Region of Northwest China


1
School of Environmental Science and Engineering, Chang’an University, Xi’an 710054, China
2
Ningxia Survey and Monitor Institute of Land and Resources, Yinchuan 750002, China
3
Key Laboratory of Subsurface Hydrology and Ecological Effect in Arid Region of Ministry of Education, Chang’an University, Xi’an 710054, China
4
Shaanxi Xue Qian Normal University, Xi’an 710100, China
*
Author to whom correspondence should be addressed.
Water 2018, 10(8), 992; https://doi.org/10.3390/w10080992
Submission received: 11 June 2018
/
Revised: 19 July 2018
/
Accepted: 23 July 2018
/
Published: 27 July 2018
(This article belongs to the Section Water Resources Management, Policy and Governance)
Abstract
:This study focuses on the intensity, duration, and frequency of meteorological droughts in Ningxia, northwest China, from 1960 to 2016. The analysis was conducted using the interannual characteristics of droughts, which were studied by the standardized precipitation evapotranspiration index (SPEI) at different timescales. Additionally, the correlation, mutability, and periodicity of two series in both the time and frequency domains in multi-time scales were scientifically analyzed using the wavelet analysis method. The results showed that the occurrence of drought had increased at different timescales (i.e., SPEI1, SPEI3, and SPEI12) during the past 57 years. The autumn drought had the largest share; spring is the high-occurrence season of extreme drought and the overall drought intensity increases towards the north. The periodical change of droughts was described with the wavelet coefficient real part value, wavelet power spectrum, and wavelet variance. The results showed that the 13- and 8-year time scales had the strongest oscillation and energy, and they were the first and the second major periods of drought. Moreover, the drought mutational fluctuations are in better agreement with that characterized by the SPEI12 and actual conditions. The results help to understand the occurrence and evolution of droughts in Ningxia, and to provide a scientific basis to reduce and prevent the drought disaster.
1. Introduction
Drought is one of the many critical meteorological disasters that threaten human survival. In China, the influence of drought is growing and the losses are becoming more prominent. Since 1951, the expansion rate of the arid regions in China increased by 3.72% per 10 years [1]. Since the 1990s, especially in northern China, the frequency and intensity of the droughts have dramatically increased [2]. In the scope of understanding the severity of droughts, combating the resulting disasters, and for ensuring a healthy agricultural development, a quantitative description of the spatial-temporal evolution of droughts and revealing the trends of the drought cycles have become vital [3]. Ningxia lies in the northwest inland of China. This area has sandy soils of a low viscosity, and lacks water resources [4,5]. Moreover, Ningxia is located on the edge of the Mu Us Sandy Land and the ecological environment is fragile. The frequency of droughts in this region is the topmost and accounts for more than half of the total disasters [6]. The area influenced by drought is relatively large, which makes the agricultural production low and unstable; consequently, the development of the agricultural economy is seriously restricted in Ningxia. Hence, the study on the drought occurrence and evolution in Ningxia has significant theoretical and practical importance.
Nowadays, research studies are focusing on the selection of indicators for the analysis of drought characteristics and for the exploration of analytical methods. According to the statistics of the World Meteorological Organization in 1980, there are as many as 55 kinds of drought indices in use [7]. The Palmer drought severity index (PDSI), proposed by Palmer [8], is one of the most widely used indices in the world; it can be used to quantify the drought severity in diverse climate zones [8]. There are subjective factors in the definition of the drought levels, which may lag several months when judging the extreme drought. Karl [9] has established an indicator system that can analyze the degree of drought. This indicator has been applied to drought research all over the world for half a century [10]. Kite [11] proposed the precipitation Z index, which is not solely related to precipitation, but also includes the spatial and temporal distribution of precipitation. The standardized precipitation index (SPI), developed by McKee et al. [12], can reflect droughts at different timescales and is purely dependent on precipitation [13]. Tsakiris and Vangelis [14] proposed the reconnaissance drought index (RDI), which is widely used in many regions of the world because of its low requirement for data and its high sensitivity and adaptability [15]. Vicente-Serrano et al. [16] proposed a standardized precipitation evapotranspiration index (SPEI), which is based on SPI; moreover, the SPEI is based on the precipitation and potential evapotranspiration. In addition to retaining the temperature-sensitive characteristics of the PDSI (considering evapotranspiration), the SPEI has the advantage over SPI by being suitable for multi-scale and multi-spatial comparisons. The SPEI is particularly suitable for detecting and monitoring the characteristics of drought changes in the context of global warming; indeed, this has been used in various aspects of drought research [17]. Vicente-Serrano et al. used this index to establish a data set of global drought trends between 1901 and 2006 [18]. In China, the main meteorological drought indices include the precipitation anomaly (Pa), Palmer index, SPI, precipitation Z index, relative moisture index (MI), composite drought index (CI), and finally, SPEI [19].
Chinese scholars have made progress in the selection of indicators for drought characterization and the exploration of analytical methods, especially in northern China. In 2005, Zou et al. [20] used the PDSI index to analyze the changing trend of droughts in China between 1951 and 2003. In 2007, Li et al. [21] used the PDSI to construct a drought assessment system in northern China. In 2015, Li et al. [22] used SPI to characterize the indicators of drought evolution and hazard factors in the Lu’an River Basin, northern China. Chen et al. [2] used the SPEI to study the changing drought trends in China. Zhang et al. [23] used the Penman–Monteith and Morlet wavelet methods to analyze the temporal and spatial changes of the reference crop evapotranspiration, precipitation, and aridity index (AI), in addition to their influencing factors. In 2016, Liu et al. [24] applied the SPEI to study the 53 year drought evolution pattern in the Inner Mongolia Autonomous Region in northern China. In 2017, Liang et al. [3] used the SPEI to study the temporal and spatial distribution characteristics of drought in northeastern China. Ming et al. [25] chose the SPEI to partition the spatial distribution of drought in northeastern China. Finally, Wu et al. [26] studied an assessment of agricultural drought vulnerability in the Guanzhong Plain, China.
Although several studies concerning the temporal evolution and spatial distribution of droughts in northern China have been done, studies in Ningxia are rather limited. Furthermore, most studies merely used data from individual weather stations in a certain period or a certain area, and some other studies primarily focused on the relationship between drought and reference crop growth, or on a certain feature of drought. However, the full coverage and long time-series studies on the entire Ningxia region have not been covered, according to our knowledge. The research on the periodicity, mutability, and change trend of drought mainly depends on the artificial discrimination, and the scientific content is poor. In this paper, the SPI and SPEI were selected for preliminary analysis based on observed meteorological data of the monthly mean temperature and precipitation from 24 surface meteorological stations covering the entire region since 1951; reference was made to the actual situation recorded in “China 500-year Drought and Flood Rating Data Set”, “The Ningxia Agricultural Meteorological Disaster Value Data Set”, and “China Drought Disaster Data Set” [27] for verification. It was confirmed that the effect of the SPEI on the Ningxia drought characteristics analysis was superior to that of the SPI, in which the dry and wet conditions were more accurately reflected. Finally, the SPEI was used to analyze the evolution of the spatial and temporal characteristics of droughts in Ningxia between 1960 and 2016. Moreover, the wavelet analysis was developed based on the Windowed Fourier Transform, a new method for analyzing signals [28]. Drought is a time-dependent series that is usually unstable but can present a periodic trend. Using wavelet decomposition to perform a time-frequency variation and multi-scale analysis of the drought index, the high and low flow alternating change process of drought can be obtained; thus, the changing trend of droughts can be predicted [29].
This paper uses the SPEI, which is calculated by the meteorological data from 24 meteorological stations over a period of 57 years, to describe the interannual characteristics at different timescales in Ningxia. The attributes of drought, such as the scope, intensity, and frequency were analyzed. To our knowledge, it is the first time that the correlation, mutability, and periodicity of two series in both the time and frequency domains in the multi-time scales were scientifically analyzed via the wavelet analysis method. The coverage and period of this research data set are more comprehensive than those of previous studies; studies including the SPI and SPEI make the research findings more certain and accurate; the subjectivity of drought mutability and periodicity that was identified by the wavelet analysis was avoided effectively. This article provides a remarkable theoretical improvement in the field of research. Furthermore, it has significant information regarding drought prevention and relief; accordingly, the scientific information can be of benefit to the Ningxia government with regards to drought warning and the formulation of drought relief policies.
2. Data and Methods
2.1. Study Area
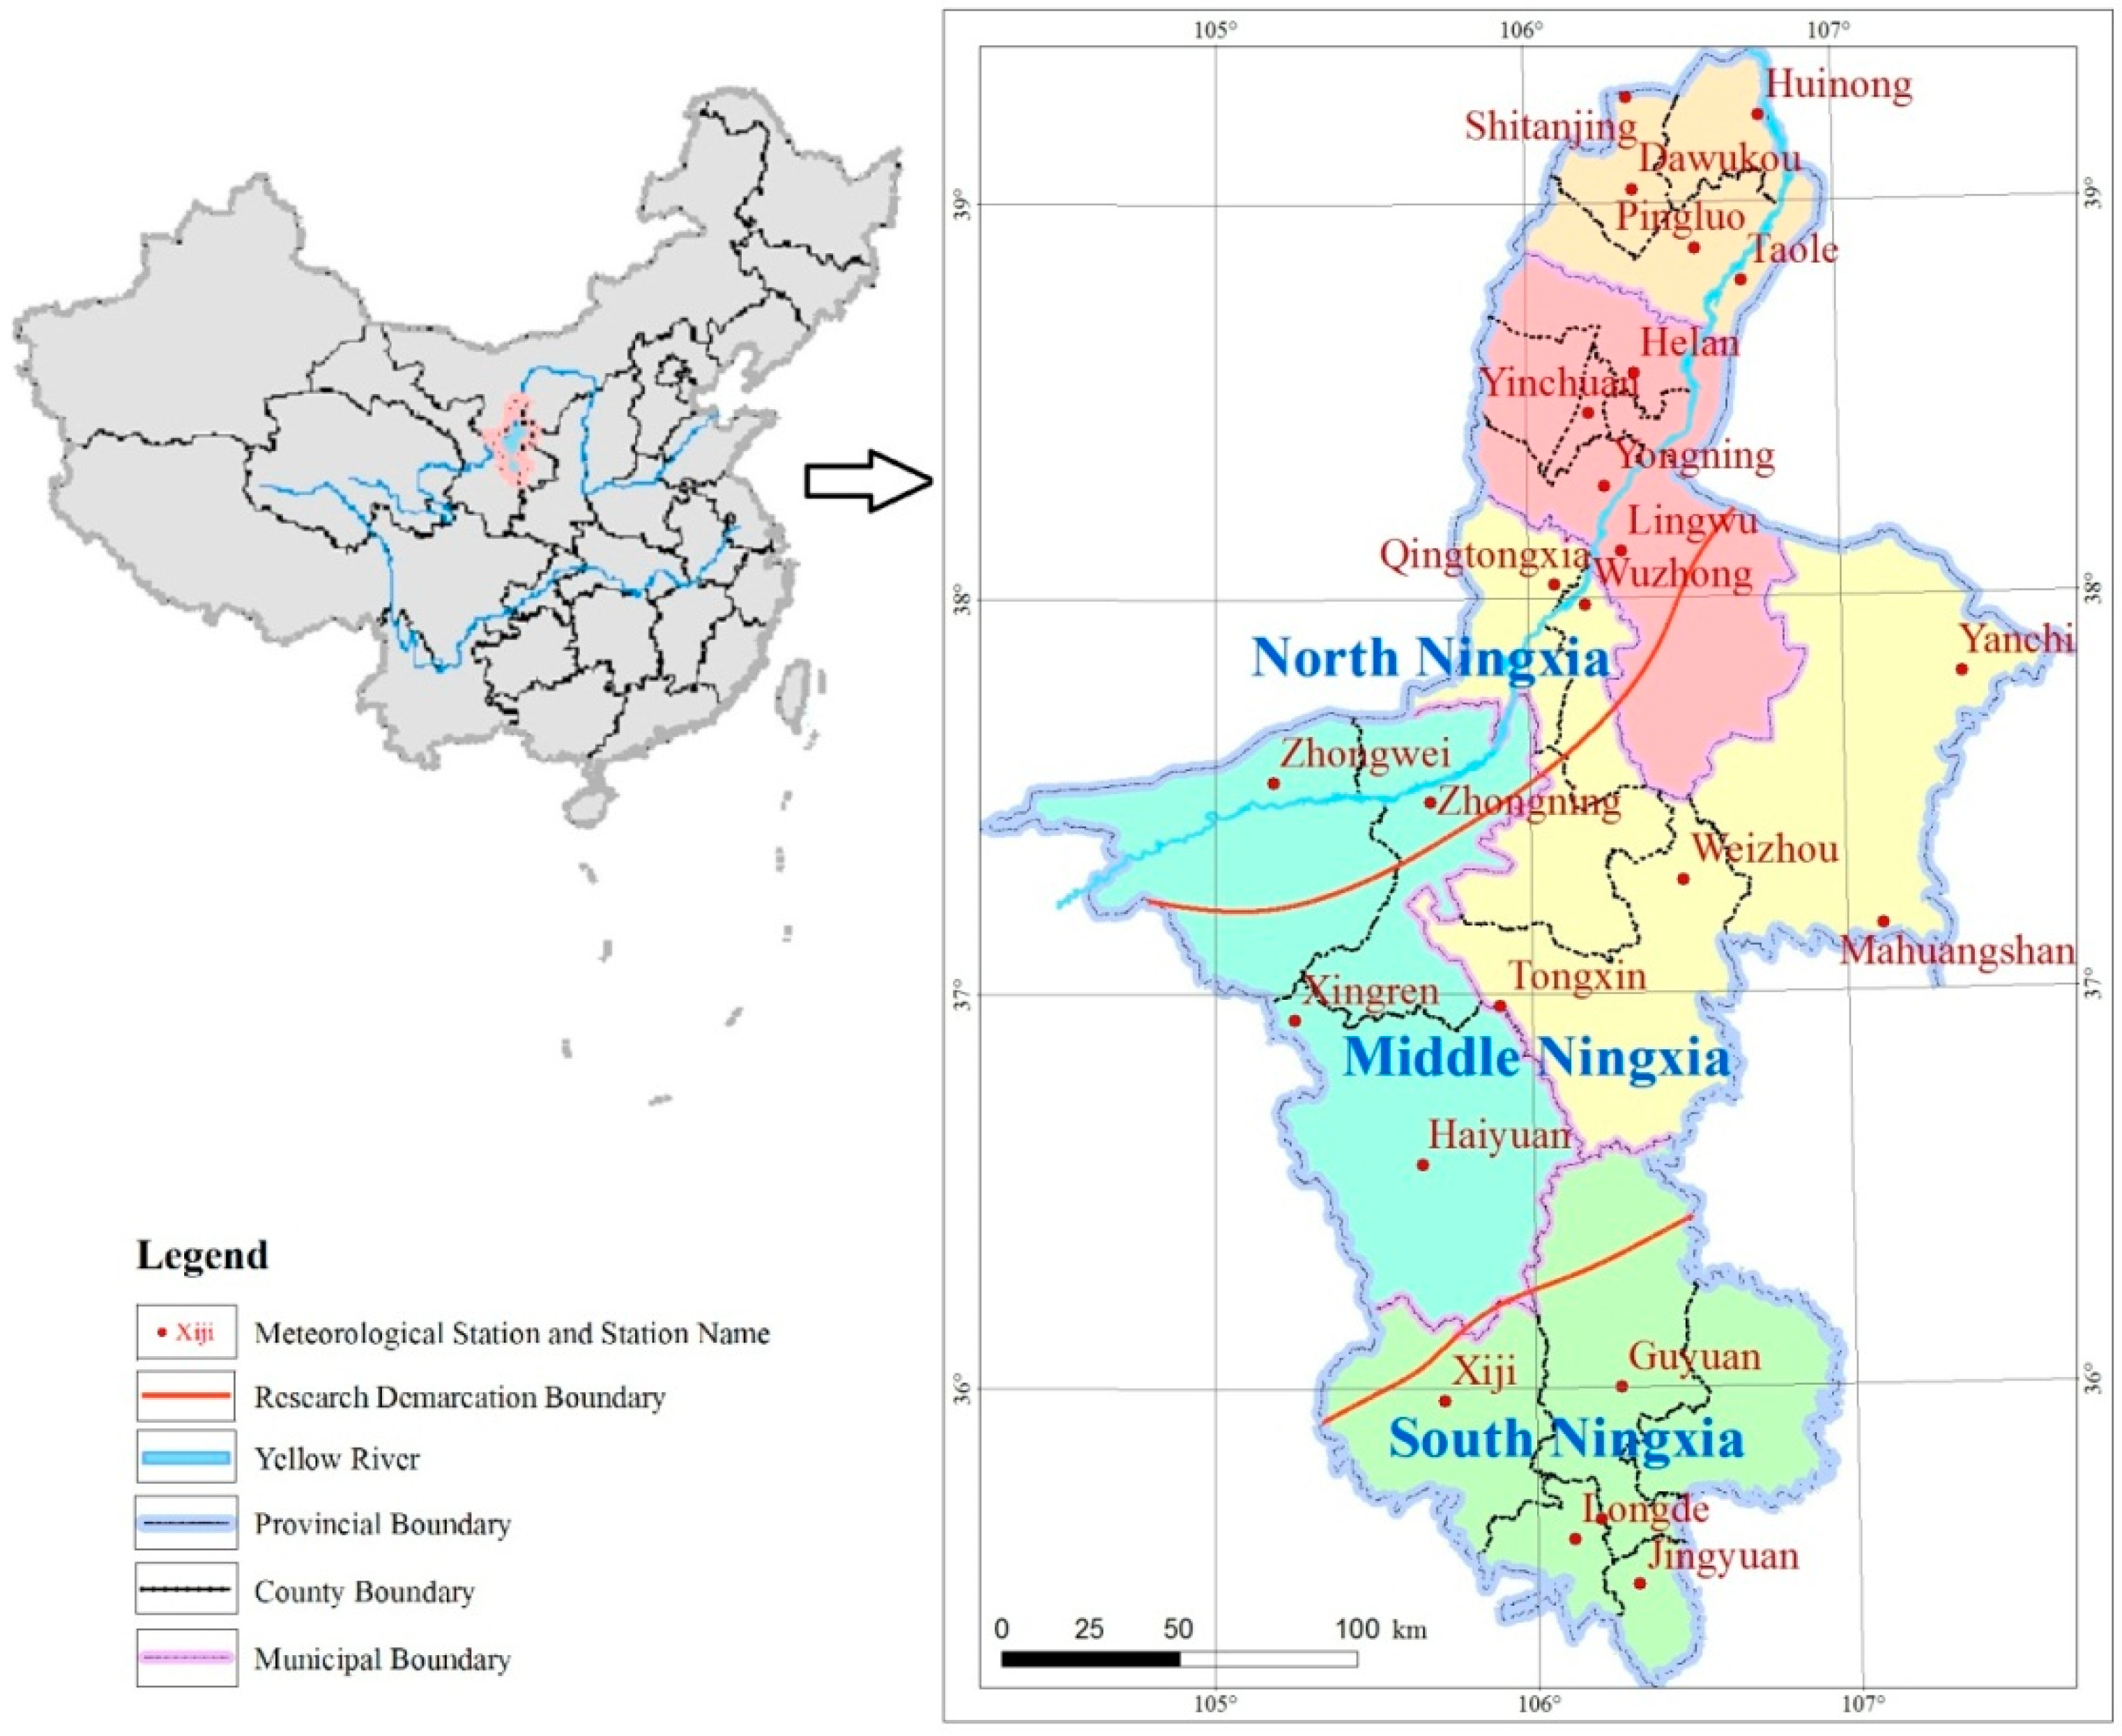
The Ningxia Hui Autonomous Region is located in the eastern part of northwestern China (104°17’–107°39’ E, 35°14’–39°23’ N, and has total area of 66,400 km2). The region extends in the north–south direction, which becomes relatively narrower towards the north and the south; the terrain is of a higher altitude in the south; the variation in elevation is larger in the west in comparison to the east. Ningxia can be divided into plains, mountains, loess areas, hilly areas, and sand dune areas [30,31]. The climate of the study area is a typical continental climate [32]. The average annual temperature is 8.22 °C; the average annual temperature increase rate is about 0.3 °C per 10 years. The average annual evaporation and the average annual precipitation are 2075.1 mm and 276 mm, respectively. The precipitation is very unevenly distributed throughout the year; the precipitation accounts for 14–18%, 51–65%, 20–28%, and 1–2% in spring, summer, autumn, and winter, respectively. There is a great variation in the interannual precipitation in the whole region, with a slight increasing trend (0.08% per 10 years). The precipitation in the region increases from the north towards the south, with higher variations in the former. In the southern region, the land is arid and has relatively low rain events; therefore, higher evaporation and dryness are witnessed, which indicates a region prone to meteorological disasters [33,34,35]. According to the multi-year average precipitation in the 200 mm and 400 mm contours of the study area, in combination with the topographic and geomorphological features, the study area is divided into three regions, which are the northern, middle, and southern regions. The northern region has a long-standing irrigation agricultural system, the middle region is arid and acts as a transitional region of the agro-pastoral ecotone, and the southern mountainous region is dominated by broad regions known for extensive crop production (Figure 1).
2.2. Data
The meteorological data were obtained from the Meteorological Bureau of the Ningxia Hui Autonomous Region. The multi-year monthly meteorological observations, covering January 1960 to January 2016 (57 years or 684 months), were used from 24 surface meteorological stations; the distribution of the meteorological stations is shown in Figure 1. The meteorological data include the monthly mean precipitation, monthly average temperature, and monthly average evaporation. These data have been strictly managed by the Ningxia Meteorological Bureau; therefore, the data are confidently accurate. In this paper, the meteorological criteria for the seasonal division were used; the divisions include spring (March to May), summer (June to August), autumn (September to November), and winter (December to February).
2.3. Methods
2.3.1. Drought Indices: The SPI and the SPEI
Drought is essentially a deficiency of water [36,37]. The standardized precipitation index (SPI) is one of the most prevalent meteorological drought indices, and it is mostly recommended by the World Meteorological Organization (WMO) as a standard drought index [38,39]. The SPI is related to the precipitation, and transforms the medium-term precipitation records into a normal distribution [12]. It can be computed by precipitation as an only the input and for the different timescales, and has the capability to monitor both the dry and wet spells, and is related to probability [40,41]. For more information on the computation of the SPI values, the reader is referred to [12,42,43]. The documentation and executable files are freely available at http://drought.Unl.edu/Monitoring-Tools/Downloadable SPI Program.aspx/.
The standardized precipitation evapotranspiration index (SPEI) was proposed based on the SPI by Vicente-Serrano et al [16]. It was invented by standardizing the difference between the precipitation and potential evapotranspiration [44], and it is also a standardized drought index with multiple timescales. Its computation requires a time series of total monthly precipitation (P) data as well as monthly potential evapotranspiration (PET) [45]. The monthly PET was calculated based on the approach presented by Thornthwaite [46,47], which only relies on the monthly mean temperature (T) and latitude (L). Then, an update method for calculating the ET0 was published. It was the FAO-56 Penman-Monteith equation [48], which combined the aerodynamic and radiative components using the different climate variables measured at weather stations (e.g., temperature, wind speed, humidity, and solar radiation) [49,50]. The Penman–Monteith equation methods are detailed in the literature (see [16,17,51,52,53]). The Penman–Monteith method needs more data, as the Thornthwaite method only needs the data of temperature and latitude; it was used to compute the SPEI for multiple timescales in this paper. The documentation and executable files are freely available at http://digital.csic.es/han-dle/10261/10002/.
2.3.2. Drought Assessment Index
For a better scientific and reasonable reflection concerning the scope and intensity of drought occurrences, the regional droughts can be evaluated in terms of drought frequency, drought stations proportions, and drought intensity [55].
is used to reflect the frequency of drought in a certain meteorological station within a period of years. The formula is as follows:
where is the number of drought years at the station, is the total number of years of precipitation data, and i represents the weather station.
represents the drought stations proportions in the region, with respect to the total number of stations. The formula is as follows:
where is the total number of meteorological stations, j is a certain year, and is the number of stations where drought occurs. When < 10%, it indicates that there is no drought; when 10% ≤ < 30%, it indicates that local drought occurs in local areas; when 30% ≤ < 50%, it indicates drought in some areas; when 50% ≤ < 70%, it indicates a regional drought; and when ≥ 70%, it indicates a full-scale drought.
It is considered that there is a persistent drought (D) if the SPEI1 ≤ −0.5 lasts three months or above, M is the persistent droughts occurrence year, is used to indicate the drought intensity of a persistent drought, which is usually related to the absolute value of the SPEI1. Higher absolute values indicate more severe droughts. The formula is as follows:
where is the numbers of M; is the SPEI value of the jth drought site in the ith year. The average SPEI1 value of M is the SPEI value of the drought process. Then, the drought intensity of each site is calculated according to formula (3), and the drought intensity spatial analysis is performed using its standardized numerical percentages.
2.3.3. Wavelet Analysis Method
The wavelet transform decomposes the time series into time and frequency domains in order to obtain a significant fluctuation pattern of the time series (that is, a period and a time change pattern of the period). The wavelet transform is divided into Continuous Wavelet Transform (CWT) and Discrete Wavelet Transform (DWT). The latter is a compact representation of data and is commonly used in noise reduction and data compression processing [56,57]. In this study, CWT, , is the basis for wavelet analysis, which could be defined as the convolution of the data with a translated and scaled version of the wavelet function, which is localized in both the frequency and time with a zero mean [56,58].
where the asterisk (*) represents the complex conjugate, represents the wavelet scale, is the uniform time steps, and is the localized time index.
The other (i.e., CWT) is suitable for signal feature extraction. The wavelet coefficients obtained from the CWT variation results represent the degree of approximation of the time series and the wavelet. Currently, the Morlet wavelet function is similar to the waveforms of the time series, such as runoff, precipitation, and air temperature; it can also detect the amplitude and phase of the time domain in a certain time series in different frequency domains, and it clearly demonstrates the local characteristics of the time–frequency domain. The Morlet mother wavelet was chosen because, with respect to other functions (wavelet and e.g., sine), it describes the shape of drought index signals quite well, while providing a good balance between time and frequency localization [59,60]. The aim of the wavelet transformation is multiple dissociation by decomposing the data in the scaling space, thus making it possible to reveal its self-similarity structure. As a result of such advantages, the Morlet wavelet function is widely used in hydrometeorological and meteorological time series [58,61]. Therefore, the wavelet transform of the precipitation time series was performed using the Morlet complex value wavelet. Detailed methods of the wavelet transform and Morlet wavelet transform theory can be seen in the literature [51,52,53,62,63].
The method of combining the wavelet transform with the Cross Spectral Analysis is called Cross Wavelet Transform. It is a new method that analyzes the significance of the interaction of two-time series in different time and frequency domains from the perspective of multiple scales [64]. Based on the continuous wavelet spectra of the two-time series, constructing the WTCs can reflect the ranges of the same or similar power spectrum regions (of two-time series) in different time and frequency domains. More significant interactions between the two-time series over different time–frequency domains are indicated by larger power spectrum values [56].
3. Results and Discussion
3.1. Temporal Characteristics of Droughts in Ningxia
3.1.1. Multi-Timescale Temporal Characteristics of Droughts via the SPI and the SPEI
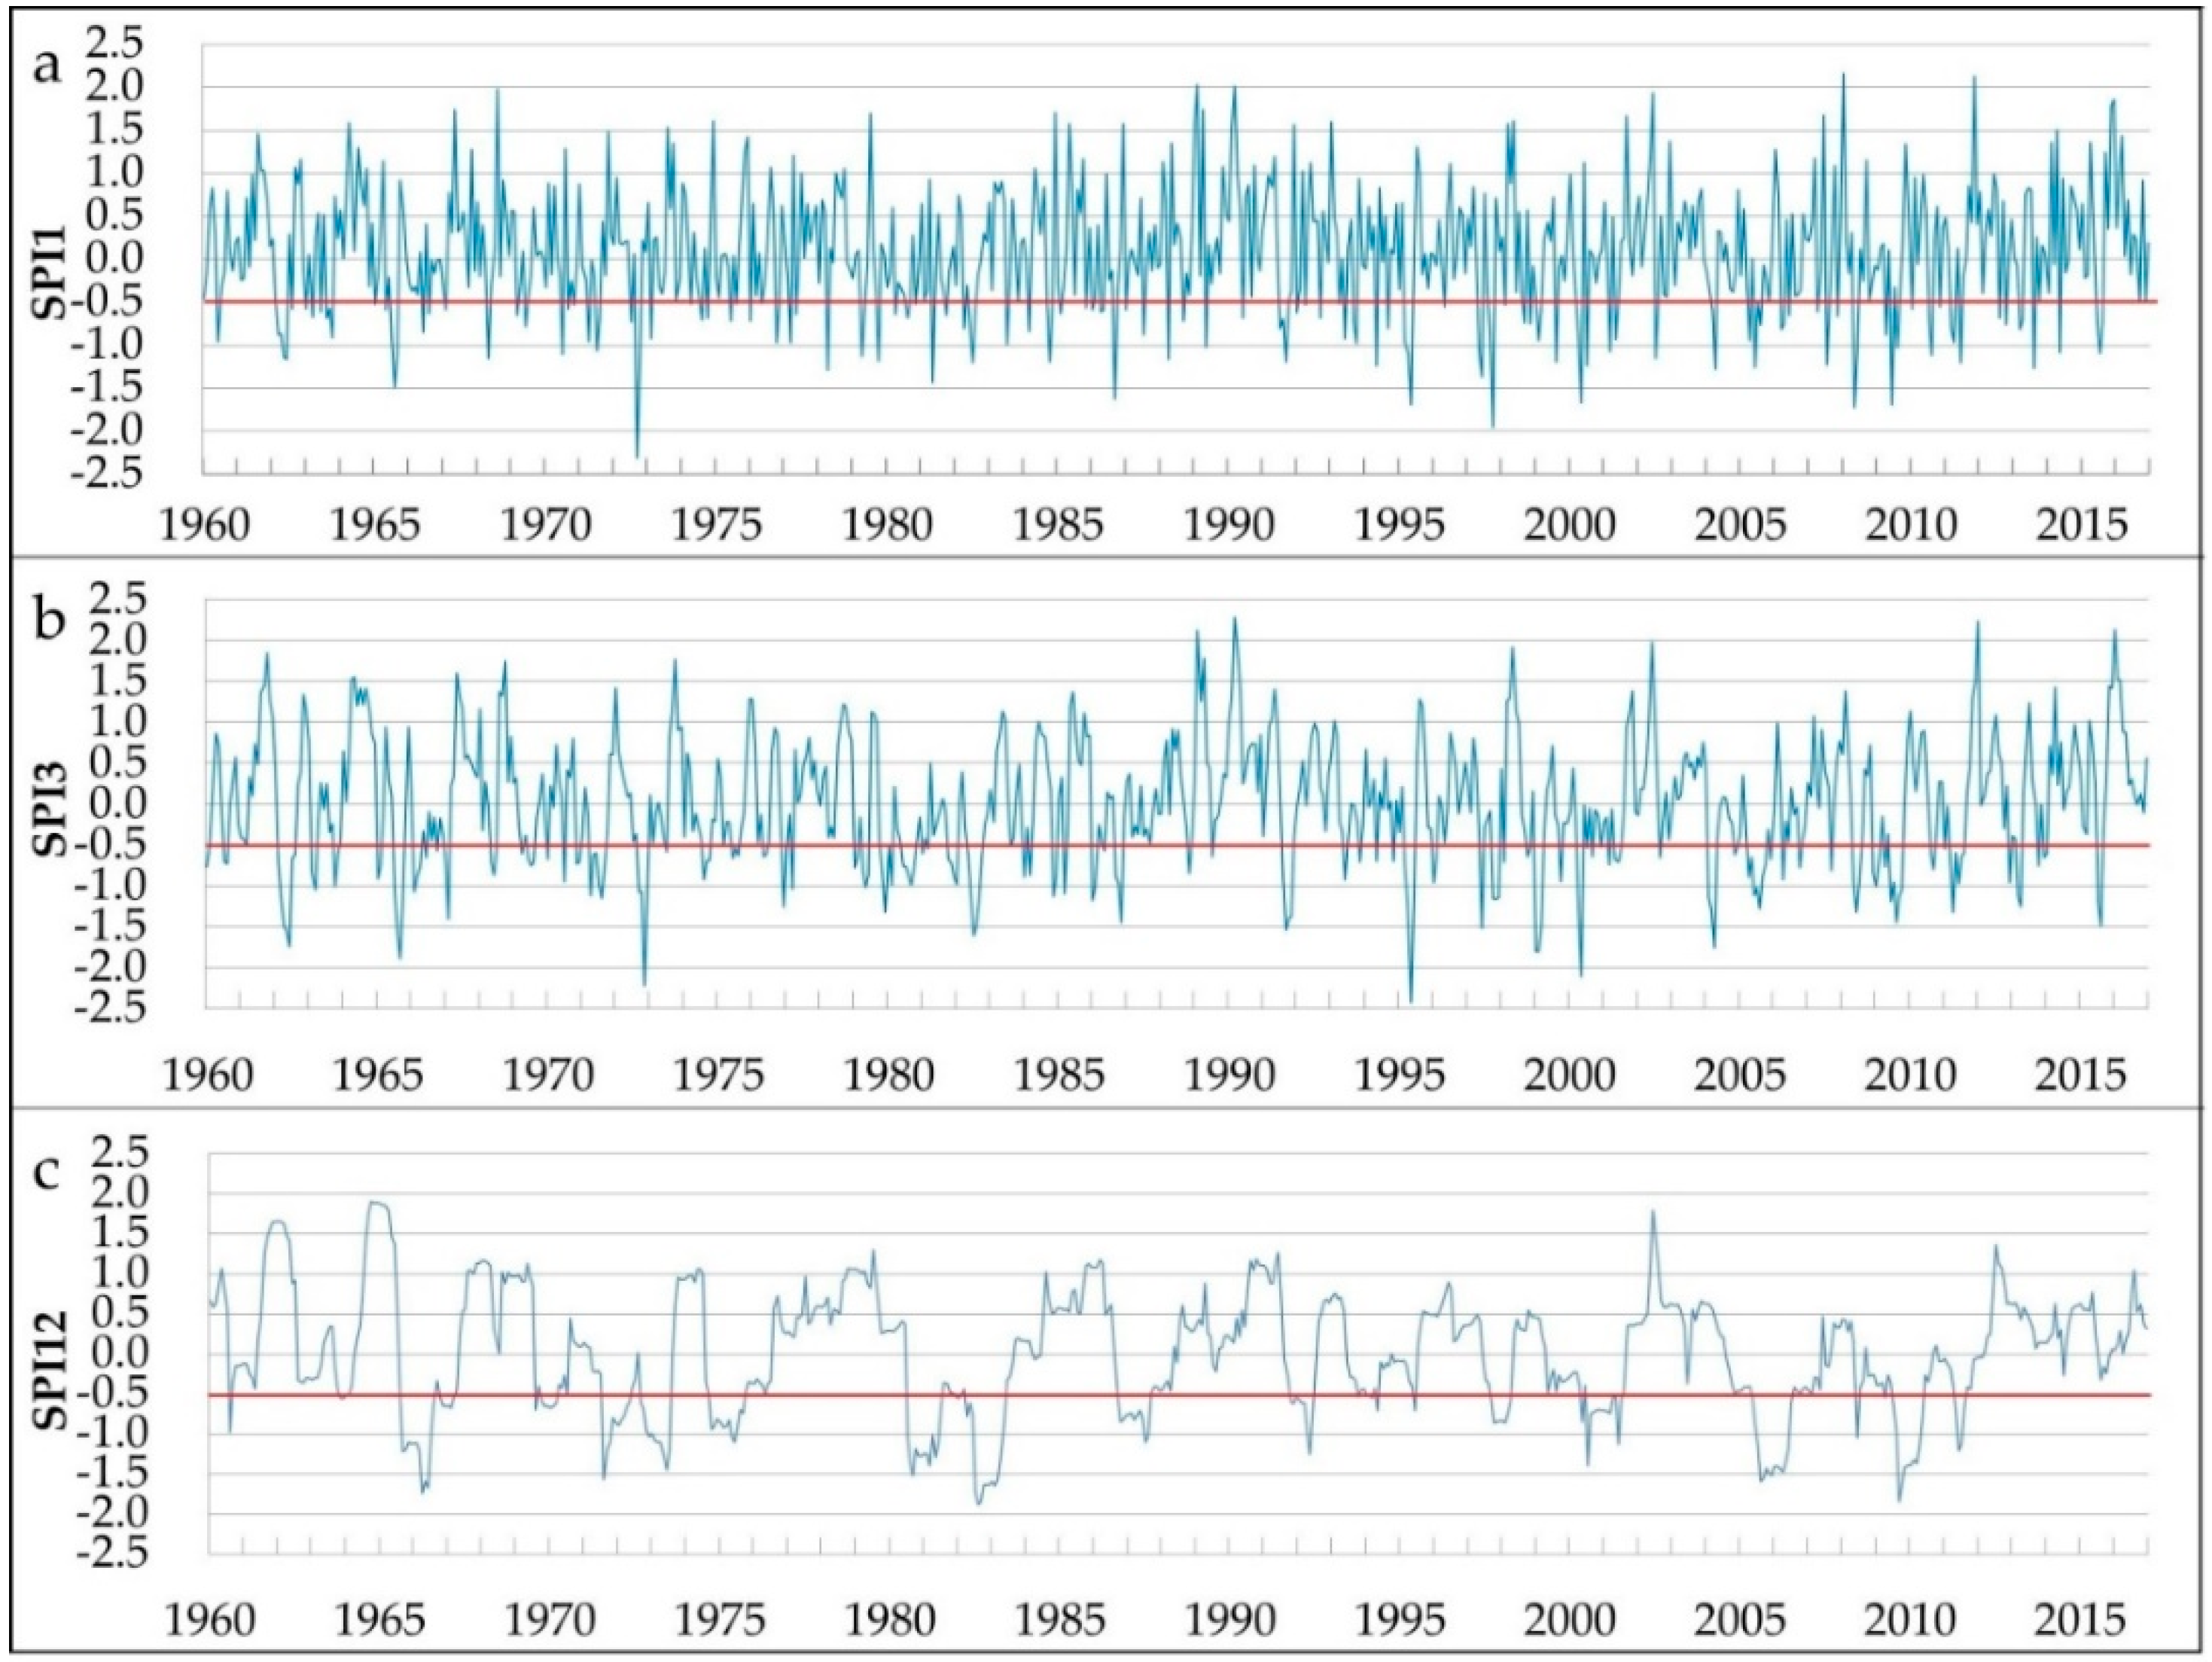
The average SPI and SPEI at various timescales of all of the stations in Ningxia were calculated from 1960 to 2016. Moreover, Figure 2 and Figure 3 show the temporal characteristics of the SPI and the SPEI at three timescales (i.e., SPI1, SPI3, and SPI12, and SPEI1, SPEI3, and SPEI12). Both the SPI and the SPEI values at different timescales reflected the change of the drought and wet occurrence in the regions. Because of the short timescales, the SPI1, SPI3, SPEI1, and SPEI3 values were greatly affected by the short-term precipitation. These signals fluctuated frequently. The characteristics of the drought duration and periodicity were not obvious. As the timescale increases, the precipitation accumulation was becoming more and more important, the frequency and the amplitude of the fluctuation decreased, while the separations between the dryness and wetness became clearer.
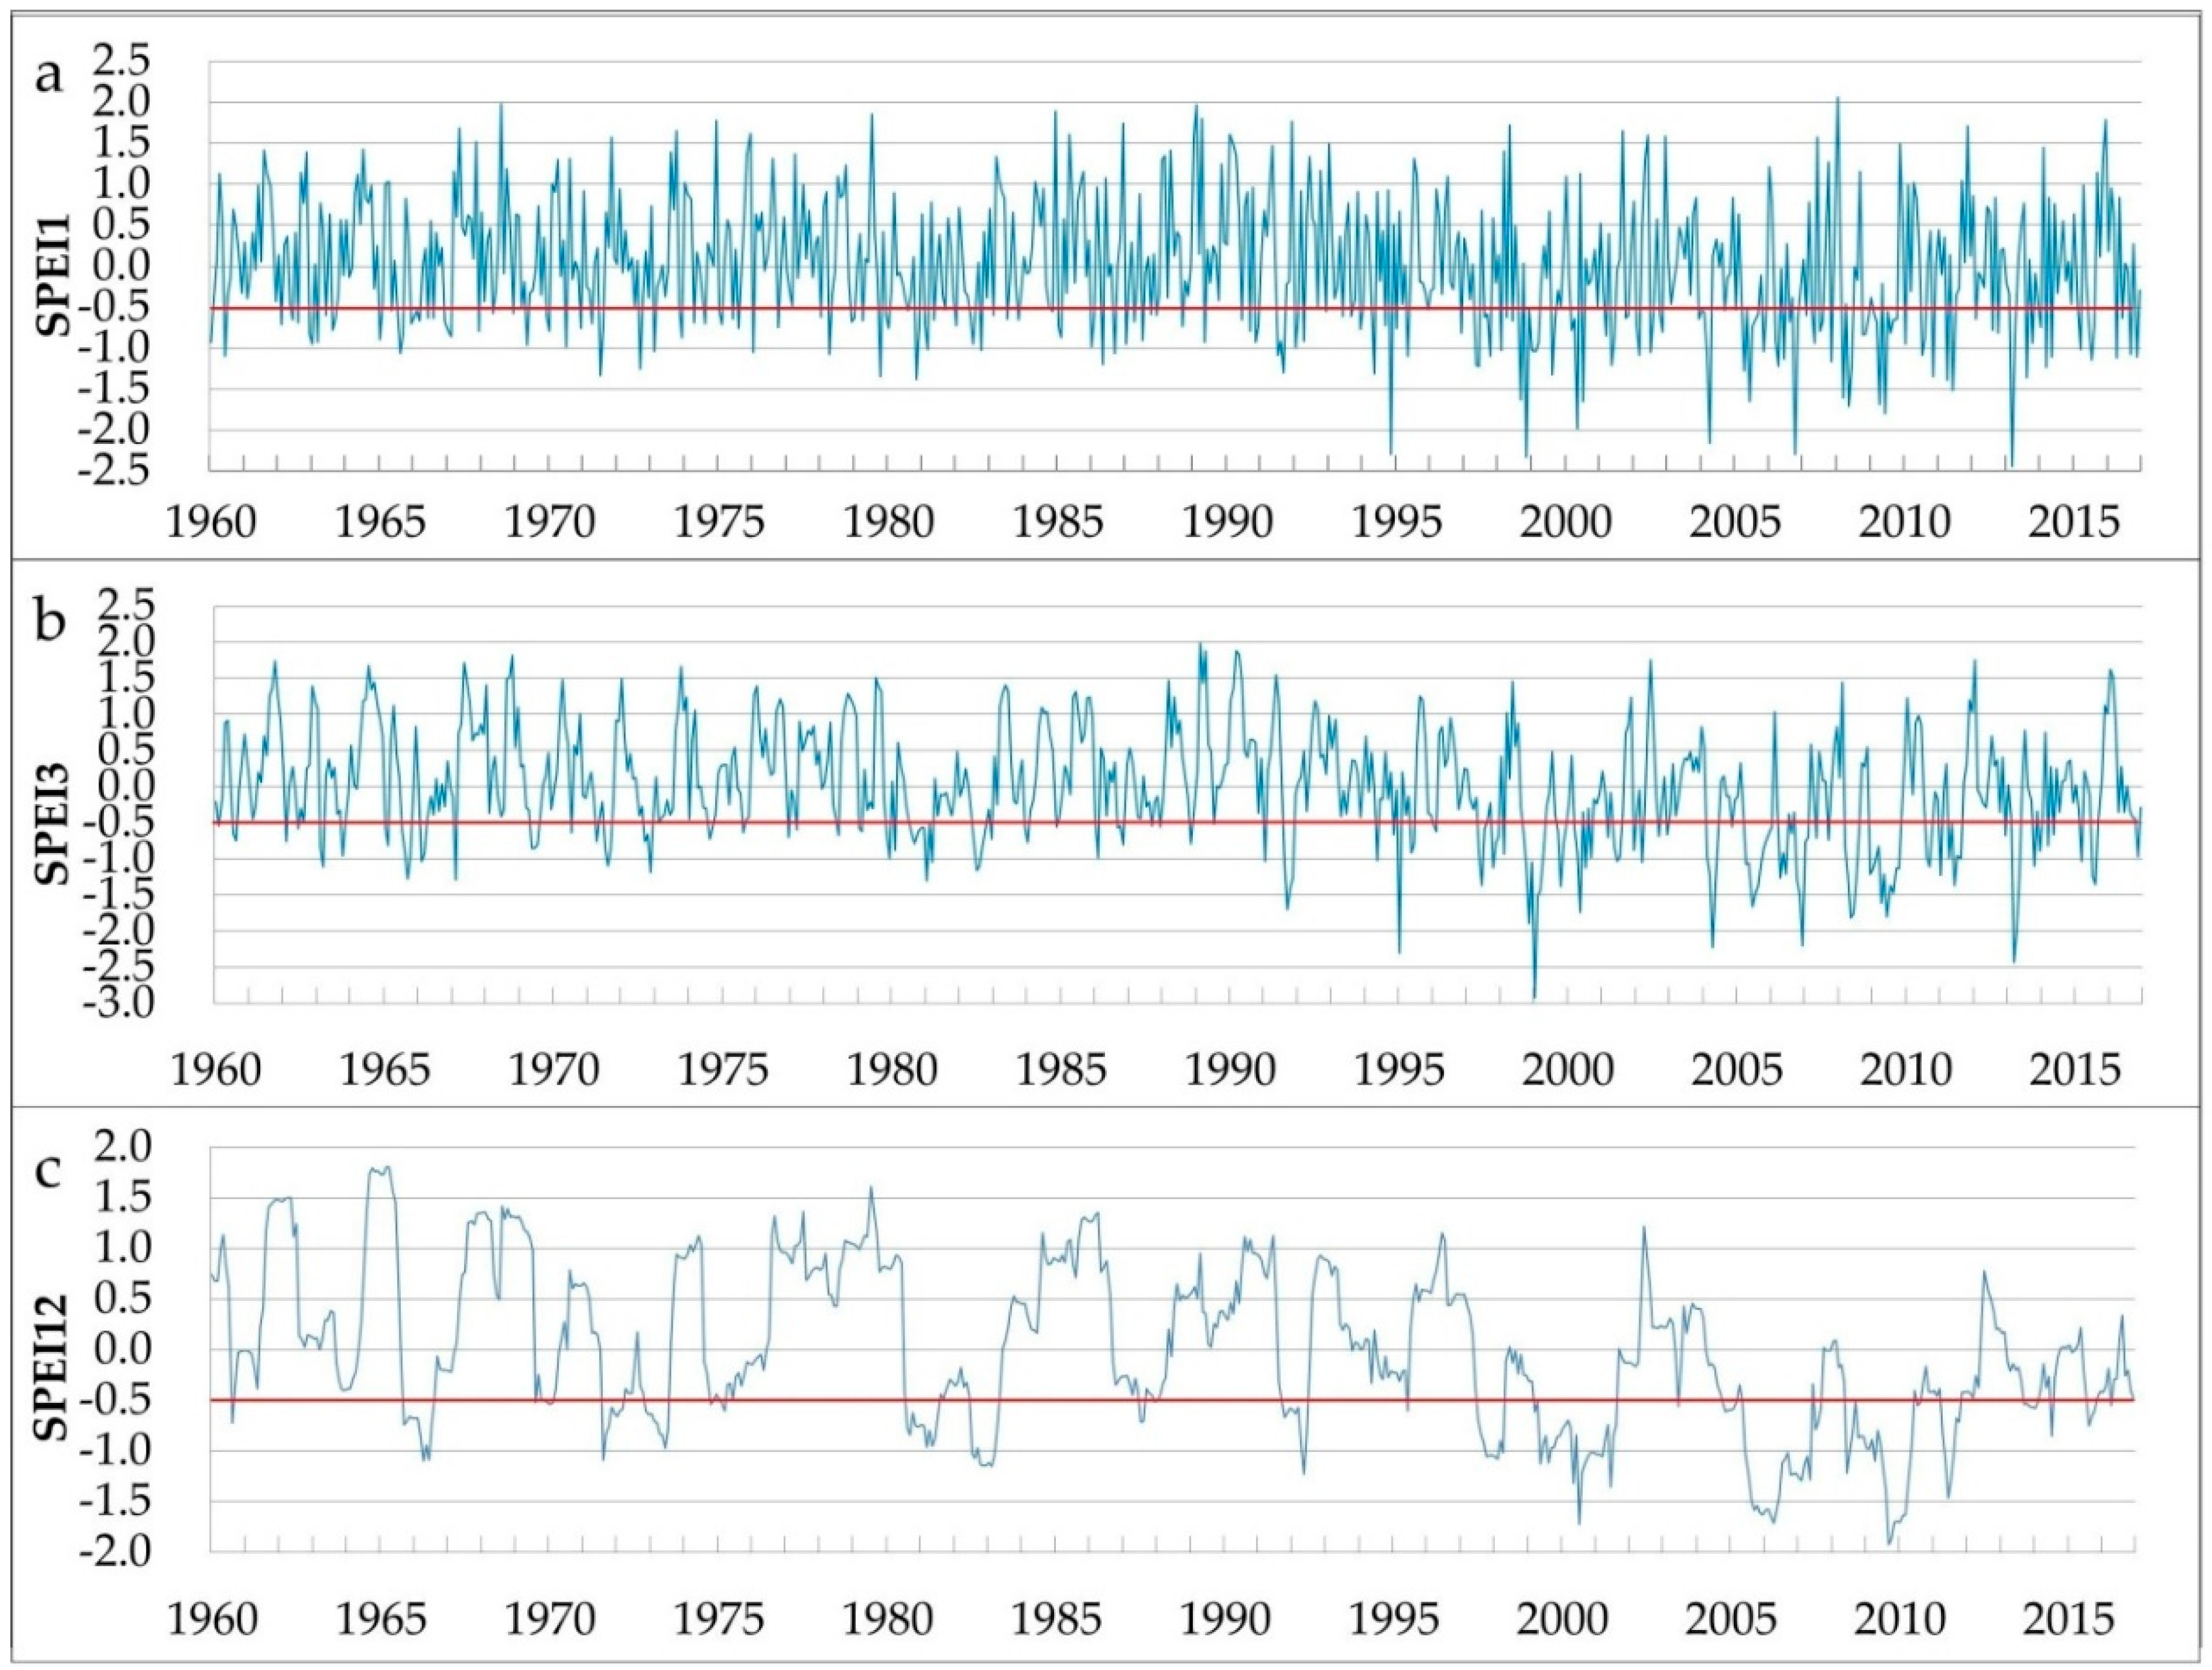
The drought represented by SPI1 and SPI3 showed a trend of a decrease, while the SPI12 showed an increasing trend. The SPEI values at the three timescales indicated minor different fluctuation trends, yet all the SPEI values showed a gradually increasing trend. Moreover, the characteristics of the occurrence of different drought degrees and occurrence years at the different timescales were clearly different between the SPI and SPEI. The SPI1 and SPI3 showed that the extreme drought occurred in September and November 1972, respectively, yet the SPEI1 and SPEI3 showed that the severe and moderate drought occurred in the same months. There was no drought that occurred after June 2010, which was indicated by SPI12; however, SPEI12 revealed that droughts of various degrees occurred every year, except for 2012.
The references were made to the actual situation recorded in the “China 500-year Drought and Flood Rating Data Set”, “The Ningxia Agricultural Meteorological Disaster Value Data Set”, and the “China Drought Disaster Data Set” [27] for verification. The drought represented by SPEI12 is consistent with the drought historical data of the region. For example, the typical drought years in Ningxia are 1965–1966 (severe drought), 1969–1972 (moderate drought), 1980–1983 (moderate drought), 1987–1988 (moderate drought), 1991 (mild drought), 1997 (moderate drought), 1999–2001 (moderate drought), 2003 (mild drought), and 2005–2009 (severe drought). From the frequency of the drought, based on the SPEI12 in the whole Ningxia region, a drought occurred every 4–5 years on average, with an average of 3–4 years of a drought cycle. Finally, drought has become more frequent after the mid-1990s. Then, the SPEI was proposed based on the SPI, and it was used to reflect the extent of the drought, which relies not only on a precipitation but also on a temperature. The reason drought become more frequent, according to the SPEI, is due to the deficiency of water combined with an increased temperature and PET. There is a slight increasing trend (0.08% per 10 years) of the interannual precipitation in Ningxia, yet the average annual temperature increase rate is about 0.3 °C per 10 years simultaneously. It shows that the temperature takes an important part in the occurrence of drought, which accounts for the high precipitation but the low SPEI value. The slight increase in precipitation did not offset the increase in PET caused by the rise in air temperature. The SPEI is a good reflection of the trend of drought caused by global warming.
3.1.2. Yearly and Seasonal Temporal Characteristics of Drought in Ningxia
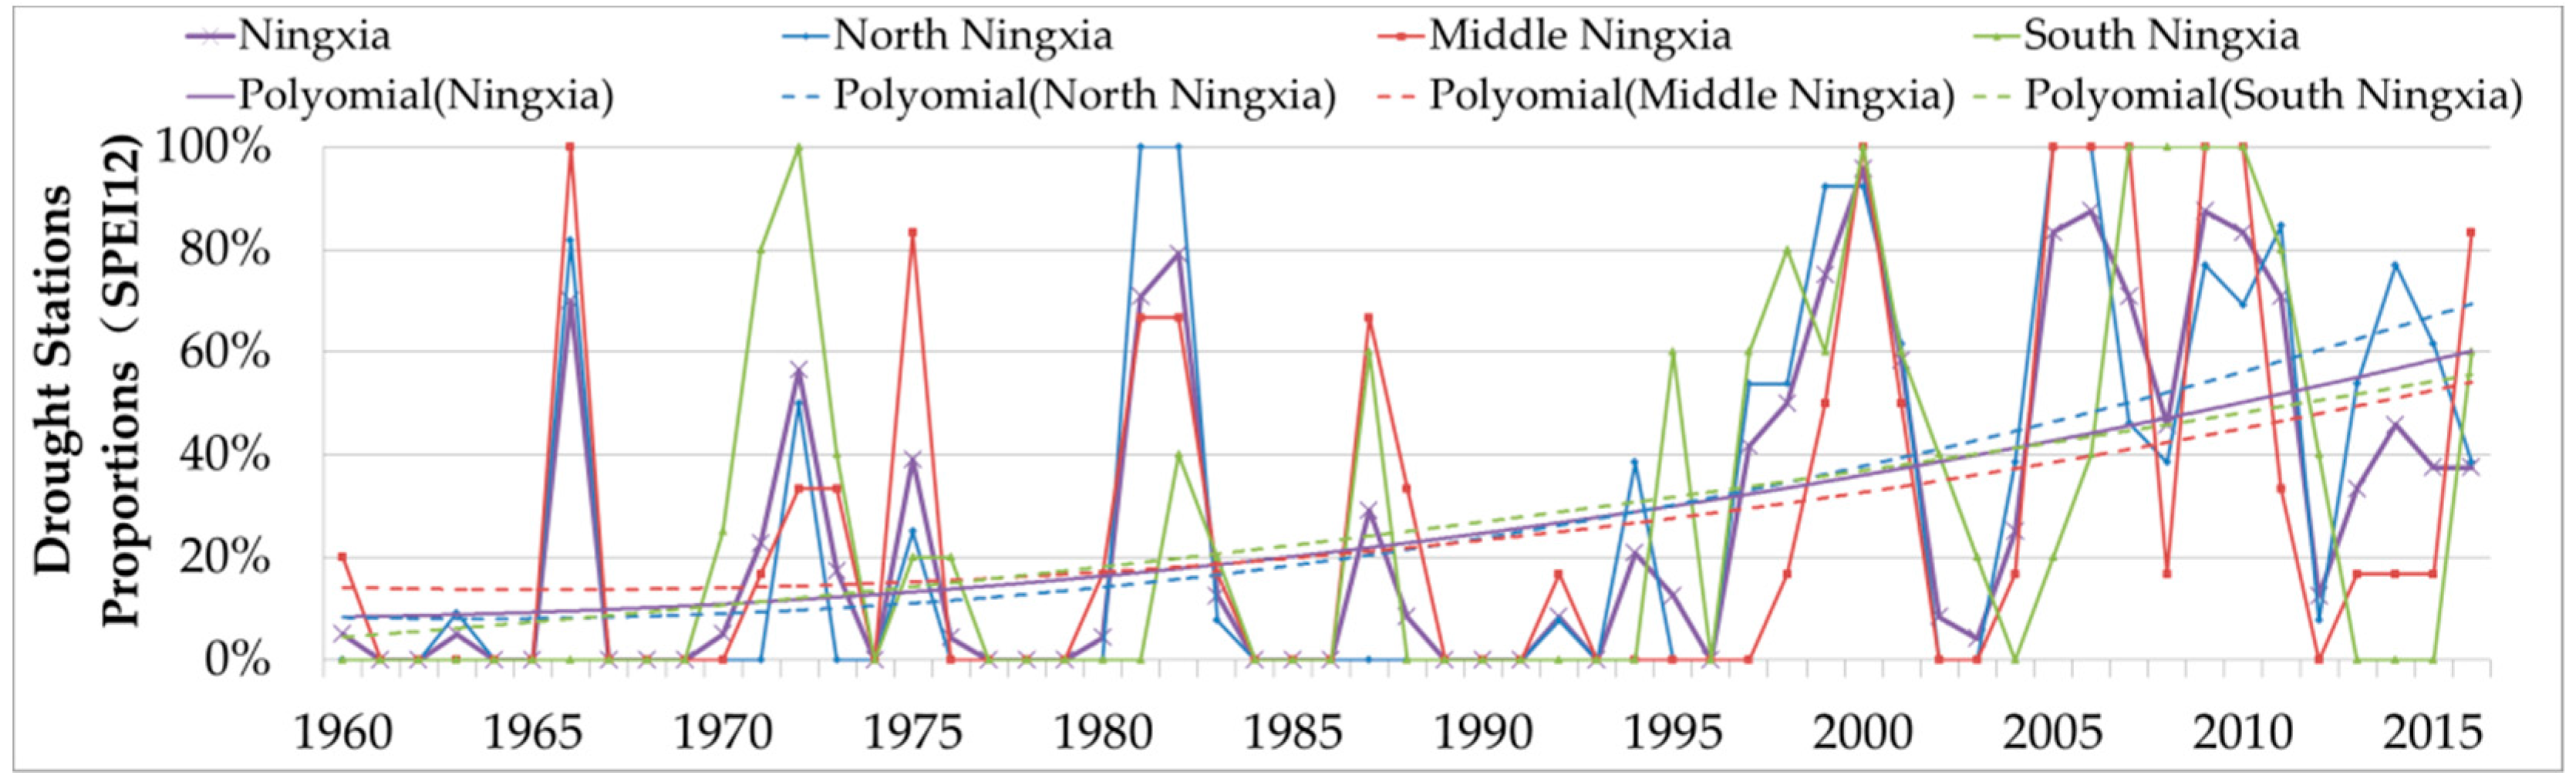
The drought stations’ proportions were used to indicate the size and influence of the droughts as well as to indirectly reflect the severity of the droughts. This paper analyzes the interannual and seasonal variability of the drought stations’ proportions in different regions in Ningxia; consequently, the interannual trends of drought in the different regions in Ningxia were obtained. The SPEI12 reflected the interannual variation of the drought in Ningxia, while the drought stations proportions, based on SPEI12 in the three sub-regions, presented a yearly increasing trend (Figure 4). In the mid-1960s, the 1970s, the early 1980s, and the mid-1990s, the effect of drought in every region was relatively large, and the drought stations proportions reached more than 50% (regional drought). Interestingly, the drought stations proportions reached 100% in several years.
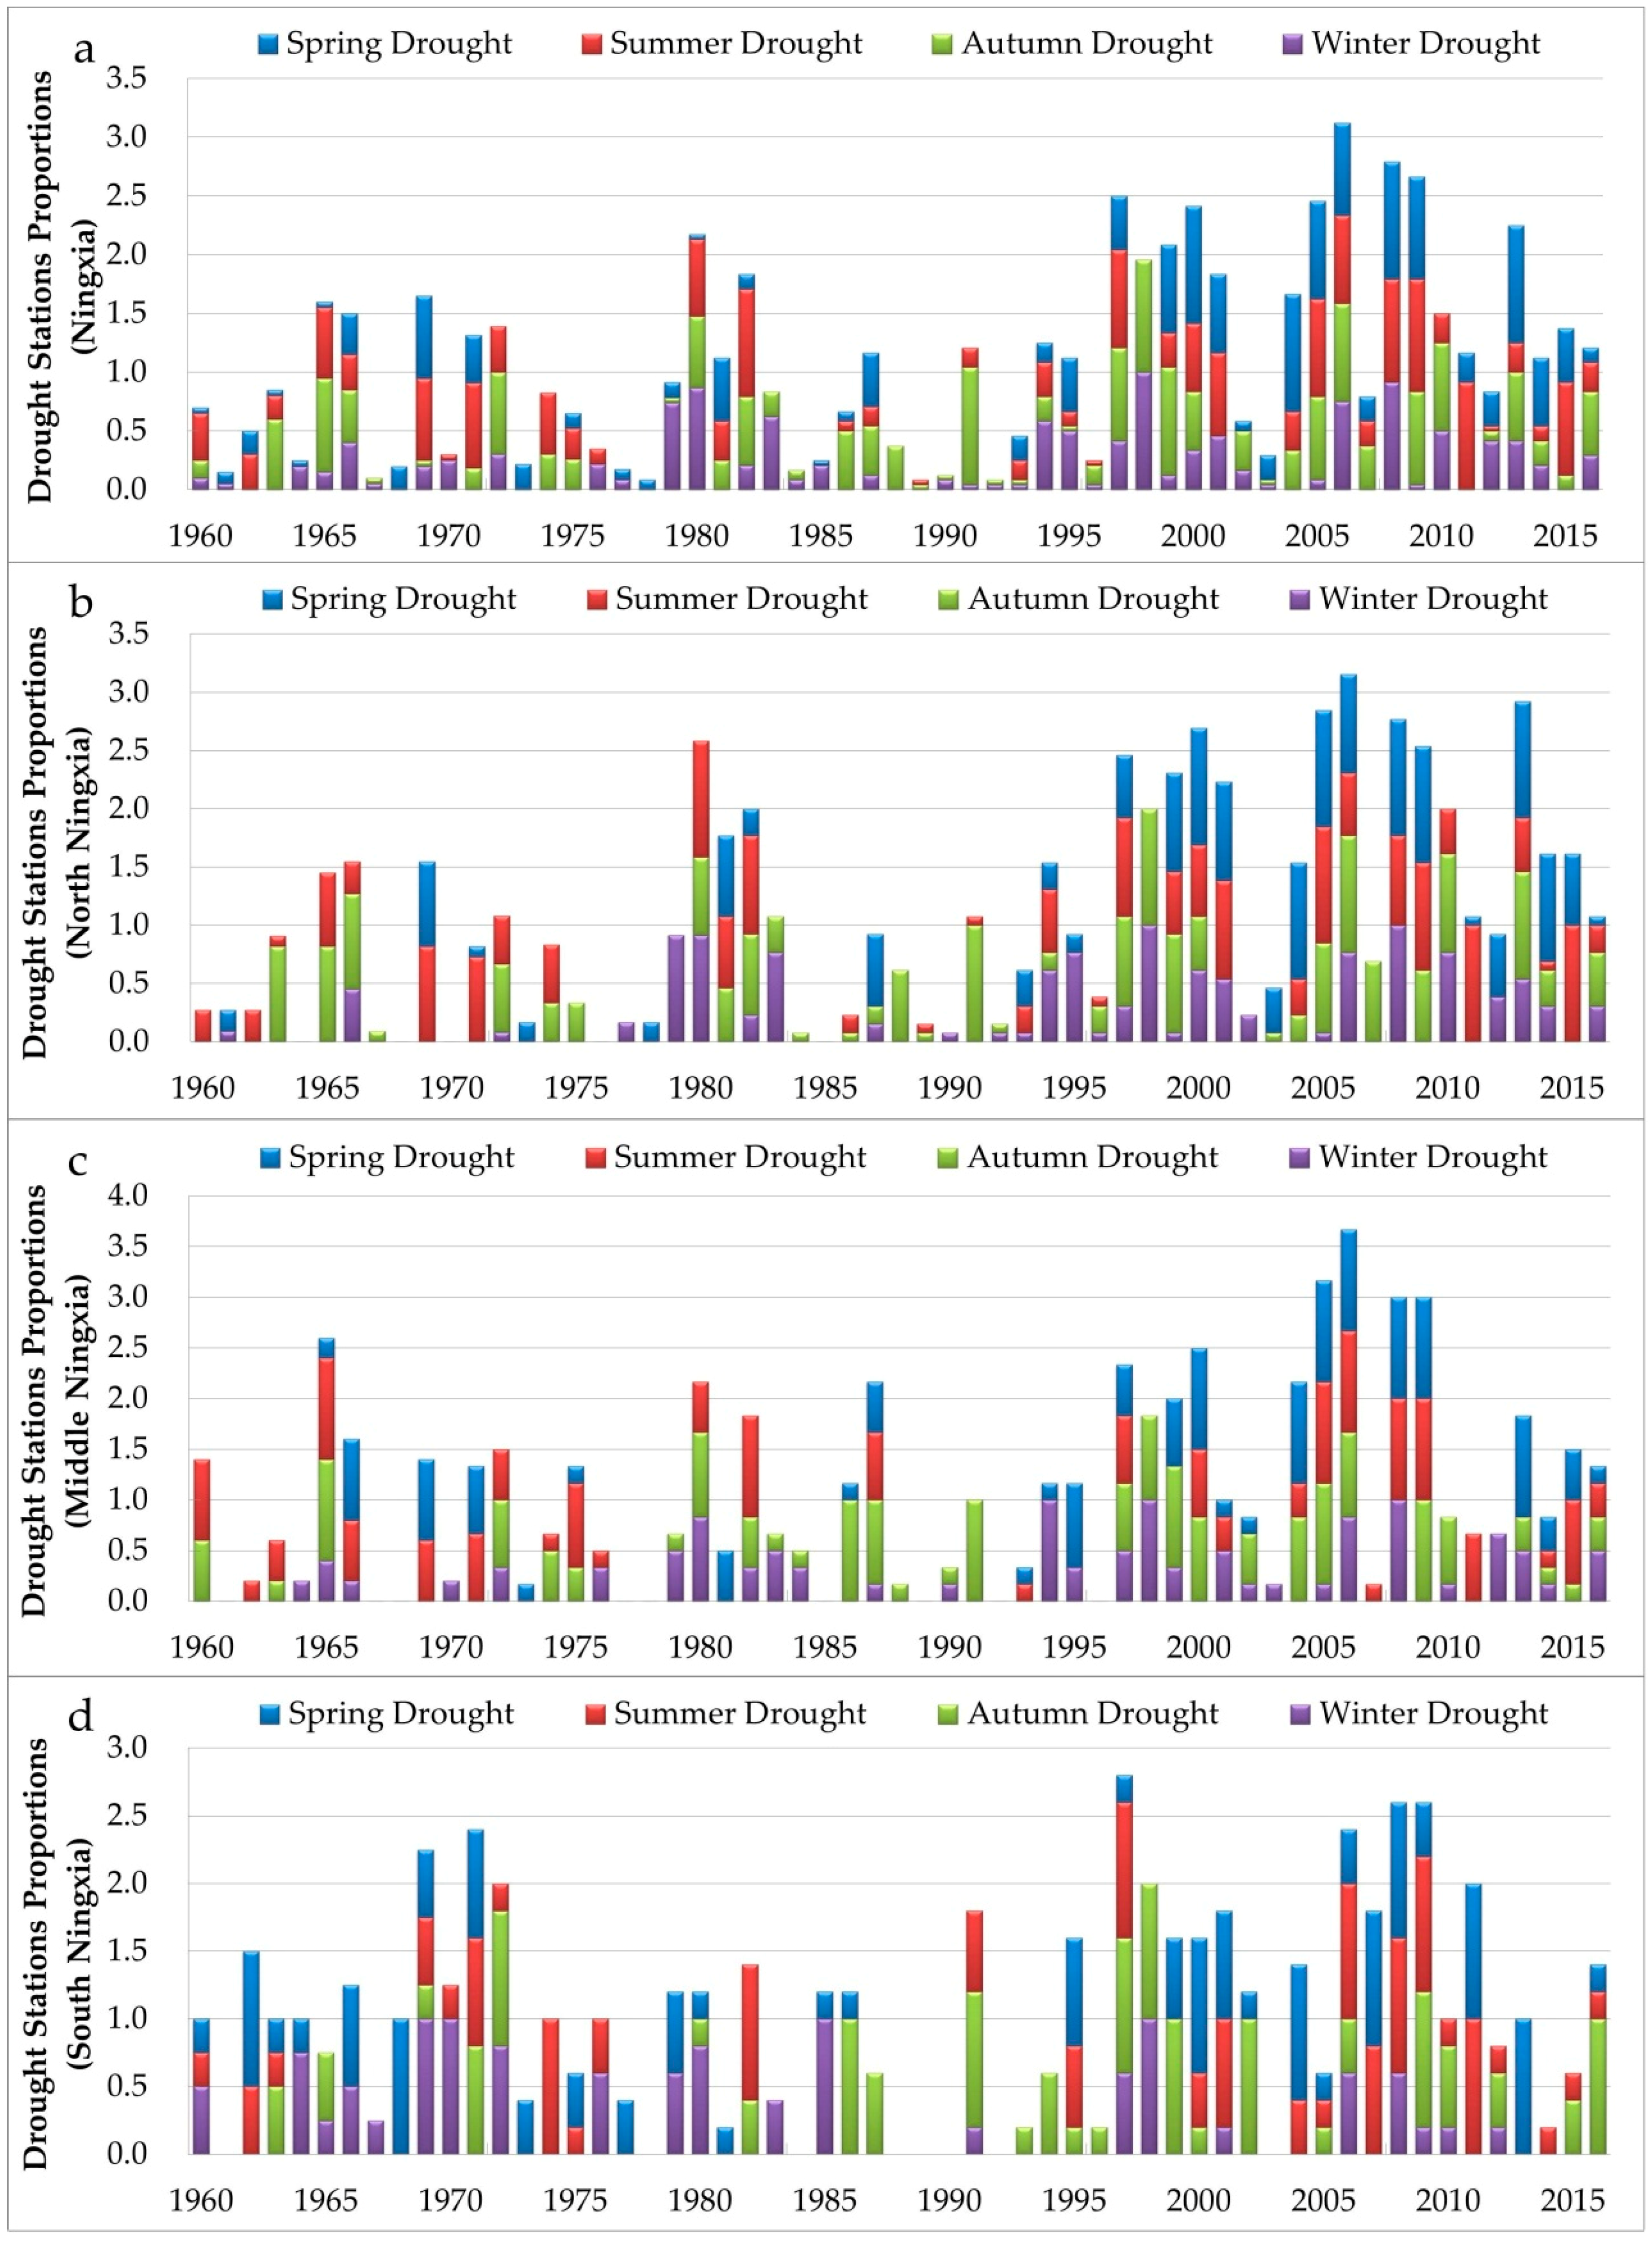
The SPEI3 values reflect the seasonal drought changes. The seasonal variation of droughts in the different regions of Ningxia is shown in Figure 5. The seasonal variation trend of the drought stations’ proportions in all of the regions showed comparable results; indeed, all of the drought stations’ proportions fluctuated throughout the year, yet a generally increasing trend could be detected with time. The mid-1980s to the mid-1990s showed a low drought occurrence, while it increased at later times.
The northern and the middle parts of Ningxia have the highest and most influential average annual drought stations’ proportions in autumn, which is followed by summer, and winter droughts have the least impact. The average spring drought stations’ proportions is the highest in southern Ningxia; it also has the biggest impact, followed by autumn, and winter has the smallest influence. Table 2 shows the different seasons in the numbers of years and the particular years of the full-scale drought (Pj ≥ 70%) occurred in the whole and three sub-regions.
3.1.3. Seasonal Temporal Evolution of Different Drought Degrees
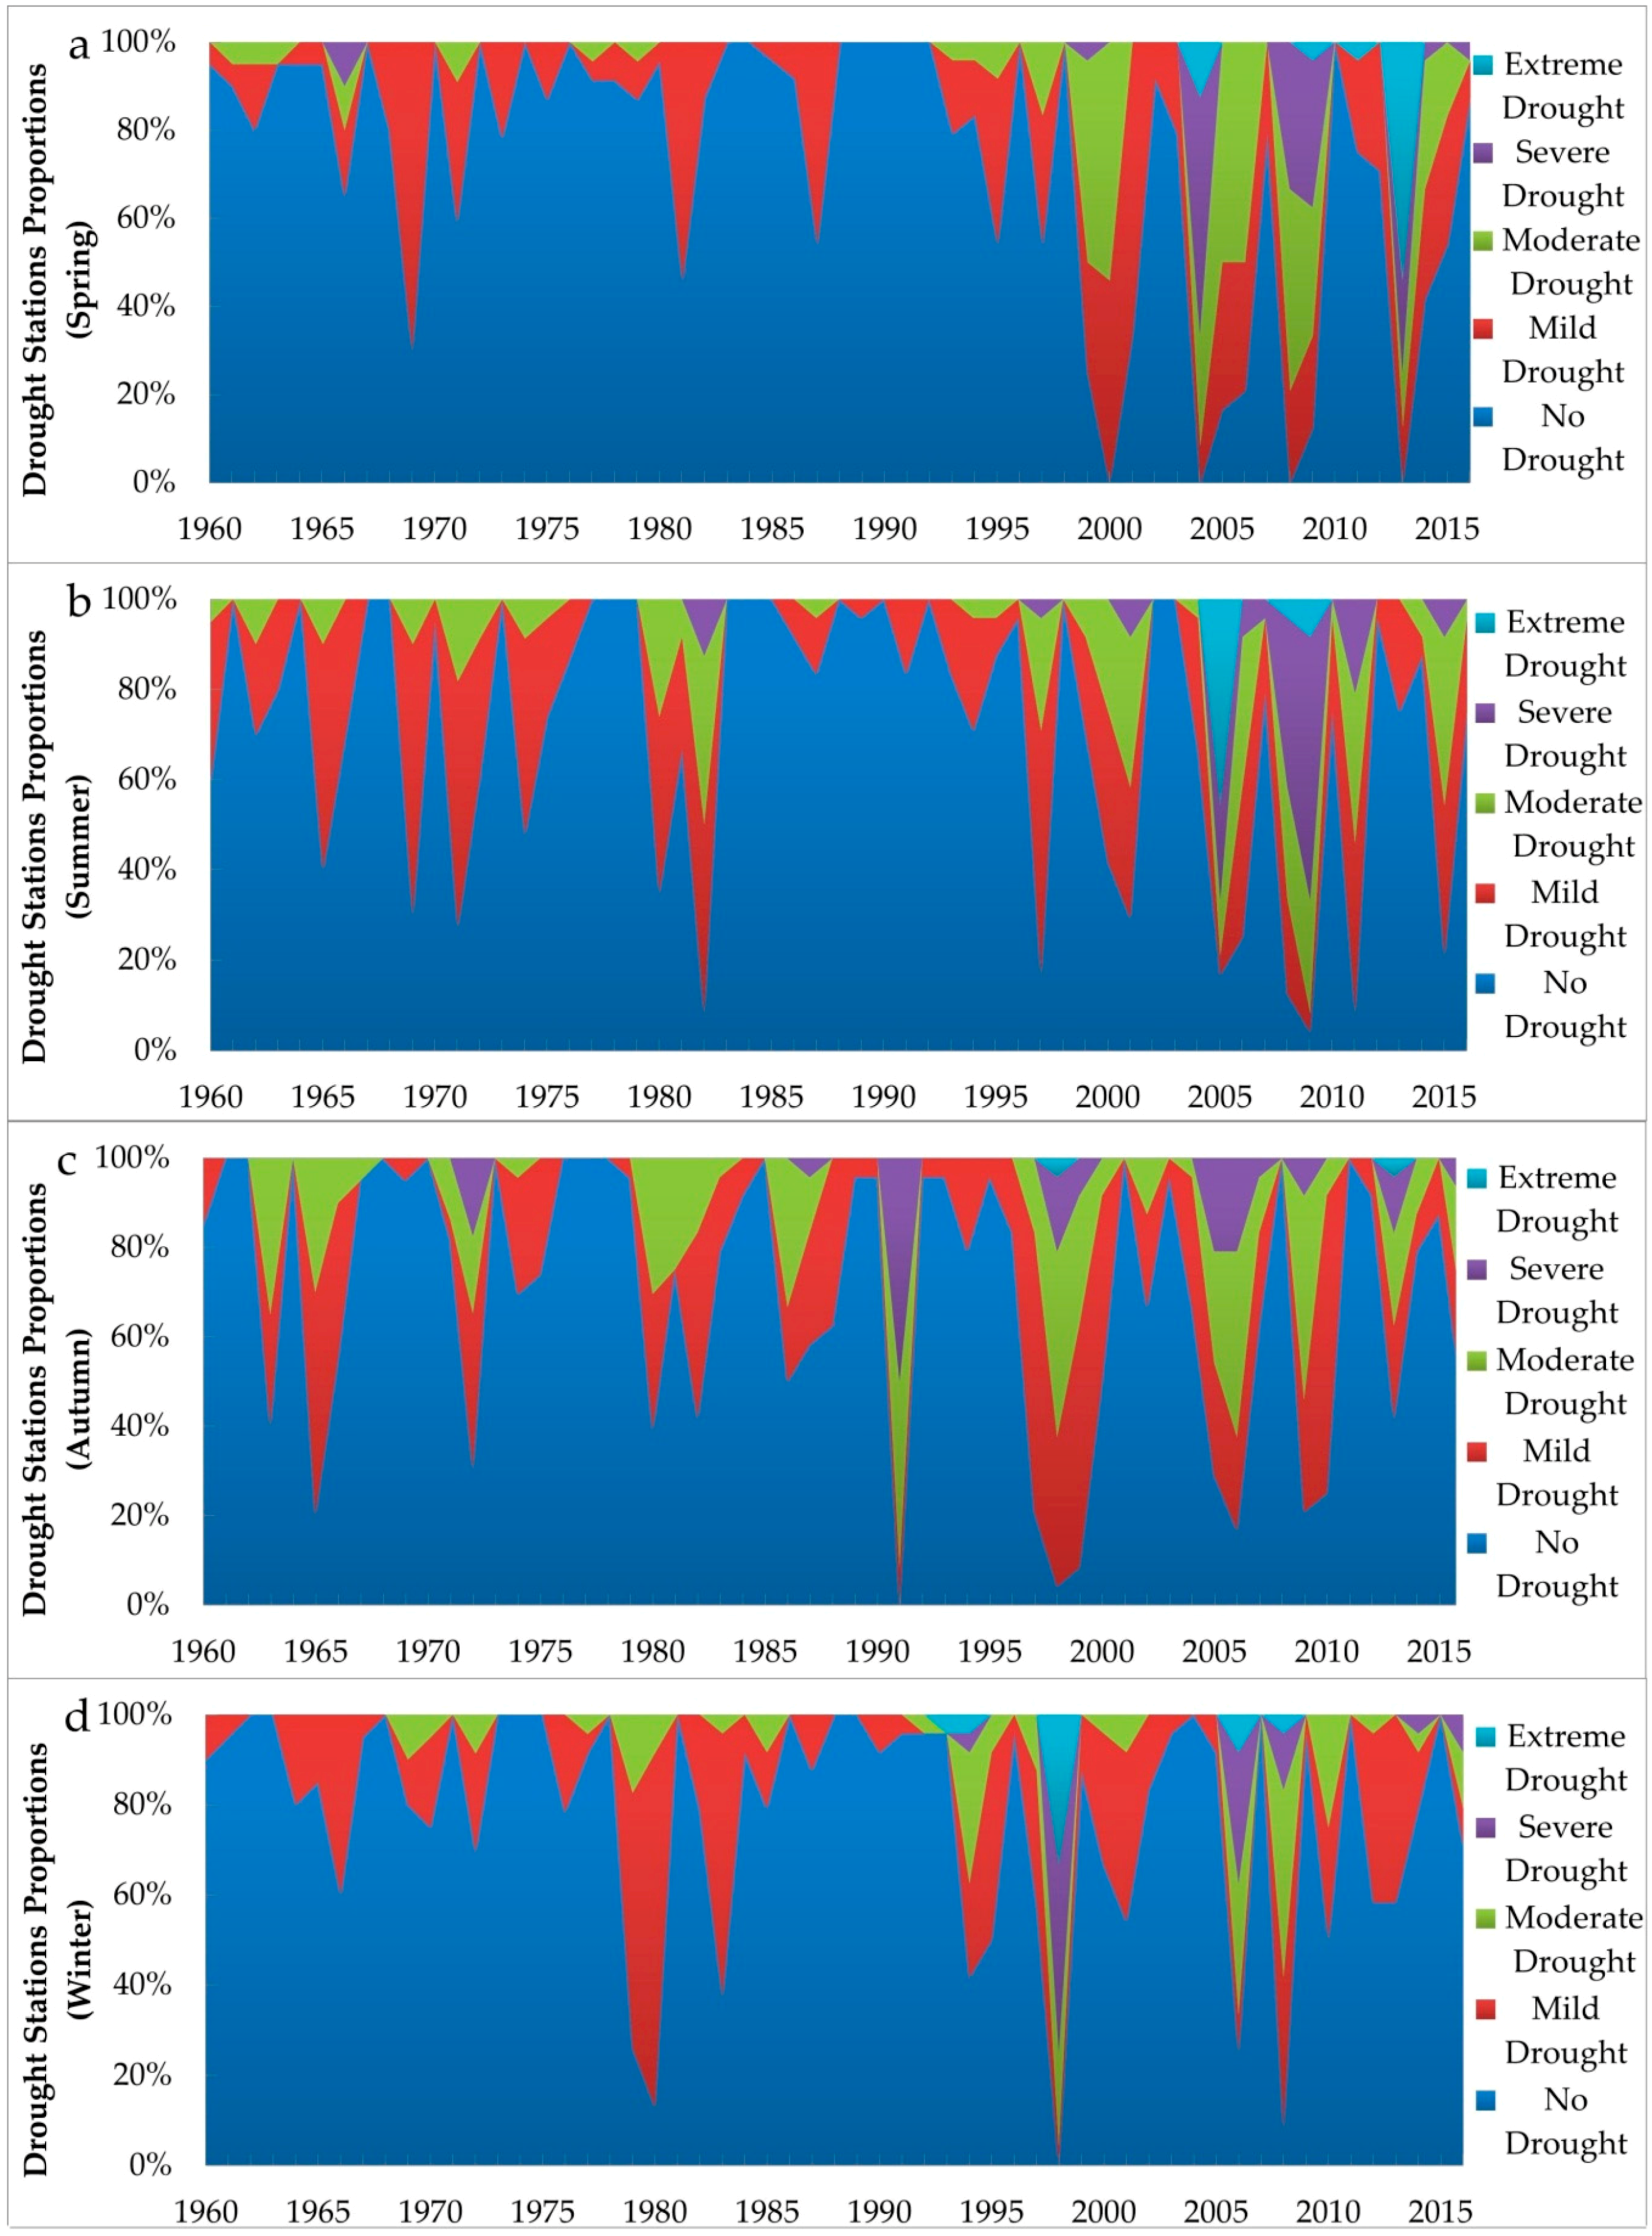
There are seasonal differences in the occurrence of different drought degrees. The SPEI3 values at the three sub-regions of Ningxia were classified according to the drought degrees present in Table 1. Figure 6 shows the drought stations’ proportions, on a yearly basis, of different drought degrees during the four seasons; the characteristics of the occurrence of different drought degrees during the different seasons are clearly observed. In general, the proportion of drought degrees in each season showed a yearly increasing trend. From the mid- to late-1980s until the mid-1990s, the drought degrees were relatively low; indeed, mild or moderate droughts occurred only during several years. However, the proportion of moderate and severe droughts noticeably increased in the mid- and late-1990s.
In spring, the years with the highest drought stations proportions are 2000, 2004, 2008, and 2013. Different degrees of droughts occurred at all of the sub-regions, and spring was the season with the highest occurrence of extreme droughts. In summer, the years with the highest drought stations proportions, which were more than 80%, are 2000, 2004, 2005, 2009, 2008, and 2013. It was the highest season for severe and mild droughts. In autumn, the highest drought stations’ proportions, which were also more than 80%, were seen in 2000, 2004, 2008, 2013, and 2009, and it was the season with the highest moderate drought. The years 2000, 2004, and 2008 showed the highest drought stations’ proportions (more than 80%) in winter, which was the lowest season for the drought. It can be seen that spring and summer are the seasons with the most severe and extreme droughts; both showed an increasing trend, especially when the summer rainfall is more abundant, yet the drought is even more serious. This is because the SPEI uses the amount of water deficit instead of the pure precipitation as an important indicator for drought assessment, and it is a monthly cumulative data set. Finally, the influence of little rain during the winter (until the spring of the following year), the spring winds, and the evaporation caused by high temperatures in summer play an important role in the formation of droughts.
3.2. Spatial Characteristics of Drought in Ningxia
3.2.1. Spatial Characteristics of Multi-Scale Drought Occurrence Times
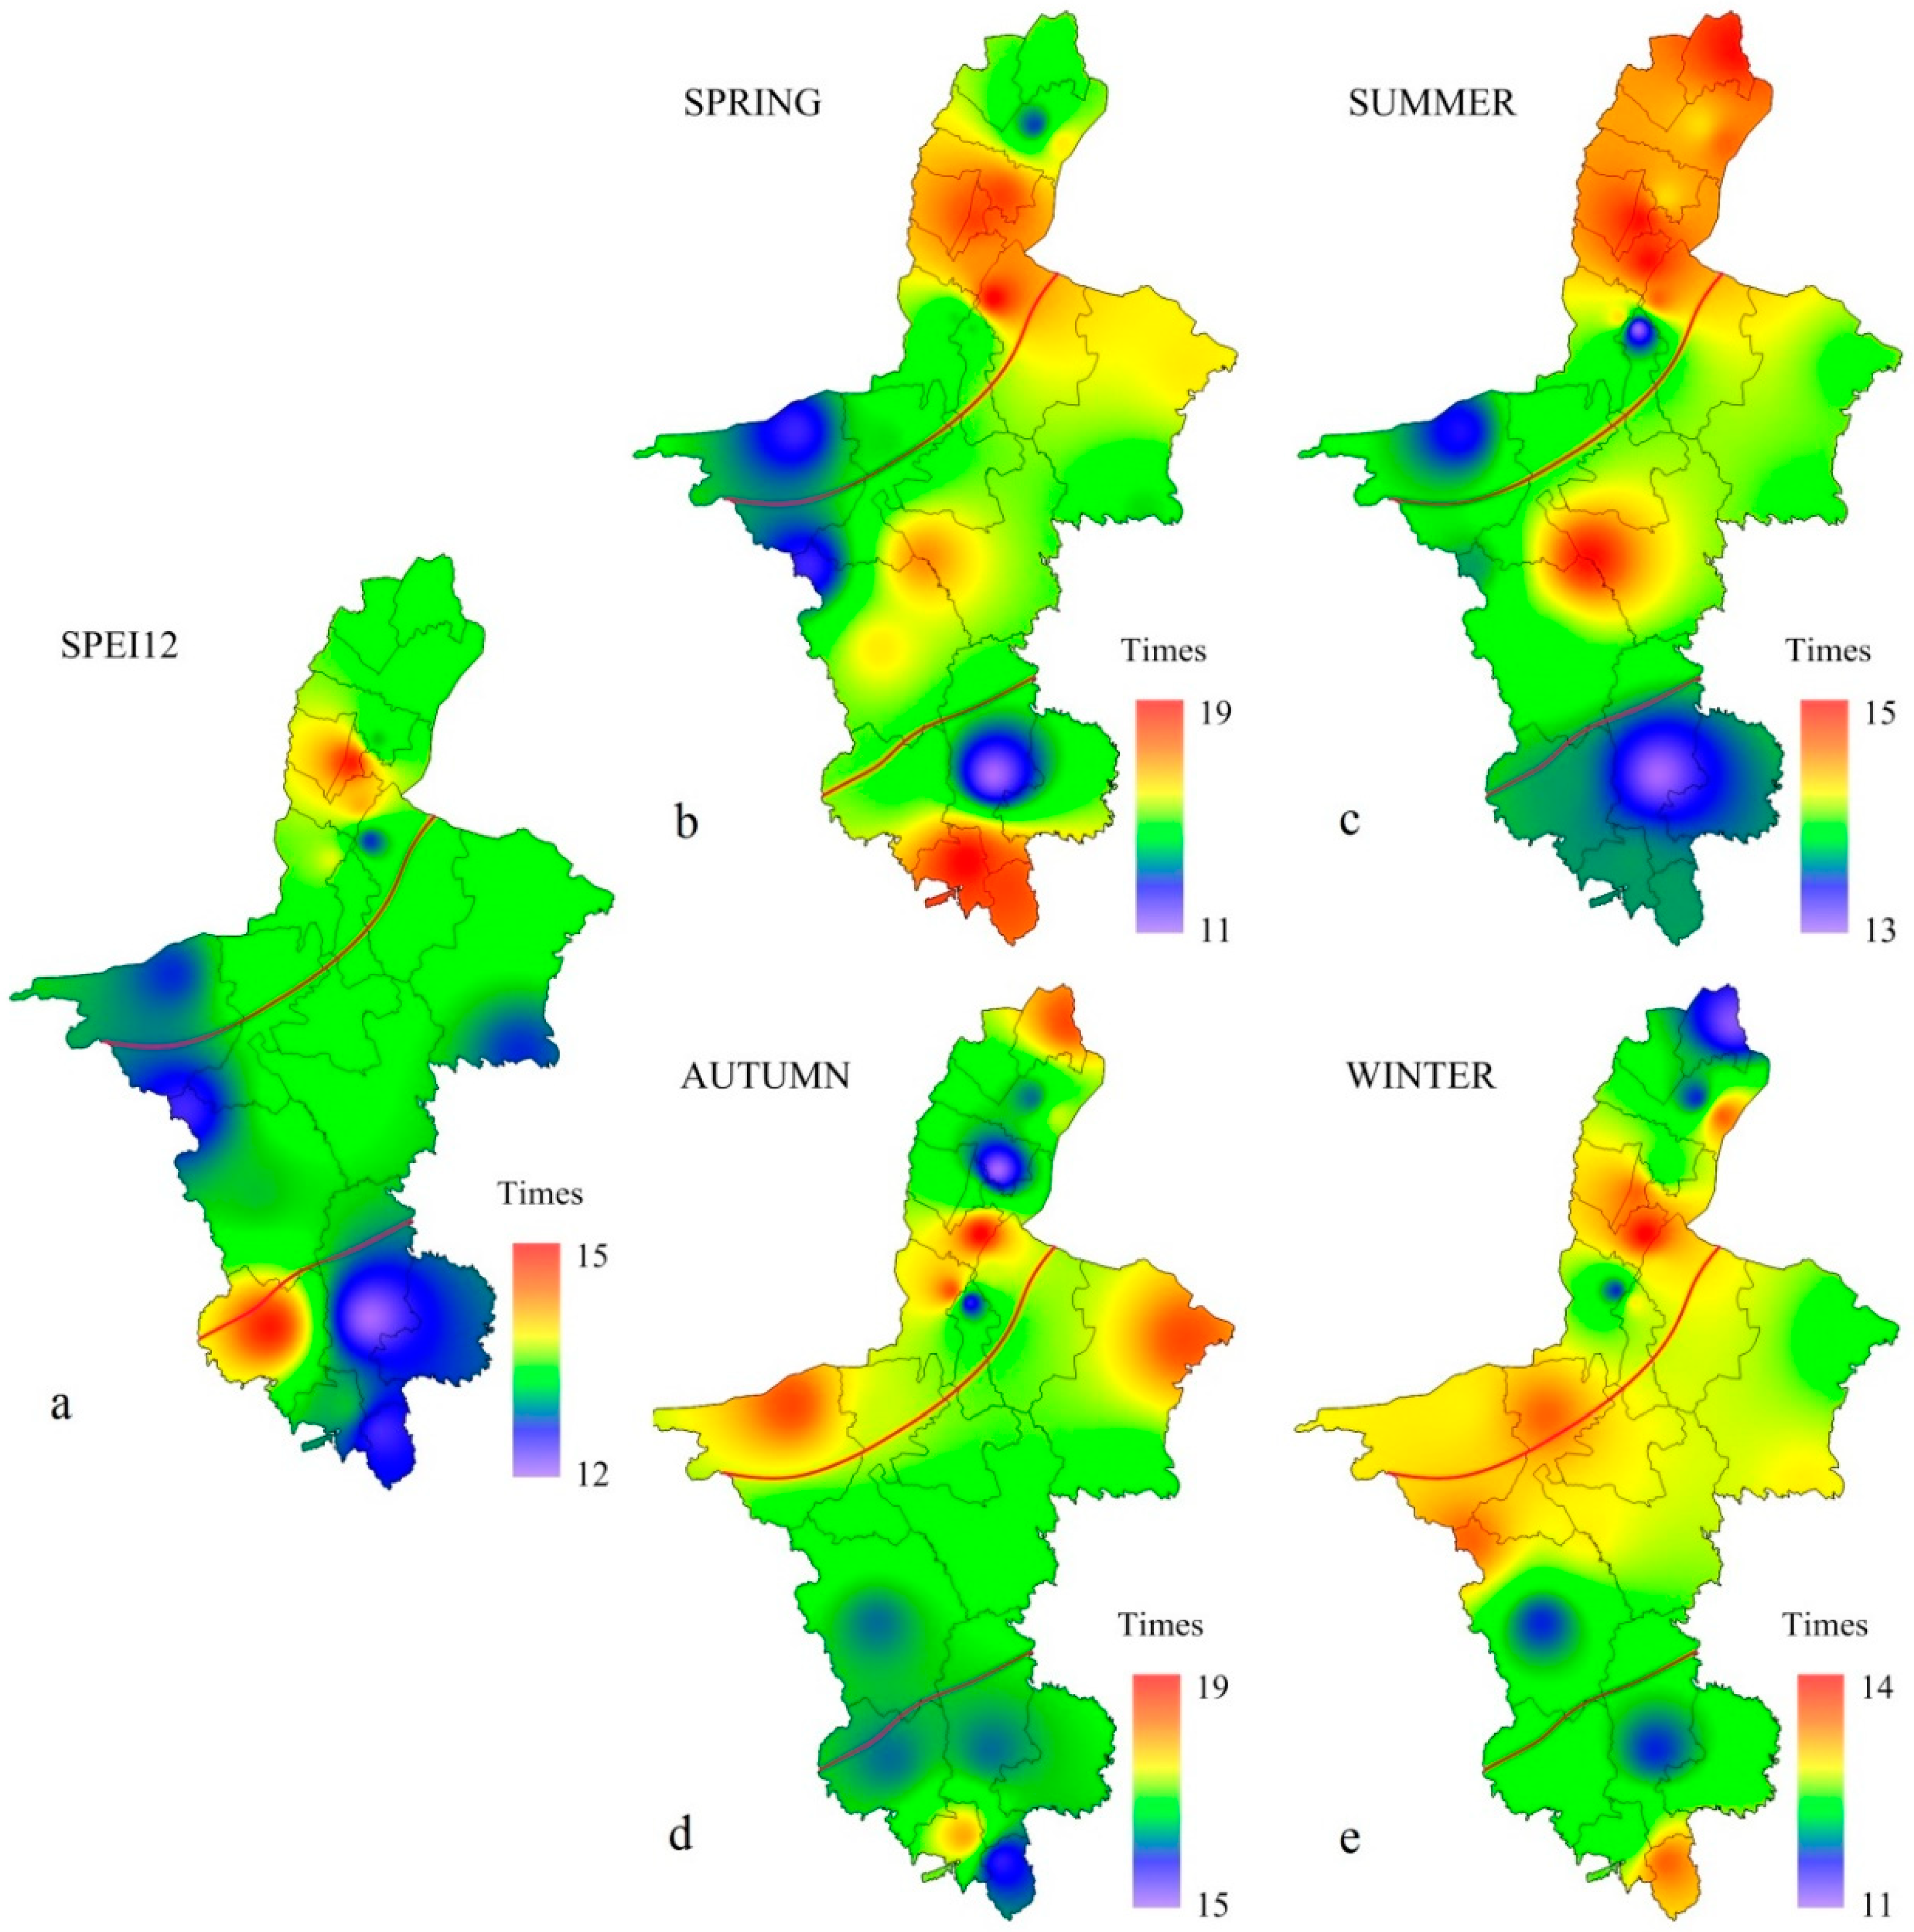
The number of drought occurrence times in each meteorological station in Ningxia, between 1960 and 2016, showed a certain trend in terms of the spatial distribution. The interannual average values of the SPEI12 and SPEI3 in each season were calculated; if the average value was <−0.5, it was considered that the drought occurred at this station one time. The inverse distance weighted interpolation was adopted to draw the contour map of the drought occurrence times (Figure 7). The maps show that the numbers of drought occurrence times varied throughout the different seasons. Overall, the number of drought occurrence times in the northern region was higher than other regions, based on the SPEI12 and SPEI3 values. Droughts happened 15–16 times on average during 1960–2016 for the SPEI12 (Figure 7a). The largest number of drought occurrence times is in the north and the least in the center. Indeed, the stations with the highest number of drought occurrence times are Yinchuan in the north (20 times) and Xiji in the south (20 times), while the least number occurred in central Xingren (13 times) and southern Guyuan (12 times). During spring (Figure 7b), a drought occurred 16–17 times on average, with the highest times in the south and the least in the middle. The highest time appeared in Lingwu in the north (19 times) and Longde in the south (19 times), and the minimum was detected for southern Guyuan (11 times) and central Xingren (12 times). During the summer (Figure 7c), the average number of droughts was 16–17 times, with the highest time in the north, namely Yinchuan, Yongning, Huinong, and Central Tongxi (19 times); the least time was detected in a part of the north and in the south, namely Wuzhong and Guyuan (13 times). During the autumn (Figure 7d), a drought occurred 16–17 times on average, with the most occurrences in the middle and the least in the south. The sites with the highest and lowest drought occurrence times are Yongning (21 times) and Helan (14 times), respectively, both located in the north. During the winter (Figure 7e), a drought occurred 12–13 times on average, with the largest occurrence times occurring in the north and the least in the middle. The site with the highest number of drought occurrences is Yongning in the north (15 times), and the least is north Huinon (10 times).
3.2.2. Spatial Distribution Characteristics of Drought Intensity
The SPEI1 reflects subtle changes in the drought situation. In order to fully reflect the spatial distribution characteristics of the drought intensity in the whole region, the statistical analyses were conducted throughout the duration of the drought events (SPEI1 < −0.5) at every meteorological station. Huinong was the site with the highest number of continuous drought months, which extended for more than three months. For 57 years, there were 29 successive droughts for three or more months in Huinong, followed by Yongning and Haiyuan (23 times), and the least was Longde (12 times). Yongning experienced the longest period of a continuous drought, which covered the period from October 2008 to October 2009 (i.e., for 13 months). The number of events that a continuous drought lasted for six or more months was 34, with the highest occurrence in Lingwu (four times), Wuzhong (three times), Xingren (three times), Tongxi (three times), and Guyuan (three times). Most of them took place in 1999 (four stations), 2005 (10 stations), and 2009 (8 stations). It can be seen that in 1999, 2005, and 2009, there was a large-scale continuous drought in Ningxia, which supports the results shown in Section 3.1.1.
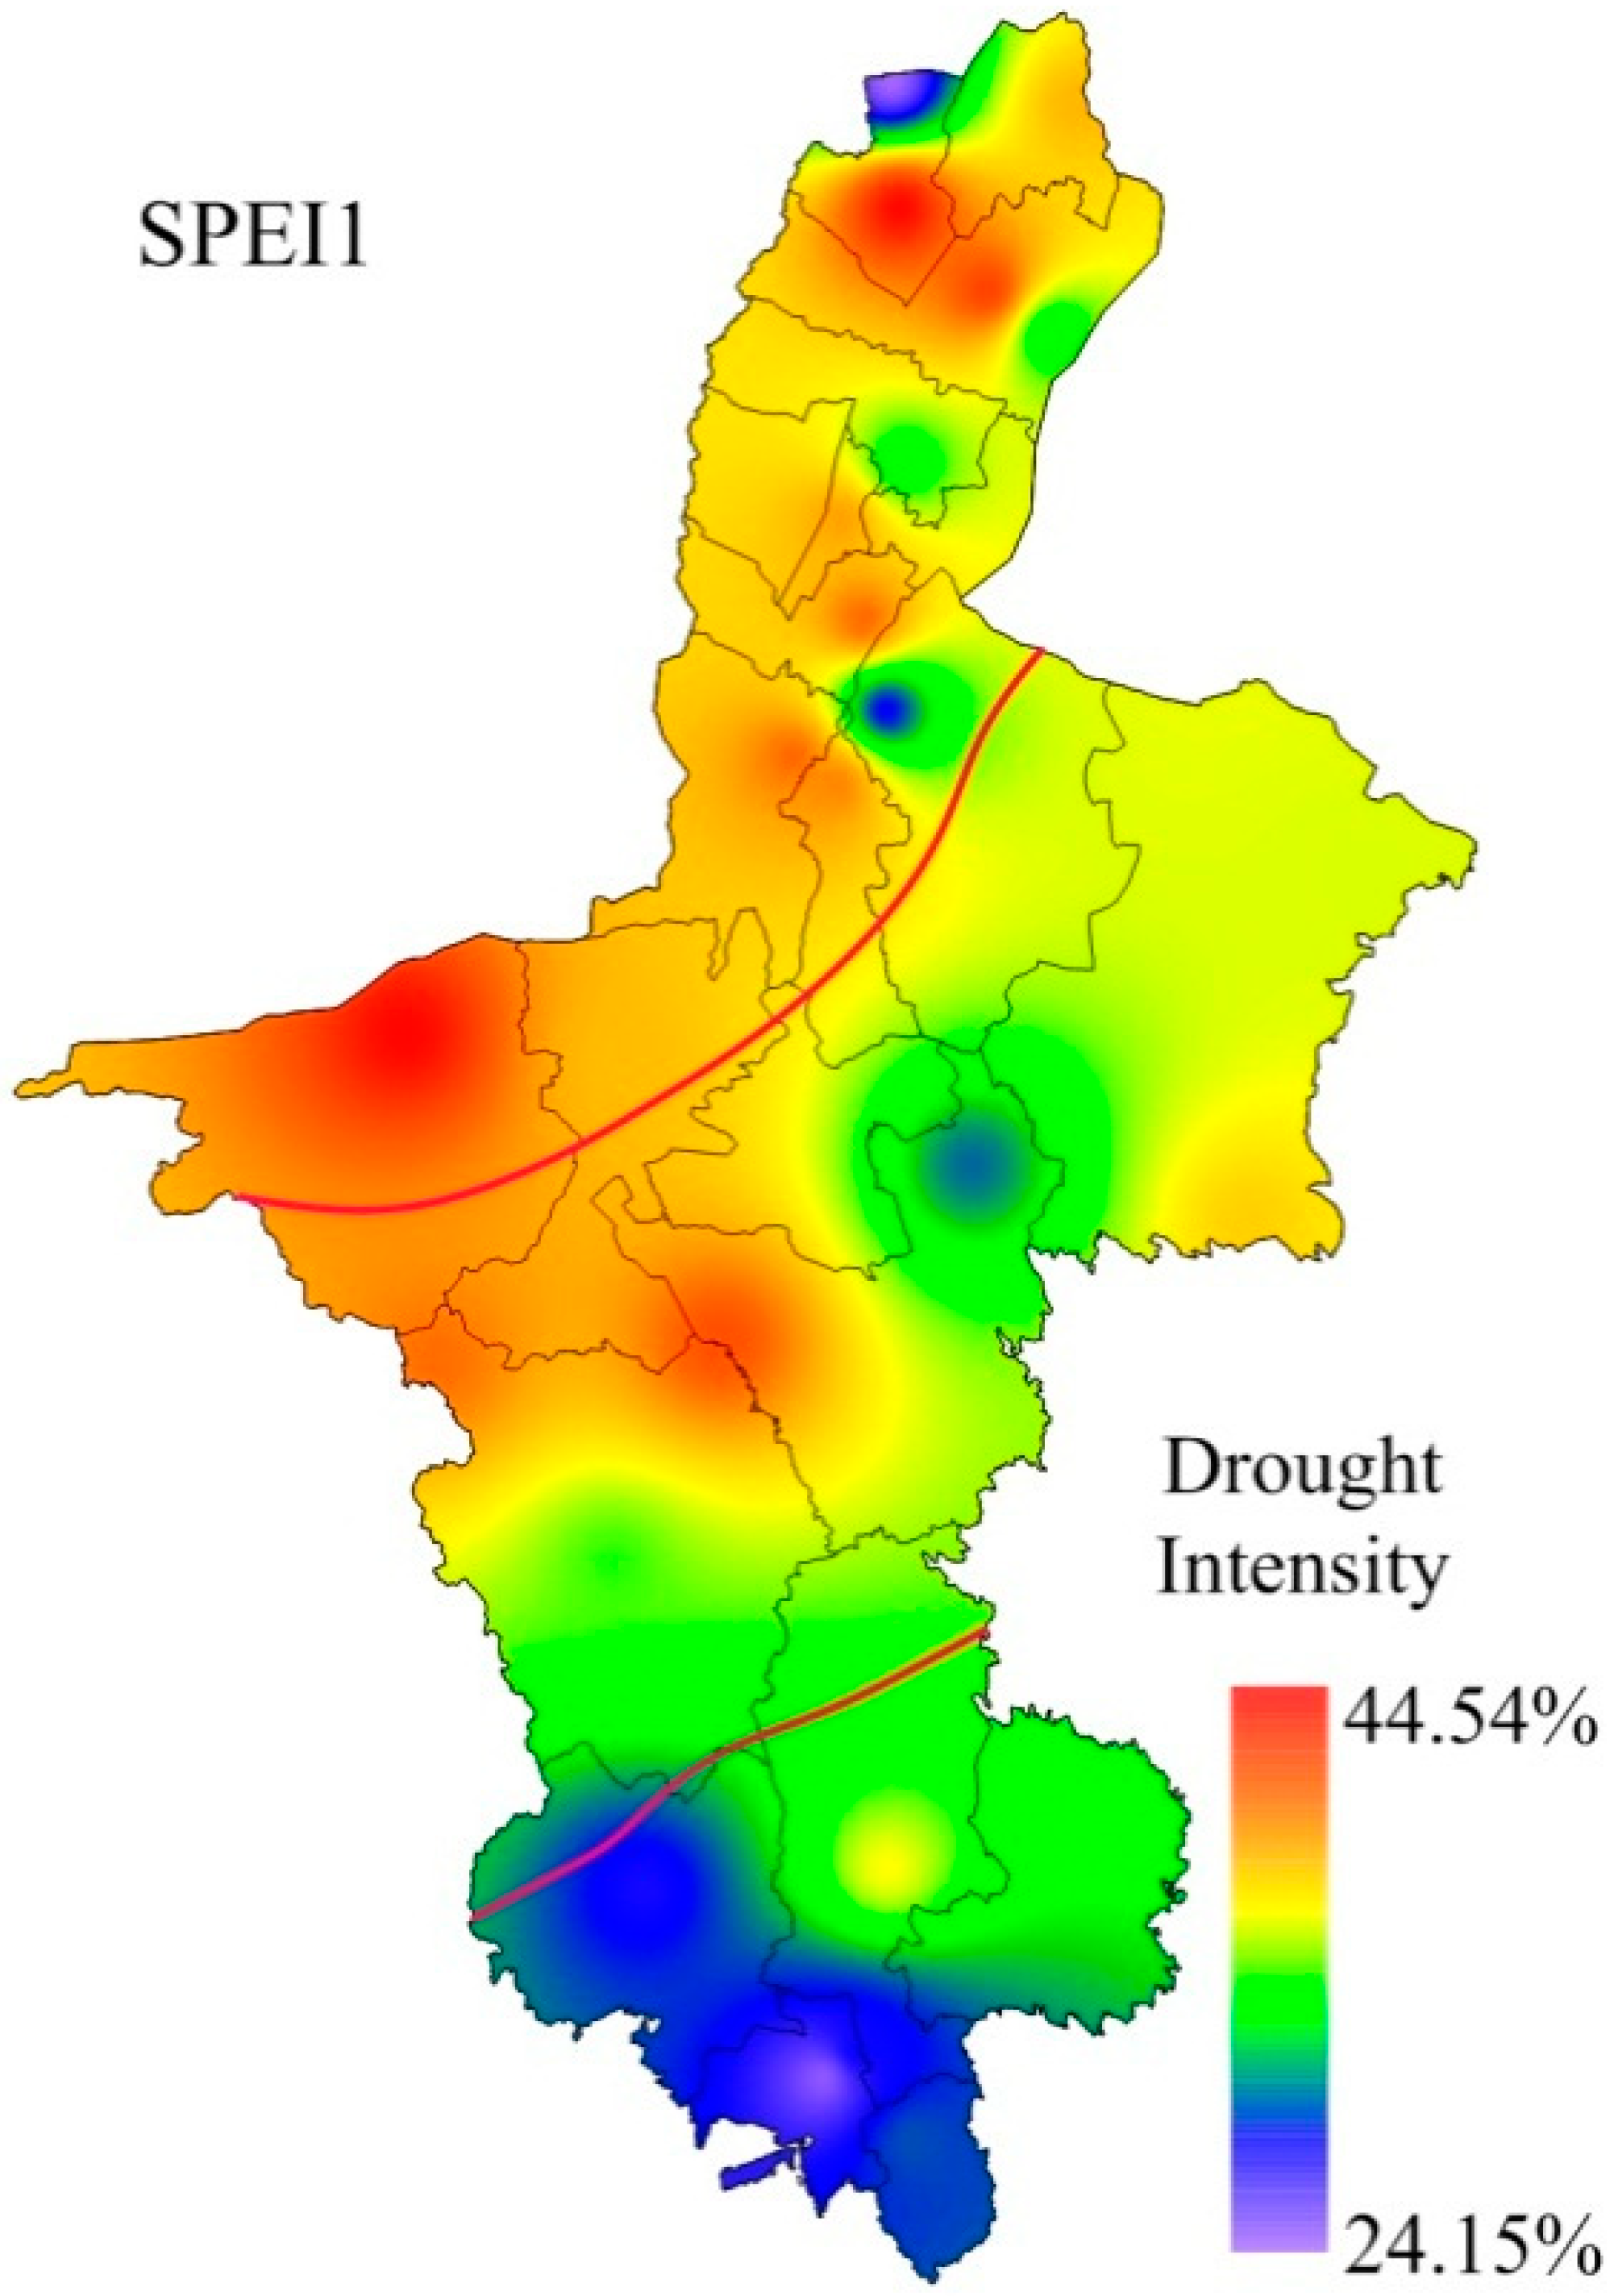
The drought intensity in Ningxia shows an increasing trend from the south to the north, and the inverse distance weighted interpolation was used to draw the spatial distribution map of the drought intensity (Figure 8). The drought intensity ranges from 24.15 to 44.54%, and it is generally higher in northern Ningxia, and the severest drought occurred in Zhongwei and Dawukou. The regions of Xingren and Tongxin in the middle area have a higher intensity of disasters, while Longde and Xiji, located in southern Ningxia, have the weakest intensity of drought.
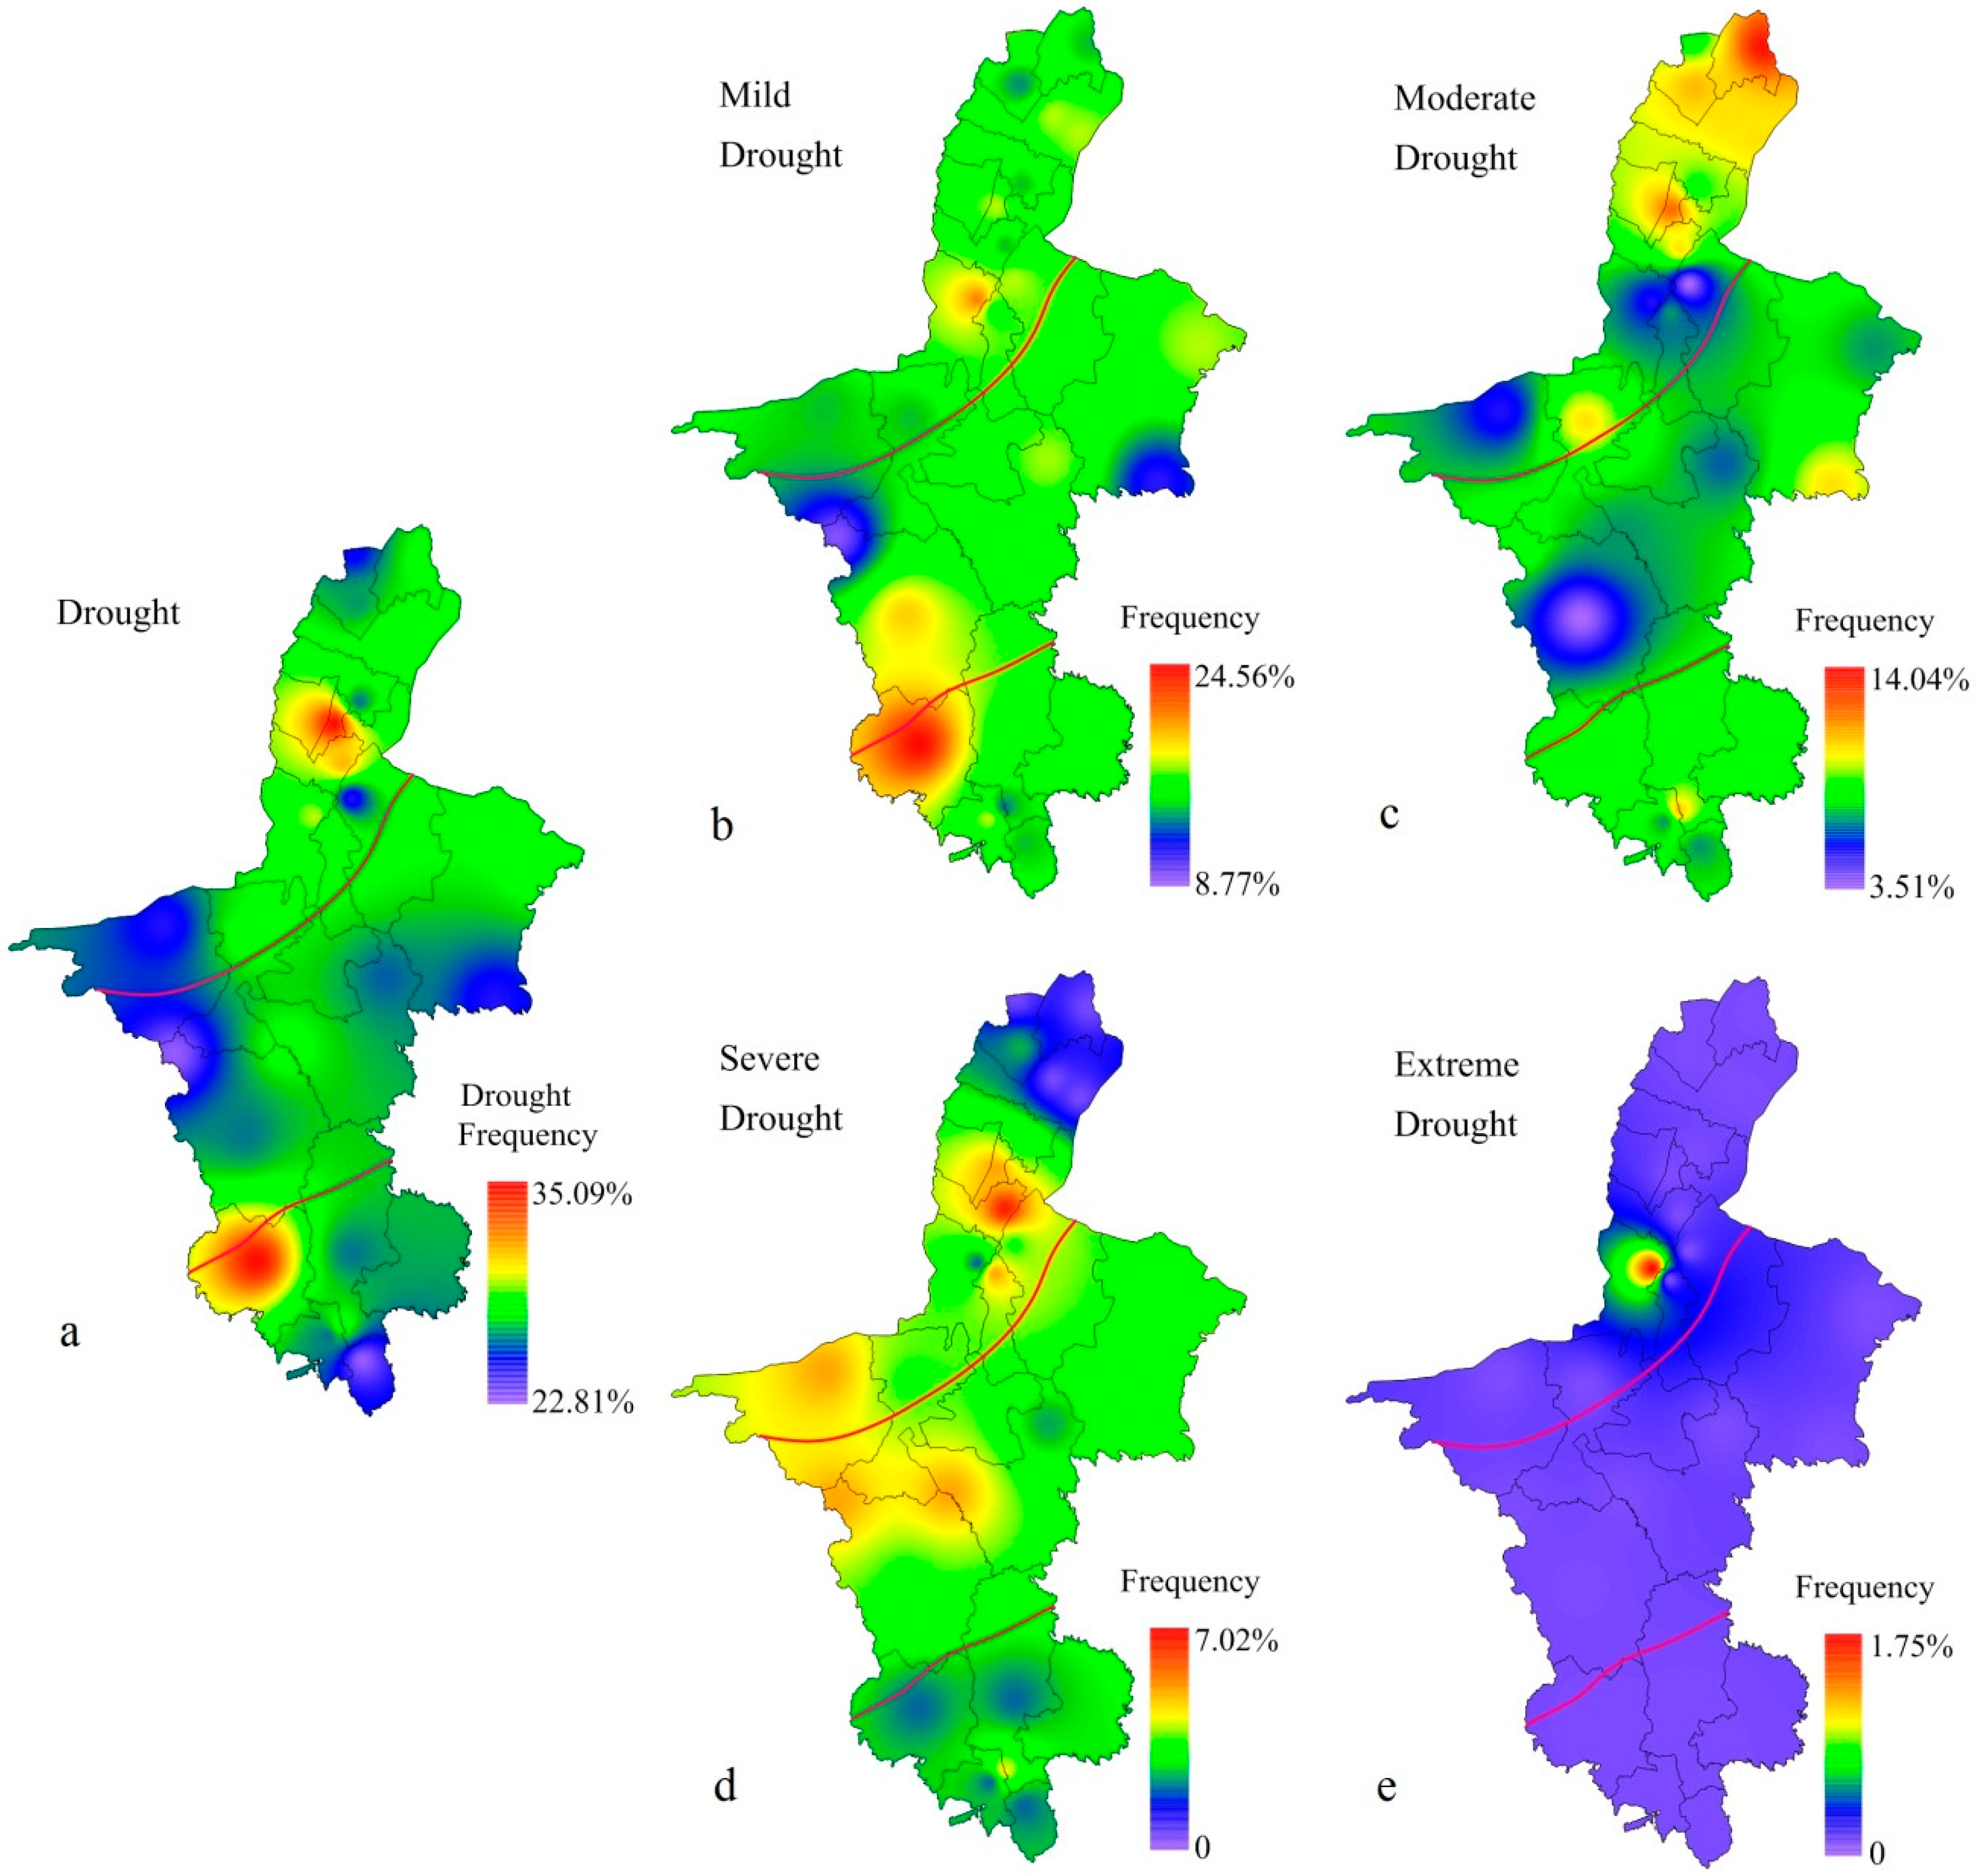
3.2.3. Spatial Characteristics of Drought at Different Degrees on SPEI12
Different degrees of drought on SPEI12 have different distributions in Ningxia. The inverse distance weighted interpolation was adopted to draw the spatial distribution chart of the drought frequency (Figure 9). The frequency of the drought in Ningxia ranged between 22.81 and 35.09% and averaged 27.44%. In terms of the grades, the frequency ranges of mild, moderate, severe, and extreme droughts were 8.77–24.56%, 3.51–14.04%, 0–7.02%, and 0–1.75%, respectively, and averaged 15.9%, 8.48%, 3%, and 0.07%, respectively. It should be noted that the more severe droughts showed lower frequencies of occurrence.
From a spatial point of view, the highest frequency of drought occurred in northern Yinchuan and southern Xiji (>35%), and the lowest occurred in central Xingren and southern Jingyuan (<23%) (Figure 9a). The highest frequency of mild drought was seen in the southern Xiji and northern Qingtongxia regions (>20%), while the lowest was detected in the central Xingren and Mahuangshan regions (<10%) (Figure 9b). As for the moderate droughts, the highest frequency was observed in northern Huinong and Yinchuan (>12%), and the lowest was detected in southern Haiyuan and northern Lingwu (<5%) (Figure 9c). Moreover, Yongning in the north (7.02%) showed the highest frequency of severe drought (Figure 9d), which occurred in 2005–2006 and 2008–2009. Extreme droughts did not occur in most parts of Shizuishan; the extreme drought only occurred in northern Qingtongxia (Figure 9e) in 2006 (which is consistent with the results presented in the previous section).
3.3. Wavelet Analysis of the Temporal Evolution of Drought Based on SPEI12
3.3.1. Interannual Variable Characteristics of Regional Drought
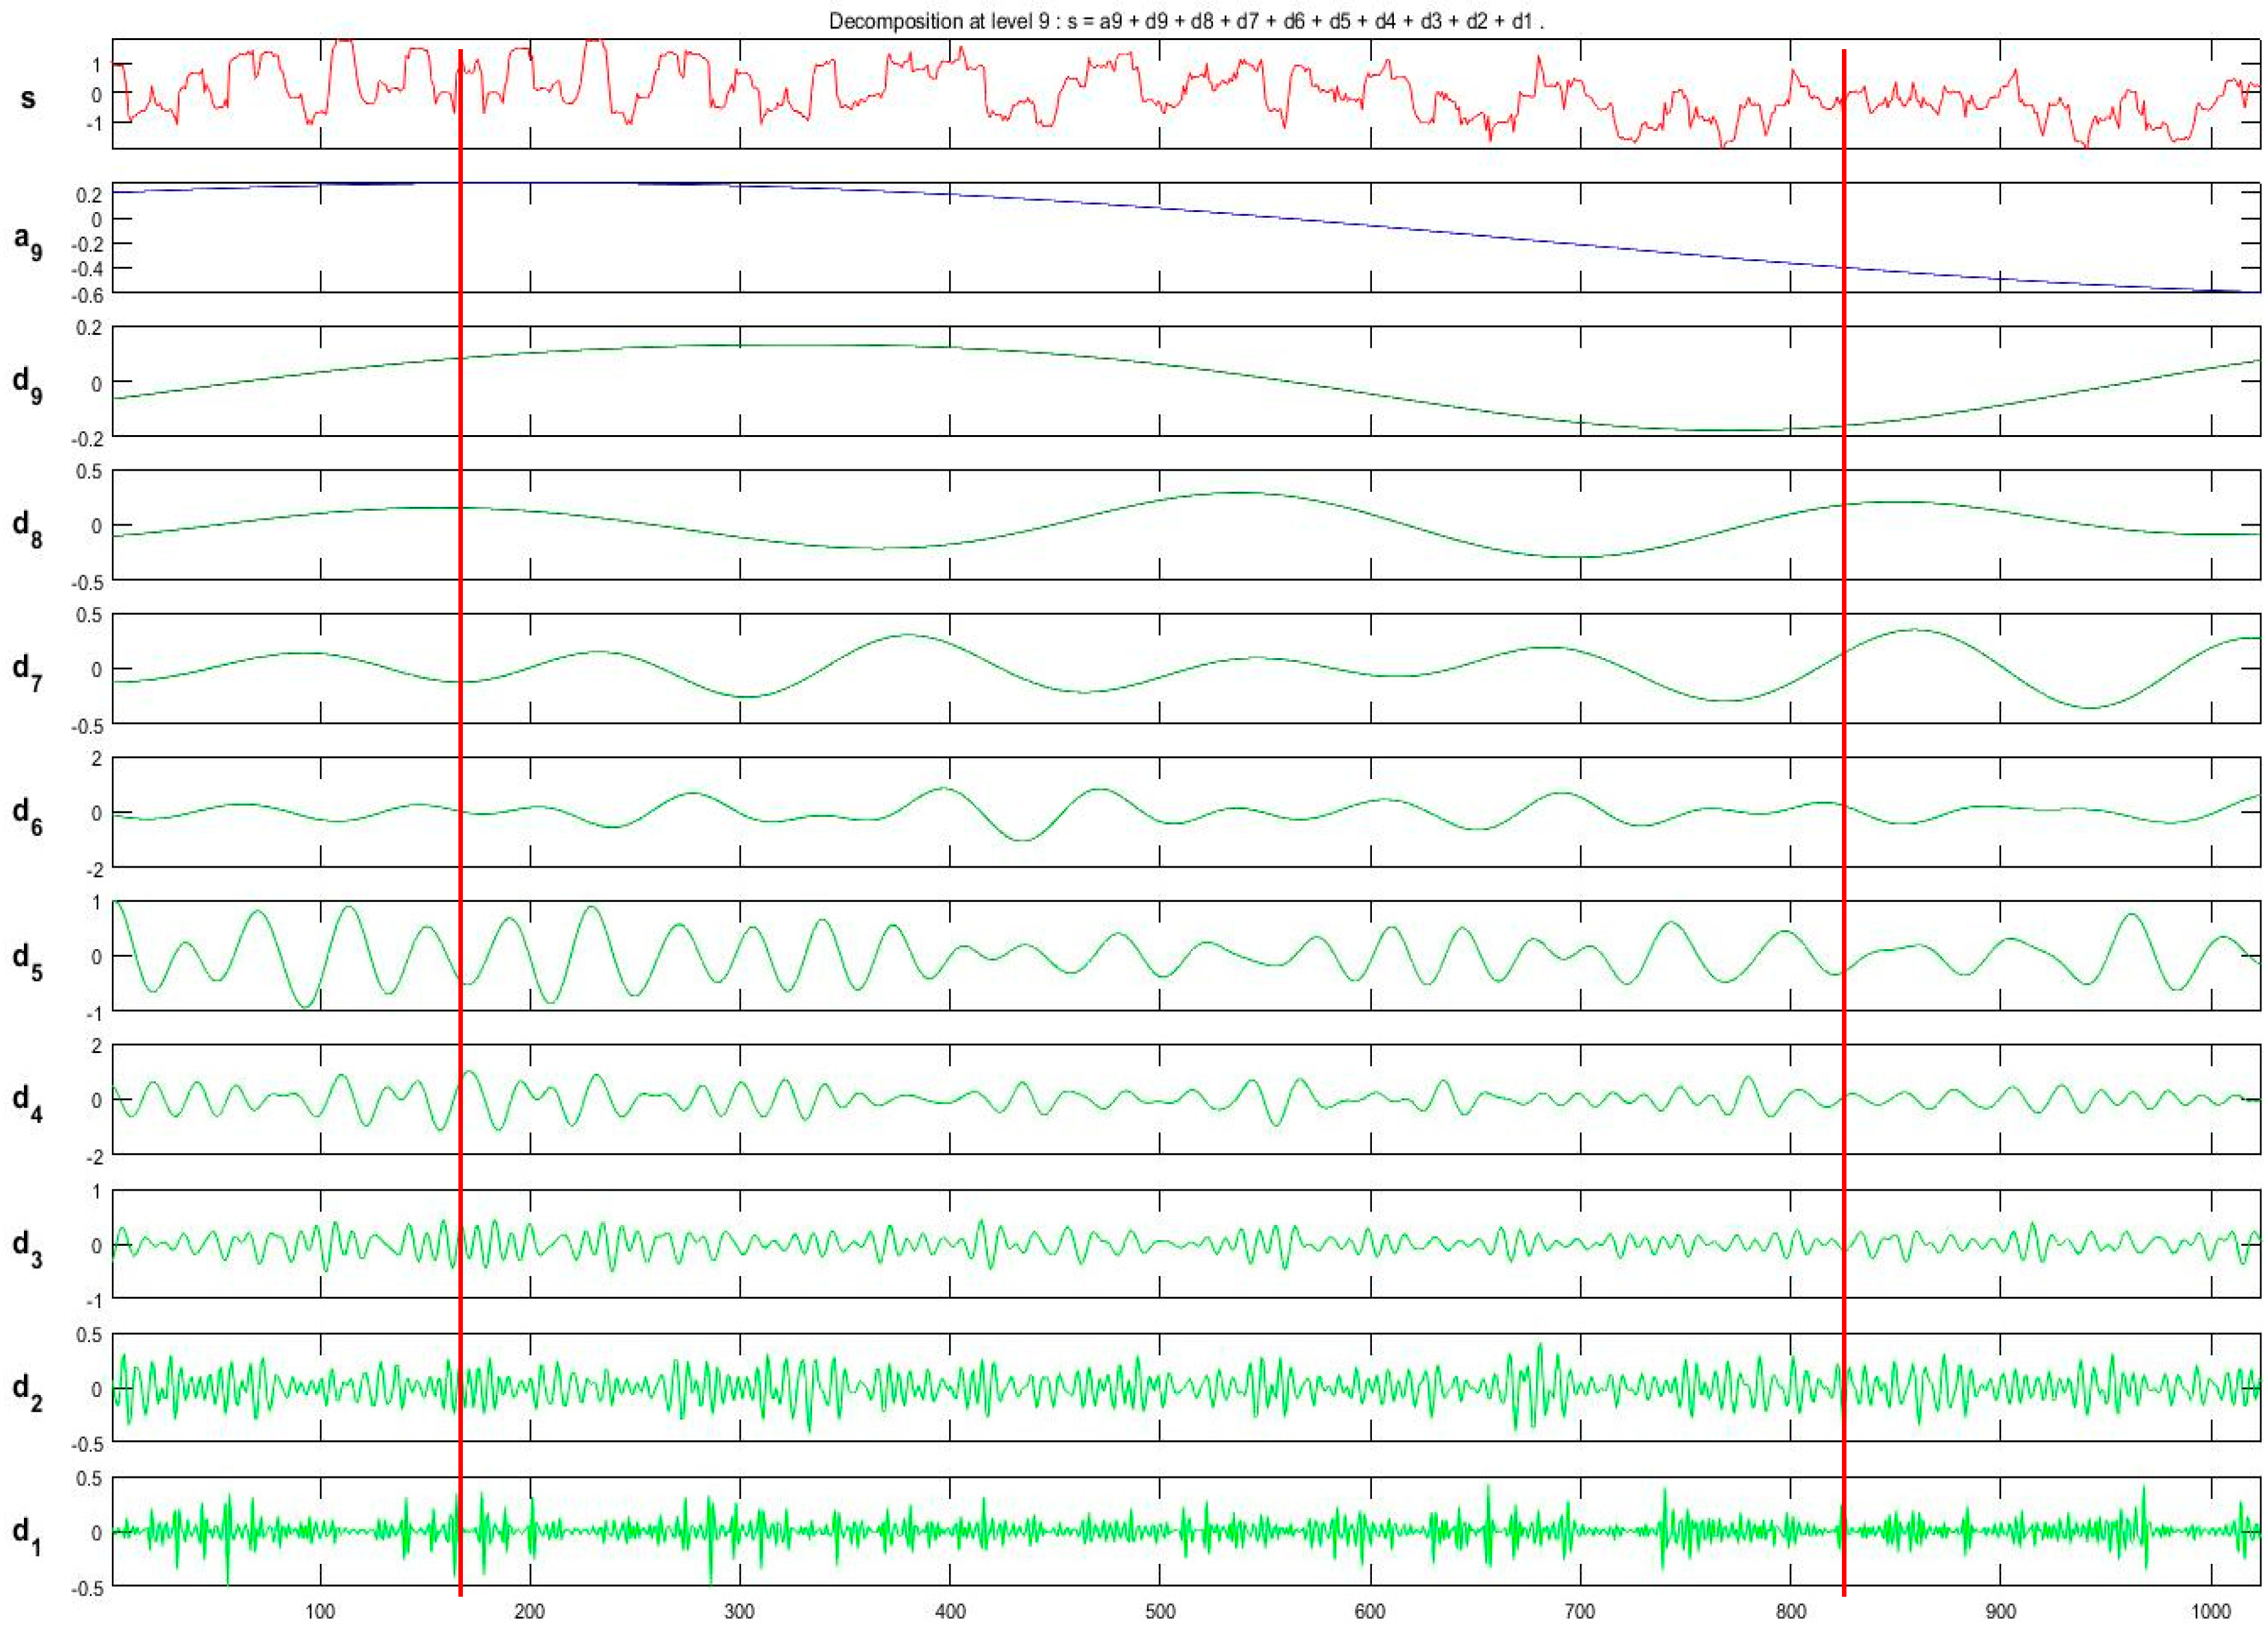
A demy wavelet was chosen as the wavelet basis function; the wavelet decomposition was conducted on a monthly basis by the SPEI12, from 1960 to 2016 (684 months) in Ningxia. Therefore, the periodical and mutability characteristics of the droughts were analyzed. To eliminate the ′boundary-utility′possibly emerging between the two ends of the inter-sequence, the ′symmetry-extending at both ends′ method was used to extend the original time series data forward and backward, symmetrically, by 170 units, thus extending from 684 to 1024 points. The Morlet wavelet function algorithm was used to conduct the nine-layer wavelet decomposition (Figure 10).
From the low-frequency component, the general trend of droughts in Ningxia during the past 57 years has been constant. Combined with the analysis in the previous section, it can be seen that the overall drought situation seriously increased and severely developed in Ningxia. From the low-frequency component, , it can be seen that the drought change in Ningxia includes two periods, that is, a long period of 28.5 years, as well as the four low-frequency components, , which contain 4.5, 8, 17, and 30 cycles, respectively; therefore, the variation of drought in Ningxia has cycles of 12.7, 7.3, 3.4, and 1.9 years, respectively. From the high-frequency component, , it can be seen that during the cycles of 4, 8, and 16 months, there is some fluctuation in the amplitude of the frequency. At point 235–245, point 285–295, point 310–320, point 510–520, point 545–555, point 620–630, point 645–655, point 750–760, and point 820–830, the wavelet coefficients increase, which indicates that the drought events occurred in these time points. The mutational time point corresponds to the summer of 1965, the autumn of 1969, the autumn of 1971, the summer of 1988, the spring of 1991, the summer of 1997, the autumn of 1999, the summer of 2008, and the spring of 2014; those findings are in line with the actual situations.
3.3.2. Periodicity of Drought Variations
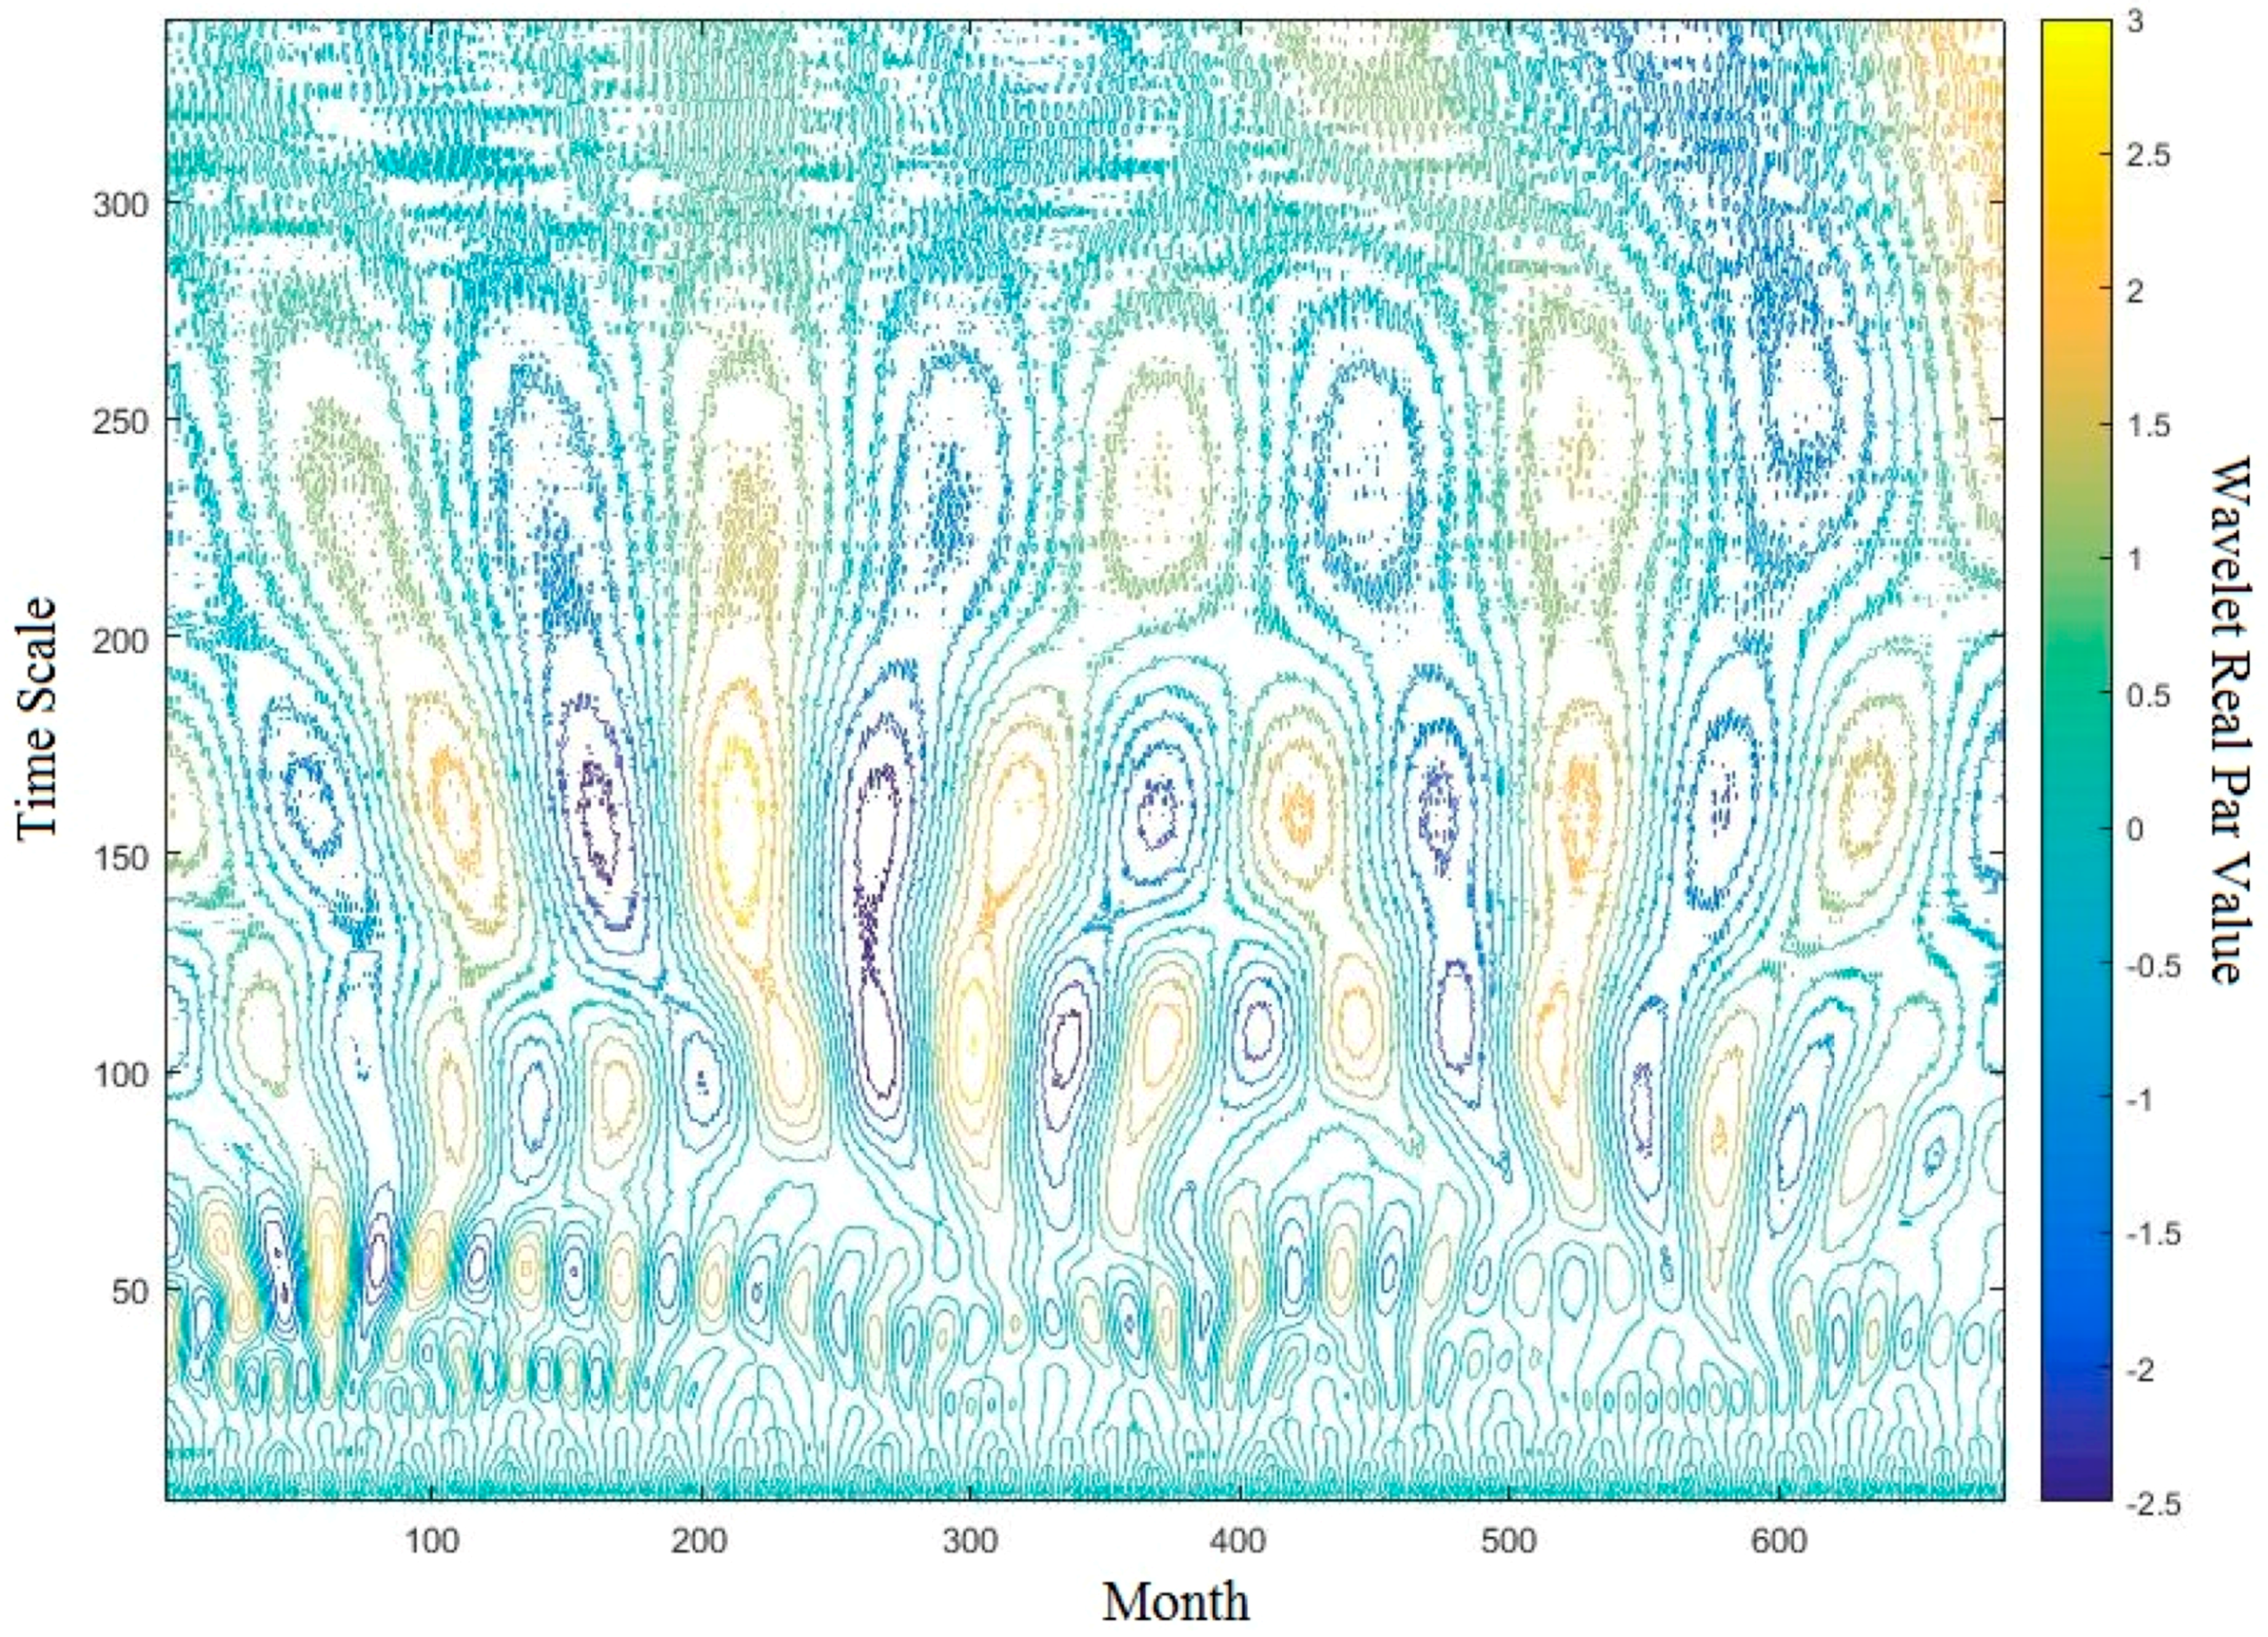
The continuous wavelet transform (CWT) was conducted on SPEI12 in Ningxia during the past 57 years by the Morlet complex wavelet method. The real part, power spectrum, and variance of wavelet coefficients were analyzed, which revealed the variation trends of multiple timescales of annual precipitation.
The real part value of the wavelet coefficients reflects the periodical variation of the time series on different timescales, and their distribution in the time domain; this can be used to anticipate the changing trends of the time series on different timescales in the future [67,68,69]. There are four scales of periodicities in the region’s droughts (Figure 11), which are 30–70 months (about four years), 80–120 months (about eight years), 130–190 months (about 13 years), and 200–270 months (about 20 years). For the 8- and 13-years periodicity, the heavy-light alternation of the drought is obvious, which could be seen throughout the entire time series. The periodicity above 300 months showed no obvious cyclical changes. From the long period of 200–270 months, the drought in the region experienced four heavy–light oscillations, with obvious mutation characteristics. In the whole time series, the 8- and 13-years are the scales with the most significant oscillations. Moreover, the performance is stable, and the period is obvious and continuous, indicating that the period has universality throughout the time series.
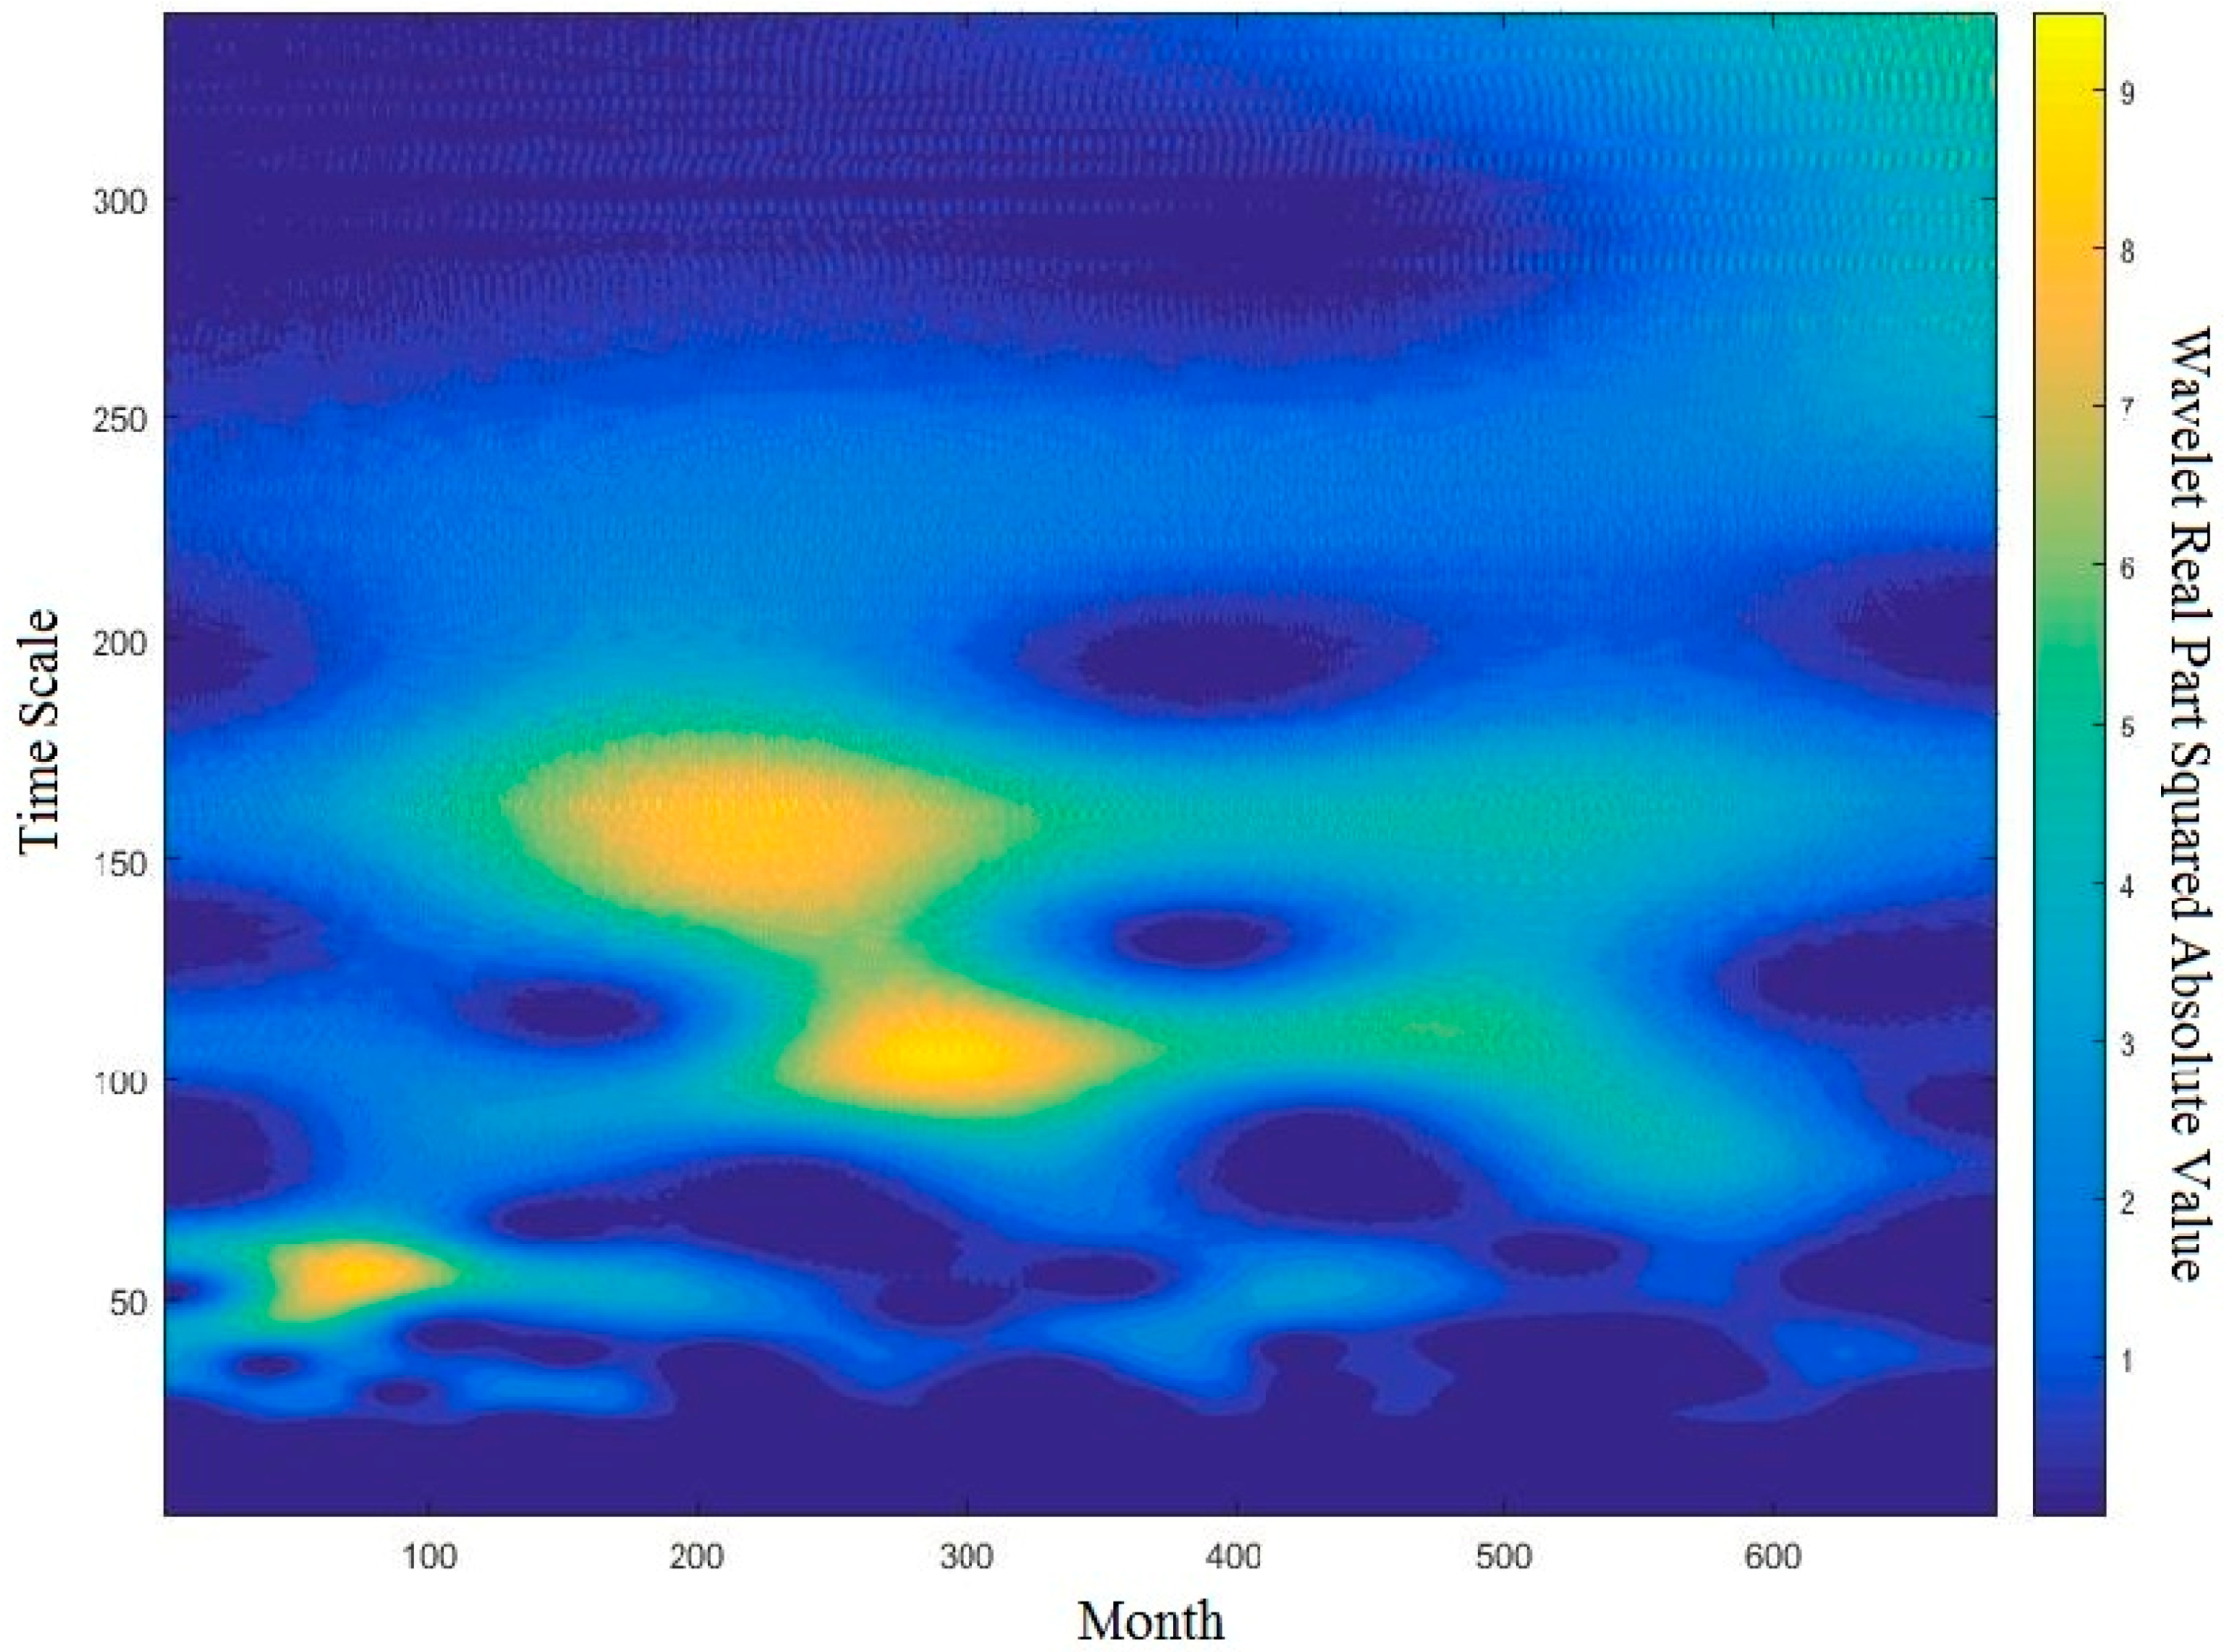
The modular square of the wavelet coefficient is the wavelet power spectrum, which analyzes the oscillation energy of the time series at different periods. The Ningxia drought time series showed the most powerful and periodic timescales on the 8- and 13-year scales (Figure 12). The most powerful points of the two are distributed in 220–380 months (summer 1987–autumn 1991) and 150–320 months (summer 1972–autumn 1986). The changes in the two periods are the most significant in these years. The four-year scale has the highest power performance during the period of 20–110 months (autumn 1961–spring 1969), which is in line with the drought year analyzed previously.
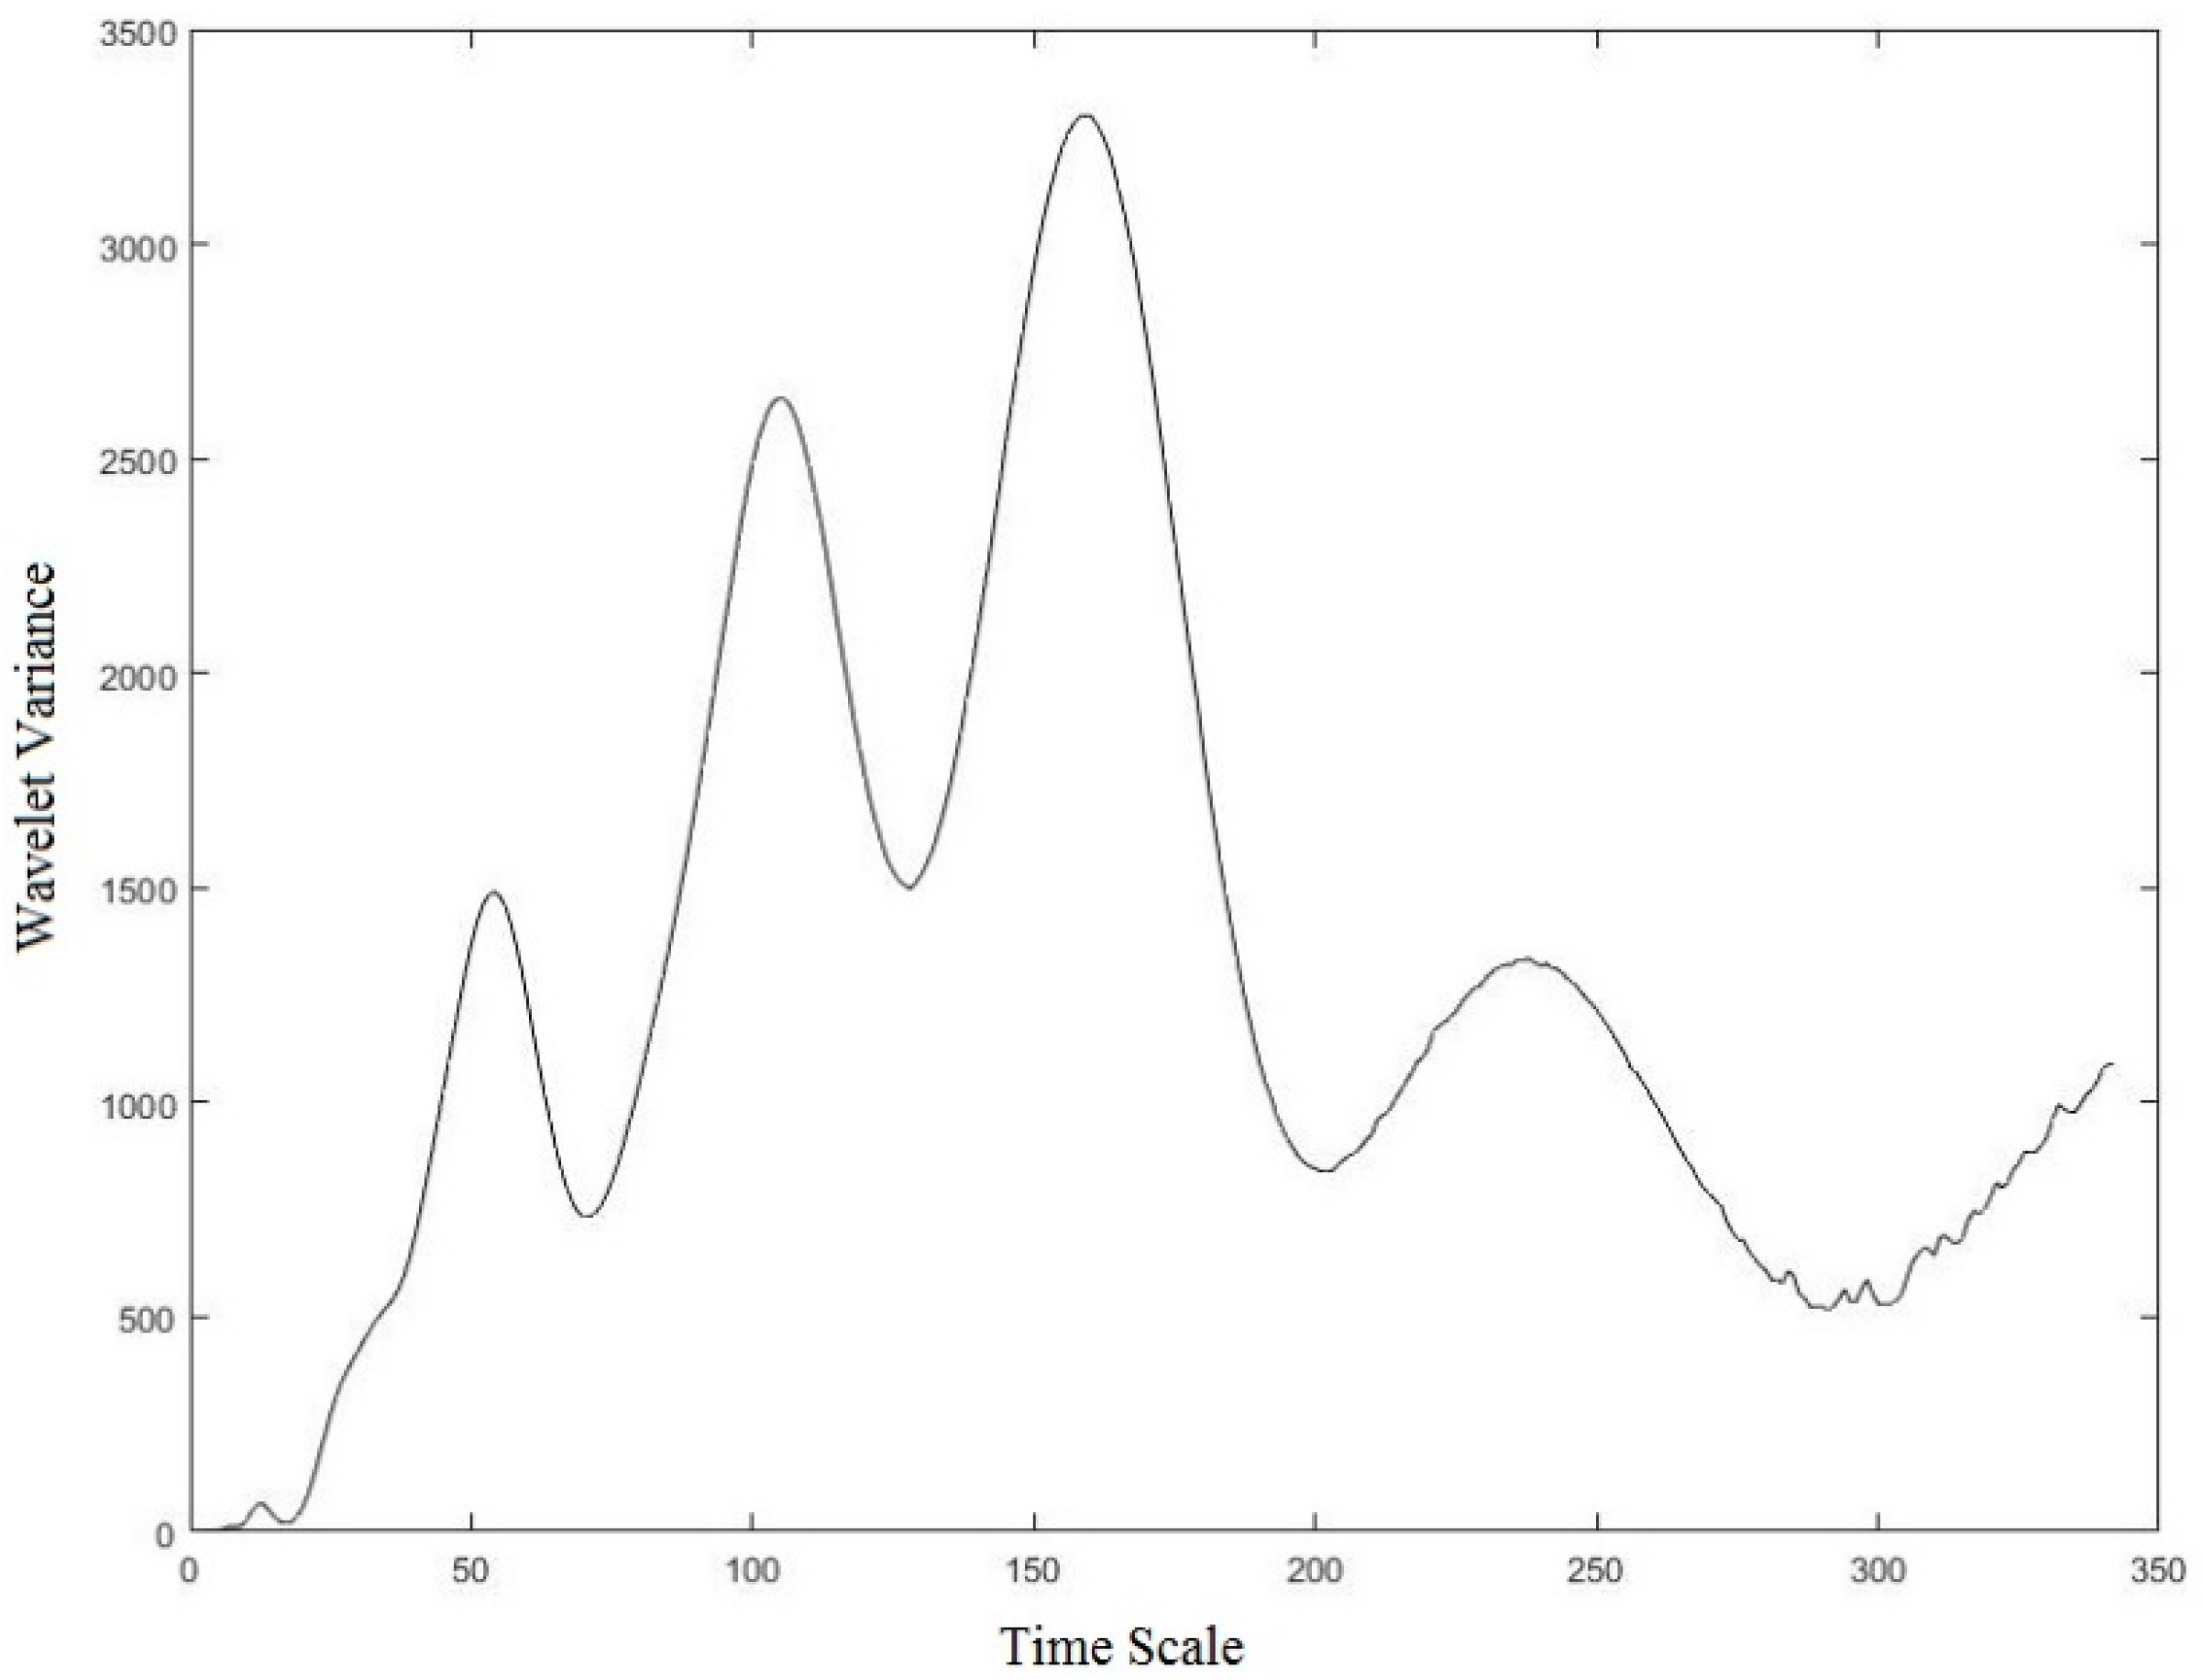
The wavelet variance map describes the various processes of the wavelet variance in a timely manner. At a certain scale, the wavelet variance of SPEI12 represents the strength of the periodic fluctuations in the time series (the power size) (Figure 13). It can be seen that the scales of the amplitudes of the period, in decreasing order, are 160 months (13.3 years), 105 months (8.75 years), 54 months (4.5 years), and 238 months (20 years). Therefore, the above four scales correspond to the major four periodicity of the drought variations in Ningxia, which controls the cyclical fluctuations of drought throughout the entire time series. The results are similar to the wavelet power spectrum analysis.
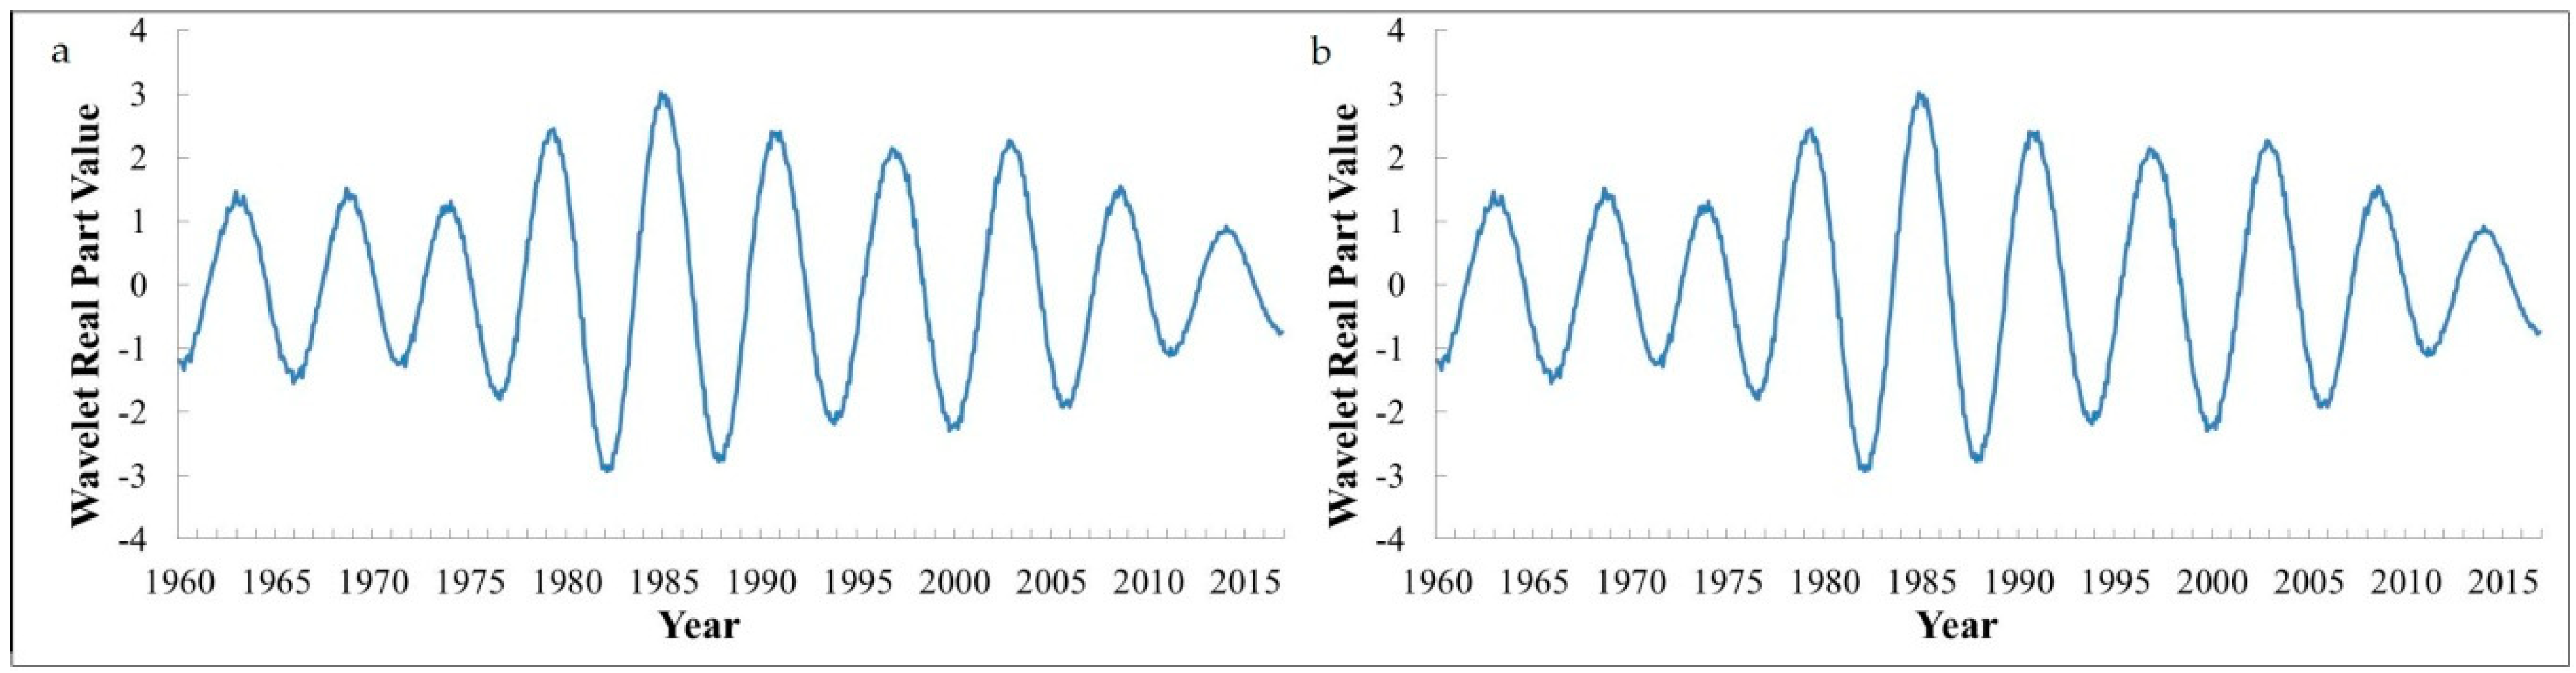
Based on the results of the wavelet variance test, the wavelet coefficient time–frequency plots corresponding to the scales were plotted for the first and the second major periods (Figure 14). The average period of the time series and variation trends of the drought severity at different timescales were analyzed. The real part value of the wavelet coefficient >0 represents serious droughts, while the real part value <0 represents lighter droughts. On the first main cycle (13.3 years, Figure 14a), there were approximately 6.5 drought changes, with an average period of 4.4 years. On the second main cycle (8.75 years, Figure 14b), about 10 cycles of change, with an average period of 6.5 years, were undergone. All of these results are consistent with those from the previous analyses.
4. Conclusions
In this paper, the characteristics of the spatial-temporal evolution of droughts in Ningxia were analyzed using the SPEI of multiple timescales. Through the wavelet analysis of the SPEI12 values, the periodical change of drought was obtained. The following conclusions are revealed:
(1) The SPI and SPEI values at a one month timescale are greatly affected by the short-term precipitation, and the deficiency of the precipitation for one month does not critically affect the drought damage. As the timescale increases, their values at the 3 months and 12 months timescales indicated that the precipitation accumulation was becoming more and more important, the frequency and the amplitude of the fluctuation decreased, while the separations between the dryness and wetness became clearer. They could show the seasonal and interannual variability of drought well, and a one month timescale is not frequently used. Moreover, the effect of the SPEI on the Ningxia drought characteristics analysis was superior to that of the SPI, in which the dry and wet conditions were more accurately reflected. The SPEI was used to analyze the evolution of the spatial and temporal characteristics of the droughts in Ningxia between 1960 and 2016.
(2) From 1960 to 2016, the SPEI at different timescales showed that the drought in Ningxia presented a gradually increasing trend. The drought represented by SPEI12 was consistent with that during the historical drought years in Ningxia. After the 1990s, the drought became more frequent. The reason has come down to the deficiency of water or the increase of evapotranspiration essentially. The temperature plays an important part in the occurrence of drought, which accounts for the high precipitation but the low SPEI value. The slight increase in precipitation did not offset the increase in the evapotranspiration caused by the rise in temperature. The SPEI is a good reflection of the trend of drought caused by global warming, and the occurrence of the El Nino phenomenon further accelerated the development of the drought conditions.
(3) From the perspective of the influence of drought, the number of drought stations’ proportions has an annual rising trend in all of the regions on the SPEI12. The autumn drought had the largest effect on the whole region, as well as the northern and middle regions, which was followed by summer drought, while the winter drought had the smallest impact. In the southern part, the spring drought had the largest influence, followed by the autumn drought, while the winter drought had the smallest influence.
(4) The interannual variation trends of the drought occurrence at different degrees were generally comparable; indeed, all showed a yearly increasing trend. Moreover, spring is the season with a high incidence of extreme droughts, summer is the season with the highest events of severe and mild droughts, and winter is the season with the least droughts. The overall drought intensity in Ningxia was shown to increase from the south towards the north. For example, the drought intensity is relatively higher in northern Ningxia, and the severest drought occurred in Zhongwei and Dawukou. The regions with the weakest intensities are Longde and Xiji, which are located in southern Ningxia.
(5) The drought of different degrees on SPEI12 showed a different distribution in Ningxia. Higher degrees of drought occurrence have lower frequencies. According to the inverse distance weight interpolation method, the highest drought frequency occurred in Yinchuan (in the north) and Xiji (in the south), and the lowest occured in Xingren (in the middle) and Guyuan (in the south). However, this interpolation method does not explicitly consider the influence of the topographic factors on drought, indicating that the results have limitations and uncertainties.
(6) The wavelet decomposition of SPEI12, for which the demy wavelet was chosen as the wavelet basis function showed that there are 28.5, 12.7, 7.3, 3.4, and 1.9 years of drought cycles in Ningxia, and the mutative fluctuation is in line with the actual situations. The real part value of the wavelet coefficients reflects the periodical changes of four drought scales in Ningxia, which are about 4, 8, 13, and 20 years. Among them, the scale oscillations of the 8- and 13-years are the most intense and have a maximum impact area; the wavelet power spectrum showed the strongest and most periodic timescales on the 8- and 13-year periods; the first and the second major periods of drought in Ningxia described by the wavelet variance were 13.3 and 8.75 years, respectively. These two main cycles experienced 6.5 and 10 cycles of change, respectively. The results of the three analyses were relatively consistent, and the mutability fluctuations were in agreement with the drought variability and actual conditions characterized by SPEI12.
This study helps to comprehend the occurrence and evolution of droughts in Ningxia, and provides a scientific basis for further predicting the development of drought trends, and for reducing and preventing consequent disasters.
Author Contributions
H.Q. provided the writing ideas and supervised the study; Y.F. and H.X. conceived and designed the methods; J.C. was responsible for data collection; and all of the authors wrote the paper, and were responsible for the data processing and data analysis.
Funding
The research was supported by the Special Fund for Scientific Research on Public Interest of the Ministry of Water Resources (201301084), the National Natural Science Foundation of China (41572236 and 41172212), and the Fundamental Research Funds for the Central Universities of Chang’an University (310829173306, 310829173701, 310829172202).
Acknowledgments
The rainfall and temperature data was obtained from Ningxia Survey and Monitor Institute of Land and Resources. The authors would like to thank the reviewers for their insightful comments that greatly improved the quality of the paper.
Conflicts of Interest
The authors declare no conflict of interest.
References
- Yu, M.; Li, Q.; Hayes, M.J.; Svoboda, M.D.; Heim, R.R. Are droughts becoming more frequent or severe in China based on the standardized precipitation evapotranspiration index: 1951–2010? Int. J. Climatol. 2014, 34, 545–558. [Google Scholar] [CrossRef]
- Chen, H.; Sun, J. Changes in drought characteristics over China using the standardized precipitation evapotranspiration index. J. Clim. 2015, 28, 5430–5447. [Google Scholar] [CrossRef]
- Liang, F.; Liu, D.; Wang, W.; Zhang, F.; Wang, X.; Bureau, C.M. Temporal and spatial distributions of drought in northeast China in 1961–2014 based on standardized precipitation evapotranspiration index. J. Desert Res. 2017, 1, 148–157. (In Chinese) [Google Scholar]
- Chen, J.; Wu, H.; Qian, H.; Li, X. Challenges and prospects of sustainable groundwater management in an agricultural plain along the Silk Road Economic Belt, north-west China. Int. J. Water Resour. Dev. 2018, 34, 354–368. [Google Scholar] [CrossRef]
- Chen, J.; Qian, H.; Wu, H. Nitrogen contamination in groundwater in an agricultural region along the New Silk Road, northwest China: Distribution and factors controlling its fate. Environ. Sci. Pollut. Res. 2017, 24, 13154–13167. [Google Scholar] [CrossRef] [PubMed]
- Ma, G.; Zhang, X.; Duan, X.; Yuan, H.; Wei, J. Analysis of drought evolvement characteristics based on standardized precipitation Index (SPI) in the mountain area of Ningxia. Acta Agric. Boreali-Occident. Sin. 2010, 10, 101–106. (In Chinese) [Google Scholar] [CrossRef]
- Yuan, W.; Zhou, G. Theoretical Study and Research Prospect on Drought Indices. Adv. Earth Sci. 2004, 6, 982–991. (In Chinese) [Google Scholar]
- Palmer, W.C. Meteorology Drought; US Department of Commerce Weather Bureau: Washington, DC, USA, 1965; pp. 45–58.
- Karl, T.R. Some spatial characteristics of drought duration in the United States. J. Clim. Appl. Meteorol. 1983, 22, 1356–1366. [Google Scholar] [CrossRef]
- Gobena, A.K.; Gan, T.Y. Assessment of trends and possible climate change impacts on summer moisture availability in western Canada based on metrics of the palmer drought severity index. J. Clim. 2013, 26, 4583–4595. [Google Scholar] [CrossRef]
- Kite, G.W. Frequency and Risk Analysis in Hydrology; Water Colorado Resources Publication: Littleton, CO, USA, 1977; ISBN 978-0918334640. [Google Scholar]
- McKee, T.B.; Doesken, N.J.; Kleist, J. The Relationship of Drought Frequency and Duration to Time Scales. In Proceedings of the Eight Conference on Applied Climatology, Anaheim, CA, USA, 17–22 January 1993; pp. 179–183. [Google Scholar]
- Kulikova, I.A.; Kruglova, E.N.; Kiktev, D.B.; Sal’nikov, V.G. Practical predictability of the standardized precipitation index on monthly and seasonal timescales. Russ. Meteorol. Hydrol. 2017, 42, 582–593. [Google Scholar] [CrossRef]
- Tsakiris, G.; Vangelis, H. Establishing a Drought Index Incorporating Evapotranspiration. Eur. Water. 2005, 9, 3–11. [Google Scholar]
- Tigkas, D.; Vangelis, H.; Tsakiris, G. An Enhanced Effective Reconnaissance Drought Index for the Characterization of Agricultural Drought. Environ. Process. 2017, 4, 137–148. [Google Scholar] [CrossRef]
- Vicente-Serrano, S.M.; López-Moreno, J.I.; Lorenzo-Lacruz, J.; Kenawy, A.E.; Azorin-Molina, C.; Morán-Tejeda, E.; Pasho, E.; Zabalza, J.; Beguería, S.; Angulo-Martínez, M. The NAO Impact on Droughts in the Mediterranean Region. In Hydrological, Socioeconomic and Ecological Impacts of the North Atlantic Oscillation in the Mediterranean Region; Vicente-Serrano, S.M., Trigo, R.M., Eds.; Advances in Global Change Research Volume 46; Springer: Dordrecht, The Netherlands, 2011; pp. 23–40. ISBN 978-94-007-1372-7. [Google Scholar]
- Miah, M.G.; Abdullah, H.M.; Jeong, C. Exploring standardized precipitation evapotranspiration index for drought assessment in Bangladesh. Environ. Monit. Assess. 2017, 189, 547. [Google Scholar] [CrossRef] [PubMed]
- Naderianfar, M.; Piri, J.; Kisi, O. Pre-processing data to predict groundwater levels using the fuzzy standardized evapotranspiration and precipitation index (SEPI). Water Resour. Manag. 2017, 31, 4433–4448. [Google Scholar] [CrossRef]
- Zhang, Q.; Zhang, C.; Bai, H.; Ling, L.; Sun, L.; Liu, D.; Wang, J.; Zhao, H. New development of climate change in northwest China and its impact on arid environment. J. Arid. Meteorol. 2010, 28, 1–7. (In Chinese) [Google Scholar]
- Zou, X.; Zhai, P.; Zhang, Q. Variations in droughts over China: 1951–2003. Geophys. Res. Lett. 2005, 32, 353–368. [Google Scholar] [CrossRef]
- Li, J.; Chen, F.; Cook, E.R.; Gou, X.; Zhang, Y. Drought reconstruction for north central China from tree rings: The value of the palmer drought severity index. Int. J. Climatol. 2007, 27, 903–909. [Google Scholar] [CrossRef]
- Li, Q.; Li, P.; Li, H.; Yu, M. Drought assessment using a multivariate drought index in the Luanhe river basin of northern China. Stoch. Environ. Res. Risk Assess. 2015, 29, 1509–1520. [Google Scholar] [CrossRef]
- Zhang, Y.; Liu, P.; Wang, Y. Temporal and spatial variations of the drought in Ningxia based on aridity index and Morlet wavelet analysis. Chin. J. Ecol. 2015, 34, 2373–2380. (In Chinese) [Google Scholar]
- Liu, S.; Kang, W.; Wang, T. Drought variability in Inner Mongolia of northern China during 1960–2013 based on standardized precipitation evapotranspiration index. Environ. Earth Sci. 2016, 75, 145. [Google Scholar] [CrossRef]
- Li, M.; Wang, G.; Zhang, L. Drought characteristics analysis and the zoning based on standardized precipitation evapotranspiration index in northeast China. J. Arid. Land Resour. Environ. 2016, 30, 65. [Google Scholar]
- Wu, H.; Qian, H.; Chen, J.; Huo, C. Assessment of Agricultural Drought Vulnerability in the Guanzhong Plain, China. Water Resour. Manag. 2017, 31, 1557–1574. [Google Scholar] [CrossRef]
- China Meteorological Data Service Center. Available online: http://cdc.cma.gov.cn/home.do (accessed on 16 April 2018).
- Chen, Y.N.; Yang, Q.; Luo, Y.; Shen, Y.; Pan, X.; Li, L.; Li, Z. Ponder on the issues of water resources in the arid region of northwest China. Arid. Land Geogr. 2012, 35, 1–9. (In Chinese) [Google Scholar]
- Chen, Y.M.; He, Z.J.; Ben, Y.; Dong, Q.H. Time-frequency alteration and cross-wavelet transformation between runoff and precipitation: A case study of the Wulanghe River. China Rural Water Hydropower 2017, 10, 13–17. (In Chinese) [Google Scholar]
- Chen, J.; Qian, H.; Gao, Y.; Li, X. Human health risk assessment of contaminants in drinking water based on triangular fuzzy numbers approach in Yinchuan city, northwest China. Expo. Health 2017. [Google Scholar] [CrossRef]
- Chen, J.; Wu, H.; Qian, H. Groundwater nitrate contamination and associated health risk for the rural communities in an agricultural area of Ningxia, northwest China. Expo. Health 2016, 8, 349–359. [Google Scholar] [CrossRef]
- Chen, J.; Qian, H.; Wu, H.; Gao, Y.; Li, X. Assessment of arsenic and fluoride pollution in groundwater in Dawukou area, Northwest China and the associated health risk for inhabitants. Environ. Earth Sci. 2017, 76, 314. [Google Scholar] [CrossRef]
- Qian, H.; Li, P.Y.; Howard, K.W.F.; Yang, C.; Zhang, X. Assessment of groundwater vulnerability in the Yinchuan Plain, Northwest China using OREADIC. Environ. Monit. Assess. 2012, 184, 3613–3628. [Google Scholar] [CrossRef] [PubMed]
- Qian, H.; Li, P.; Wu, J.; Zhou, Y. Isotopic Characteristics of Precipitation, Surface and Ground Waters in the Yinchuan Plain, Northwest China. Environ. Earth Sci. 2013, 70, 57–70. [Google Scholar] [CrossRef]
- Qian, H.; Wu, J.; Zhou, Y.; Li, P. Stable oxygen and hydrogen isotopes as indicators of lake water recharge and evaporation in the lakes of the Yinchuan Plain. Hydrol. Process. 2014, 28, 3554–3562. [Google Scholar] [CrossRef]
- Wu, H.; Li, X.; Qian, H. Detection of Anomalies and Changes of Rainfall in the Yellow River Basin, China, through Two Graphical Method. Water 2017, 10, 15. [Google Scholar] [CrossRef]
- Wu, H.; Qian, H. Innovative trend analysis of annual and seasonal rainfall and extreme values in Shaanxi, China, since the 1950s. Int. J. Climatol. 2017, 37, 2582–2592. [Google Scholar] [CrossRef]
- Chen, T.; Werf, G.R.; Jeu, R.A.M.; Wang, G.; Dolman, A.J. A global analysis of the impact of drought on net primary productivity. Hydrol. Earth Syst. Sci. 2013, 17, 3885–3894. [Google Scholar] [CrossRef] [Green Version]
- Potop, V.; Možný, M.; Soukup, J. Drought evolution at various time scales in the lowland regions and their impact on vegetable crops in the Czech Republic. Agric. For. Meteorol. 2012, 156, 121–133. [Google Scholar] [CrossRef]
- Dai, A. Drought under global warming: A review. Wiley Interdiscip. Rev. Clim. Chang. 2011, 2, 45–65. [Google Scholar] [CrossRef]
- Morid, S.; Smakhtin, V.; Moghaddasi, M. Comparison of seven meteorological indices for drought monitoring in Iran. Int. J. Climatol. 2006, 26, 971–985. [Google Scholar] [CrossRef] [Green Version]
- McKee, T.B.; Doesken, N.J.; Kleist, J. Drought Monitoring with Multiple Time scales. In Proceedings of the 9th Conference on Applied Climatology, Boston, MA, USA, 15–20 January 1995; pp. 233–236. [Google Scholar]
- Edwards, D.C.; McKee, T.B. Characteristics of 20th Century Drought in the United States at Multiple Time Scales; Climatology Report No. 97-2; Colorado State University: Ft. Collins, CO, USA, 1997. [Google Scholar]
- Vicente-Serrano, S.M.; Beguería, S.; Lópezmoreno, J.I. A multiscalar drought index sensitive to global warming: The standardized precipitation evapotranspiration index. J. Clim. 2008, 23, 1696–1718. [Google Scholar] [CrossRef]
- Botai, C.M.; Botai, J.O.; Dlamini, L.C.; Zwane, N.S.; Phaduli, E. Characteristics of droughts in South Africa: A case study of free state and north west provinces. Water 2016, 8, 439. [Google Scholar] [CrossRef]
- Thornthwaite, C.W. An approach toward a rational classification of climate. Geogr. Rev. 1948, 38, 55–94. [Google Scholar] [CrossRef]
- Keyantash, J.; Dracup, J.A. The quantification of drought: An evaluation of drought indices. Bull. Am. Meteorol. Soc. 2002, 83, 1167–1180. [Google Scholar] [CrossRef]
- Richard, G. Crop Evapotranspiration—Guidelines for Computing Crop Water Requirements; FAO Irrigation and Drainage Paper 56; Food and Agriculture Organization of the United Nations: Rome, Italy, 1998. [Google Scholar]
- McVicar, T.R.; Roderick, M.L.; Donohue, R.J.; Li, L.T.; Van Niel, T.G.; Thomas, A.; Grieser, J.; Jhajharia, D.; Himri, Y.; Mahowald, N.M.; et al. Global review and synthesis of trends in observed terrestrial near-surface wind speeds: Implications for evaporation. J. Hydrol. 2012, 416, 182–205. [Google Scholar] [CrossRef]
- Beguería, S.; Vicente-Serrano, S.M.; Reig, F.; Latorre, B. Standardized precipitation evapotranspiration index (SPEI) revisited: Parameter fitting, evapotranspiration models, tools, datasets and drought monitoring. Int. J. Climatol. 2014, 34, 3001–3023. [Google Scholar] [CrossRef]
- Azorin-Molina, C.; Vicente-Serrano, S.M.; Mcvicar, T.R.; Jerez, S.; Sanchez-Lorenzo, A.; López-Moreno, J.-I.; Revuelto, J.; Trigo, R.M.; Lopez-Bustins, J.A.; Espírito-Santo, F. Homogenization and assessment of observed near-surface wind speed trends over Spain and Portugal, 1961–2011. J. Clim. 2014, 27, 3692–3712. [Google Scholar] [CrossRef]
- López-Moreno, J.I.; Vicente-Serrano, S.M.; Zabalza, J.; Beguería, S.; Lorenzo-Lacruz, J.; Azorin-Molina, C.; Morán-Tejeda, E. Hydrological response to climate variability at different time scales: A study in the Ebro basin. J. Hydrol. 2013, 477, 175–188. [Google Scholar] [CrossRef] [Green Version]
- Meza, F.J. Recent trends and ENSO influence on droughts in Northern Chile: An application of the Standardized Precipitation Evapotranspiration Index. Weather. Clim. Extrem. 2013, 1, 51–58. [Google Scholar] [CrossRef]
- Standardization Administration of the People’s Republic of China (SAC). Grades of Meteorological Drought (GB/T 20481–2017). Available online: http://www.gb688.cn/bzgk/gb/ (accessed on 7 September 2017). (In Chinese).
- Yang, X.J.; Zuo, D.P.; Xu, Z.X. Characteristics of Droughts and Floods Analyzed Using the Standardized Precipitation Index in Yunnan Province During the Past 55 Years. Resour. Sci. 2014, 36, 473–480. [Google Scholar]
- Grinsted, A.; Moore, J.C.; Jevrejeva, S. Application of the cross wavelet transform and wavelet coherence to geophysical time series. Nonlinear Process. Geophys. 2004, 11, 561–566. [Google Scholar] [CrossRef] [Green Version]
- Mallat, S.G. A Theory for Multiresolution Signal Decomposition: The Wavelet Representation. IEEE Trans. Pattern Anal. Mach. Intell. 1989, 11, 674–693. [Google Scholar] [CrossRef]
- Torrence, C.; Compo, G.P. A practical guide to wavelet analysis. Bull. Am. Meteorol. Soc. 1998, 79, 61–78. [Google Scholar] [CrossRef]
- Gaucherel, C. Use of wavelet transform for temporal characterization of remote watersheds. J. Hydrol. 2002, 269, 101–121. [Google Scholar] [CrossRef]
- Labat, D. Recent advances in wavelet analyses: Part 1, A review of concepts. J. Hydrol. 2005, 314, 275–288. [Google Scholar] [CrossRef]
- Lau, K.M.; Weng, H. Climate signal detection using wavelet transform: How to make a time series sing. Bull. Am. Meteorol. Soc. 1995, 76, 2391–2402. [Google Scholar] [CrossRef]
- Xue, X.J.; Jiang, X.H.; Huang, Q.; Wang, Y. The application of wavelet analysis in hydrological sequence trend analysis. J. Appl. Sci. 2002, 20, 426–428. (In Chinese) [Google Scholar]
- Vetterli, M. Wavelets, approximation, and compression. IEEE Signal Process. Mag. 2001, 18, 59–73. [Google Scholar] [CrossRef] [Green Version]
- Torrence, C.; Webster, P.J. Interdecadal changes in the ENSO-monsoon system. J. Clim. 1999, 12, 2679–2690. [Google Scholar] [CrossRef]
- Sun, W.G.; Cheng, B.Y. Application of cross wavelet transformation to analysis on regional climate variations. J. Appl. Meteorol. Sci. 2008, 19, 479–487. (In Chinese) [Google Scholar]
- Maraun, D.; Kurths, J. Cross wavelet analysis: Significance testing and pitfalls. Nonlinear Process. Geophys. 2004, 11, 505–514. [Google Scholar] [CrossRef] [Green Version]
- Nakken, M. Wavelet analysis of rainfall-runoff variability isolating climatic from anthropogenic patterns. Environ. Model. Softw. 1999, 14, 283–295. [Google Scholar] [CrossRef]
- Nason, G.P.; Sapatinas, T. Wavelet packet transfer function modelling of nonstationary time series. Stat. Comput. 2002, 12, 45–56. [Google Scholar] [CrossRef]
- Huang, H.Y.; Qi, F.H.; Chen, J.; Yao, Z.H. A wavelet-based interpolation of medical images. J. Syst. Simul. 2007, 19, 145–148. (In Chinese) [Google Scholar]
Figure 1.
The location of Ningxia. The main map shows meteorological stations, the Yellow River, and sub-regions of the study area.
Figure 1.
The location of Ningxia. The main map shows meteorological stations, the Yellow River, and sub-regions of the study area.

Figure 2.
The standardized precipitation index (SPI) values at different timescales in Ningxia from 1960 to 2016. (a) SPI1 in Ningxia from 1960 to 2016; (b) SPI3 in Ningxia from 1960 to 2016; and (c) SPI12 in Ningxia from 1960 to 2016.
Figure 2.
The standardized precipitation index (SPI) values at different timescales in Ningxia from 1960 to 2016. (a) SPI1 in Ningxia from 1960 to 2016; (b) SPI3 in Ningxia from 1960 to 2016; and (c) SPI12 in Ningxia from 1960 to 2016.

Figure 3.
The standardized precipitation evapotranspiration index (SPEI) values at different timescales in Ningxia from 1960 to 2016. (a) SPEI1 in Ningxia from 1960 to 2016; (b) SPEI3 in Ningxia from 1960 to 2016; and (c) SPEI12 in Ningxia from 1960 to 2016.
Figure 3.
The standardized precipitation evapotranspiration index (SPEI) values at different timescales in Ningxia from 1960 to 2016. (a) SPEI1 in Ningxia from 1960 to 2016; (b) SPEI3 in Ningxia from 1960 to 2016; and (c) SPEI12 in Ningxia from 1960 to 2016.

Figure 4.
The drought stations proportions of the SPEI12 in three sub-regions and the whole Ningxia regions from 1960 to 2016.
Figure 4.
The drought stations proportions of the SPEI12 in three sub-regions and the whole Ningxia regions from 1960 to 2016.

Figure 5.
Cumulative drought stations’ proportions variation in Ningxia from 1960 to 2016. (a) Drought stations proportions in the whole region of each season; (b) drought stations proportions in the north Ningxia of each season; (c) drought stations proportions in middle Ningxia of each season; and (d) drought stations proportions in south Ningxia of each season.

Figure 6.
Interannual variation percentage accumulation of the drought stations proportions at different drought degrees in (a) spring, (b) summer, (c) autumn, and (d) winter.
Figure 6.
Interannual variation percentage accumulation of the drought stations proportions at different drought degrees in (a) spring, (b) summer, (c) autumn, and (d) winter.

Figure 7.
Spatial distribution of drought occurrence times based on SPEI12 and SPEI3 values during 1960–2016. (a) The SPEI12 values were used to calculate the interannual average values; (b–e) the SPEI3 values were used to calculate the interannual average values in each season.
Figure 7.
Spatial distribution of drought occurrence times based on SPEI12 and SPEI3 values during 1960–2016. (a) The SPEI12 values were used to calculate the interannual average values; (b–e) the SPEI3 values were used to calculate the interannual average values in each season.

Figure 8.
Spatial distribution of drought intensity in Ningxia.

Figure 9.
Spatial distribution of drought frequency in different degrees between 1960 and 2016 (the drought frequency was calculated by the SPEI12 values). (a) The frequency of the drought; (b–e) The frequency of mild, moderate, severe, and extreme droughts.
Figure 9.
Spatial distribution of drought frequency in different degrees between 1960 and 2016 (the drought frequency was calculated by the SPEI12 values). (a) The frequency of the drought; (b–e) The frequency of mild, moderate, severe, and extreme droughts.

Figure 10.
Wavelet decomposition of monthly SPEI12 values in the whole region.

Figure 11.
Real part value wavelet coefficients on SPEI12.

Figure 12.
The Morlet wavelet power spectrum on SPEI12 time series.

Figure 13.
SPEI12 wavelet variance map.

Figure 14.
Wavelet time–frequency diagram on SPEI12. (a) Wavelet time–frequency diagram on the first main cycle; (b) Wavelet time–frequency diagram on the second main cycle.
Figure 14.
Wavelet time–frequency diagram on SPEI12. (a) Wavelet time–frequency diagram on the first main cycle; (b) Wavelet time–frequency diagram on the second main cycle.


Table 1.
Drought degrees based on the standardized precipitation evapotranspiration index (SPEI). SPI—standardized precipitation index.
Table 1.
Drought degrees based on the standardized precipitation evapotranspiration index (SPEI). SPI—standardized precipitation index.
| Drought Degree | No Drought | Mild Drought | Moderate Drought | Severe Drought | Extreme Drought |
|---|---|---|---|---|---|
| SPI/SPEI Value | SPI/SPEI >−0.5 | −1.0 < SPI/SPEI ≤ −0.5 | −1.5 < SPI/SPEI ≤ −1.0 | −2.0 < SPI/SPEI ≤ −1.5 | SPI/SPEI ≤−2.0 |
Table 2.
The numbers of years and the particular years of the full-scale drought occurs in the whole and three sub-regions of each season.
Table 2.
The numbers of years and the particular years of the full-scale drought occurs in the whole and three sub-regions of each season.
| Region | Season | The Numbers of Years | The Particular Years |
|---|---|---|---|
| Ningxia | Spring Drought | 9 | 1969, 1999, 2000, 2004, 2005, 2006, 2008, 2009, 2013 |
| Summer Drought | 11 | 1969, 1971, 1982, 1997, 2001, 2005, 2006, 2008, 2009, 2011, 2015 | |
| Autumn Drought | 9 | 1965, 1991, 1997, 1998, 1999, 2005, 2006, 2009, 2010 | |
| Winter Drought | 5 | 1979, 1980, 1998, 2006, 2008 | |
| North Ningxia | Spring Drought | 11 | 1969, 1999–2001, 2004–2006, 2008–2009, 2013-–2014 |
| Summer Drought | 11 | 1969, 1971, 1980, 1982, 1997, 2001, 2005, 2008–2009, 2011, 2015 | |
| Autumn Drought | 11 | 1963, 1965–1966, 1991, 1997–1999, 2005–2006, 2010, 2013 | |
| Winter Drought | 8 | 1979–1980, 1983, 1995, 1998, 2006, 2008, 2010 | |
| Middle Ningxia | Spring Drought | 10 | 1966, 1969, 1995, 2000, 2004–2006, 2008–2009, 2013 |
| Summer Drought | 9 | 1960, 1965, 1975, 1982, 2005–2006, 2008–2009, 2015 | |
| Autumn Drought | 12 | 1965, 1980, 1986–1987, 1991, 1998–2000, 2004–2006, 2009 | |
| Winter Drought | 5 | 1980, 1994, 1998, 2006, 2008 | |
| South Ningxia | Spring Drought | 12 | 1962, 1966, 1968, 1971, 1995, 2000–2001, 2004, 2007–2008, 2011, 2013 |
| Summer Drought | 10 | 1971, 1974, 1982, 1997, 2001, 2006-2009, 2011 | |
| Autumn Drought | 10 | 1971, 1972, 1986, 1991, 1997–1999, 2002, 2009, 2016 | |
| Winter Drought | 7 | 1964, 1969, 1970, 1972, 1980, 1985, 1998 |
© 2018 by the authors. Licensee MDPI, Basel, Switzerland. This article is an open access article distributed under the terms and conditions of the Creative Commons Attribution (CC BY) license (http://creativecommons.org/licenses/by/4.0/).
Share and Cite
MDPI and ACS Style
Fang, Y.; Qian, H.; Chen, J.; Xu, H. Characteristics of Spatial-Temporal Evolution of Meteorological Drought in the Ningxia Hui Autonomous Region of Northwest China. Water 2018, 10, 992. https://doi.org/10.3390/w10080992
AMA Style
Fang Y, Qian H, Chen J, Xu H. Characteristics of Spatial-Temporal Evolution of Meteorological Drought in the Ningxia Hui Autonomous Region of Northwest China. Water. 2018; 10(8):992. https://doi.org/10.3390/w10080992
Chicago/Turabian StyleFang, Yuan, Hui Qian, Jie Chen, and Han Xu. 2018. "Characteristics of Spatial-Temporal Evolution of Meteorological Drought in the Ningxia Hui Autonomous Region of Northwest China" Water 10, no. 8: 992. https://doi.org/10.3390/w10080992
Note that from the first issue of 2016, this journal uses article numbers instead of page numbers. See further details here.