3.1. Physico-Chemical Analysis
The physicochemical properties of the water samples such as conductivity, total dissolved solids (TDS), salinity, temperature, and pH were measured at the field where the samples were collected. The water samples were collected between the period of twelve months and the results of the physicochemical parameters that were measured are presented in
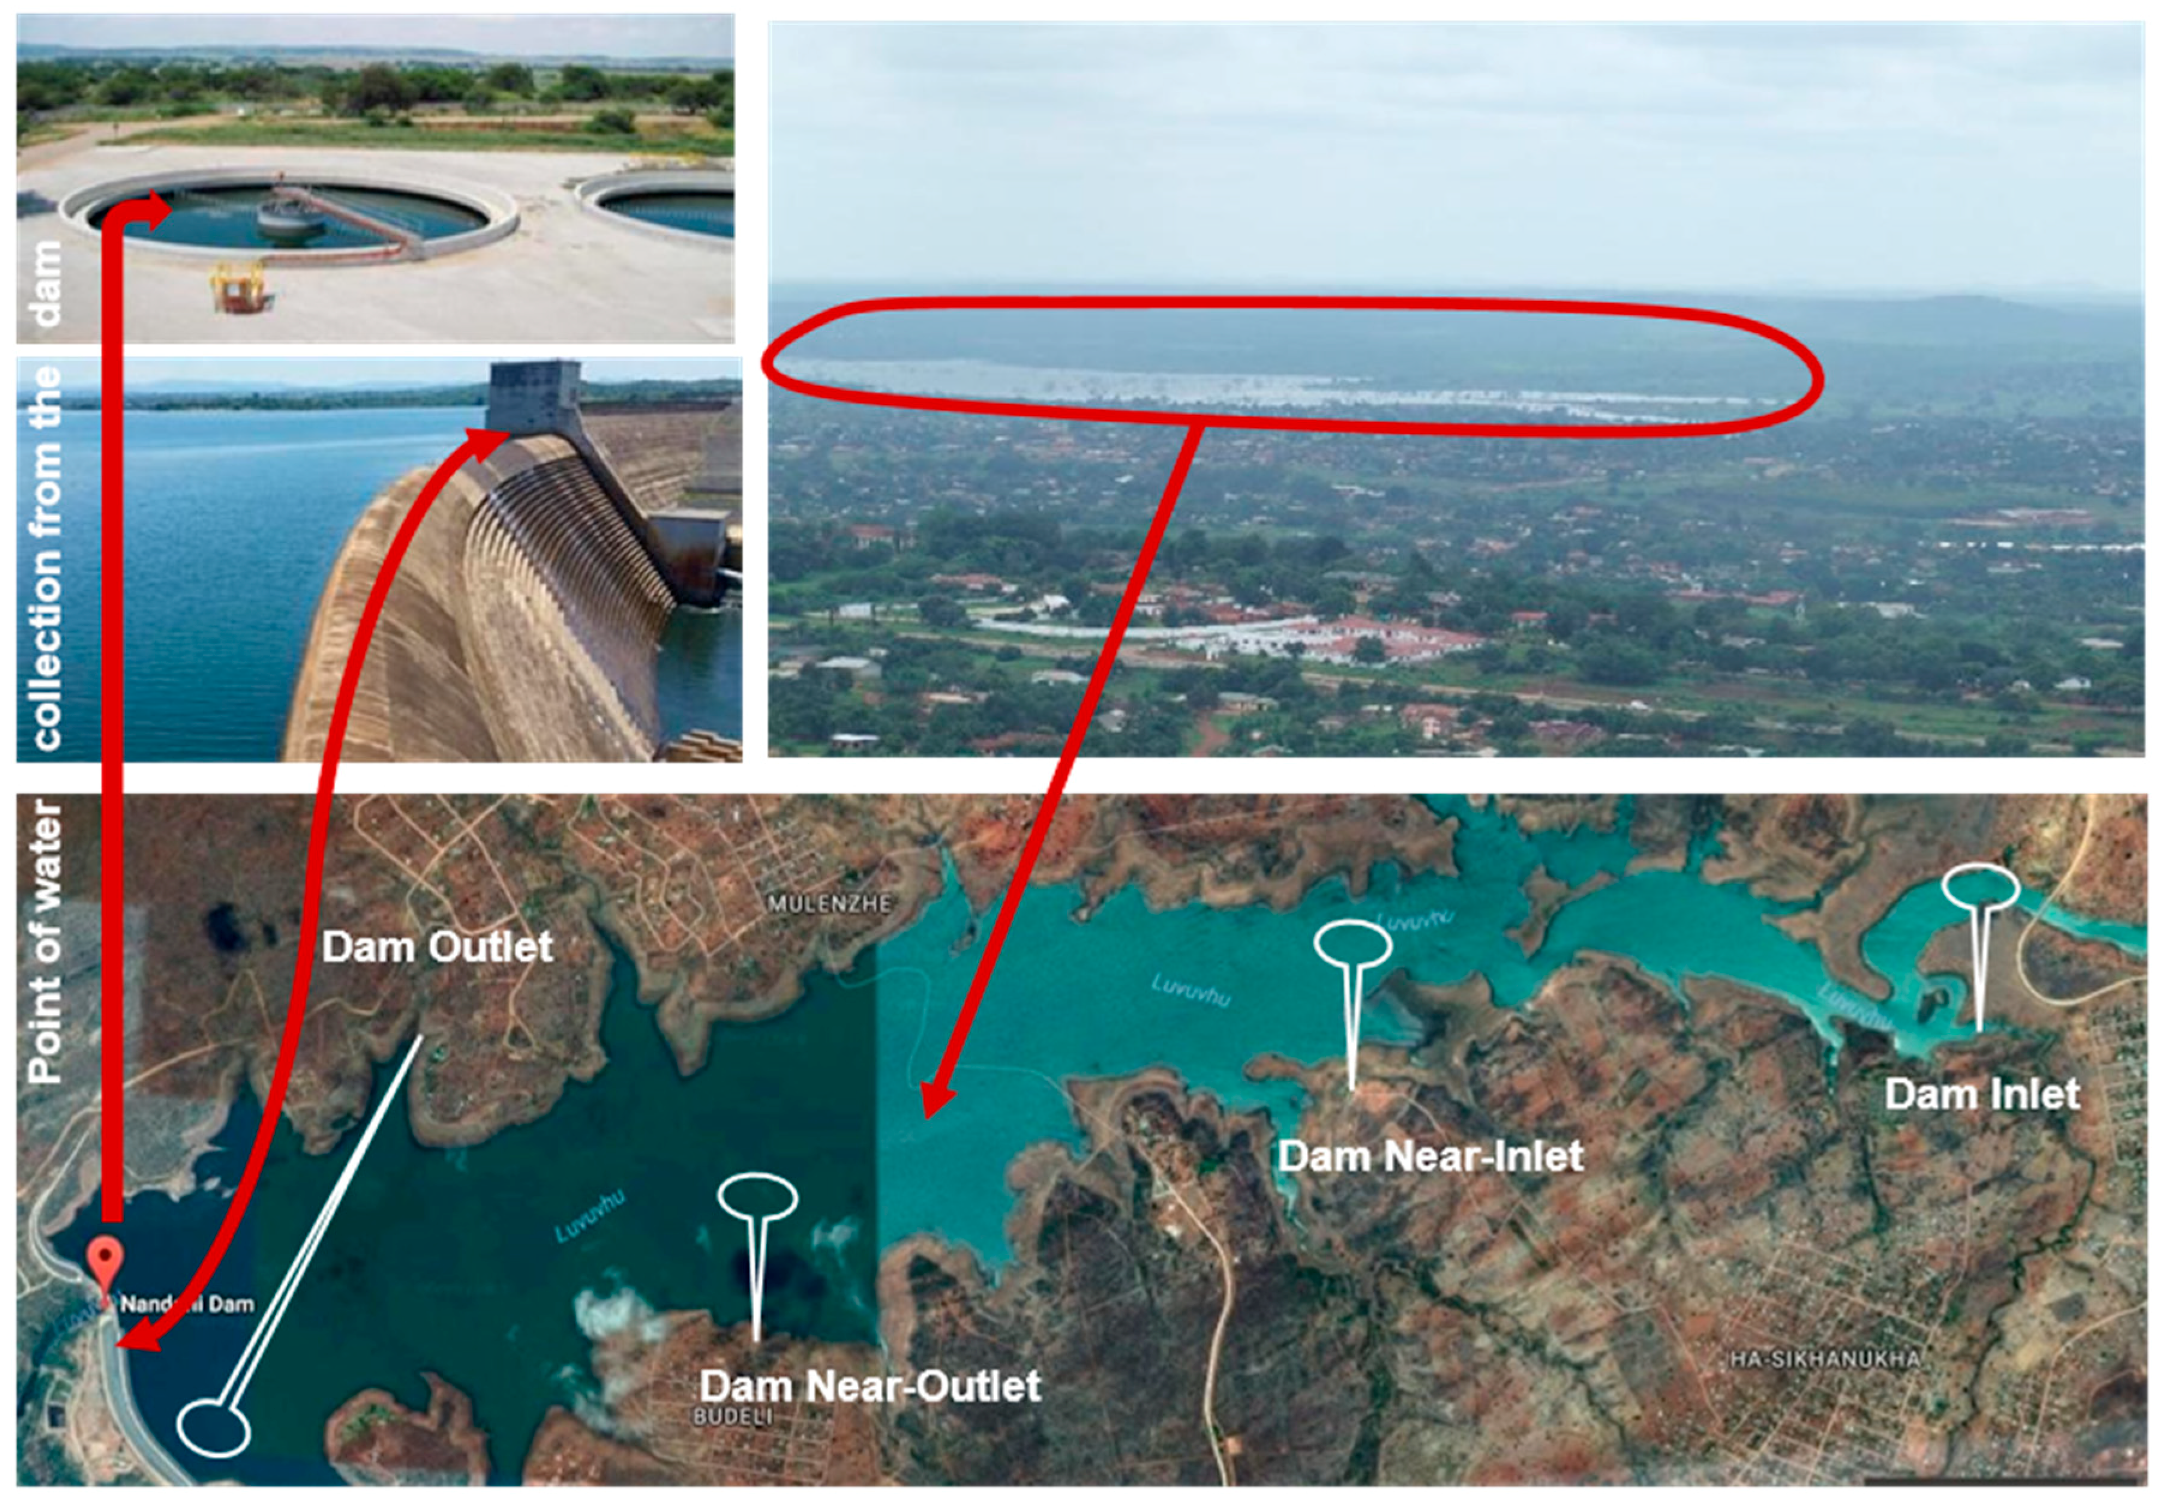
Table 2. Three representative samples per sampling were collected in each identified sampling point within the dam and municipal treatment plant that sourced the water from the dam for purification.
The water samples in the Nandoni Dam were found to be slightly alkaline with a pH ranging from 7.19 to 8.23 (
Table 2). This was expected since the water passes through various limestone rocks prior to collection into the Nandoni Dam. This meant the water contains the carbonates at concentrations that have neutralization effect to result in the formation of slightly alkaline pH. The Nandoni Dam is also surrounded by activities that involve discharges from a sewer network, irrigation canals, drainage network and pumped groundwater which find their way to the lake via several tributaries. These activities result to the pH fluctuations depending on their hydronium and hydroxide ion dissociation potentials in water [
28,
29].
The temperature of the water samples was found to significantly vary with seasonal changes. In this regard, lower temperatures (291 K) were recorded during winter and the highest temperature (298 K) was recorded during summer. A significant variation in the seasonal water temperature (spring 292 K; summer 298 K in 2016; autumn 295 K; and winter 291 K in 2017) was caused by an increased cooling rate of the water bodies due to the exposure of the dam to the wind. Large open water bodies have a fast cooling rate with respect to wind direction and this results in colder water during winter and spring, and warmer water during summer and autumn [
30].
The conductivity of the water is a measure of the concentration of ions that are capable of carrying electrical current [
7]. Water conductivity is used to estimate the TDS and salinity of the water. The conductivity, TDS and salinity classification of fresh, brackish and sea water is presented in
Table 3 [
6,
31]. The conductivity of the water sampled from the dam was found to be higher at the middle inlet and outlet of the dam. Apart from the Luvuvhu River, the Nandoni Dam has other small streams that enter the dam. These streams are most likely to deposit high amounts of total dissolved solids, which lead to an increase in the water conductivity. By all accounts, the conductivity values obtained for the water samples of the Nandoni Dam and the municipality treatment plant indicate brackish water.
The total dissolved solids (TDS) are comprised of inorganic matter such as mineral, salts, metals as well as dissolved organic compounds present in the water [
34]. In general, the high concentrations of TDS (1194 and 1154 mg/L) were observed during the rainy seasons (i.e., summer and autumn respectively). Such levels are associated with the run-off that carries high deposits of the dissolved compounds into the Nandoni Dam. The total dissolved solids were concentrated at the dam outlet with the highest concentration of 1245 mg/L being recorded in winter.
Salinity is a measure of the total concentration of all dissolved salts in water [
35]. The salinity of the water in the Nandoni Dam was found to be higher during the dry seasons (i.e., winter and spring) with the highest amount (750 mg/L) being recorded for the water sampled at the middle of the dam near inlet. This is attributable to the low dilution effect of the total dissolved salts, which are presently deposited into the dam during the dry seasons. The salinity values seem to suggest that the water in the bulk of the Nandoni Dam was brackish [
32,
33]. A few exceptions were however noted; the water at the dam outlet and the treatment plant (the plant that sources the water from Nandoni Dam for treatment prior to distribution) indicate that this water falls within the freshwater category (i.e., salinity < 500 mg/L), although the water taste is unsatisfactory when drinking.
Fresh, brackish and seawater possess viable minerals that differ in availability and concentration. The concentrations of the common ions present in fresh, brackish and sea water are shown in
Table 4. The concentration ranges of these ions serve as a guide to water management authorities for monitoring of the presence of dissolved salts in surface water. In the Vhembe District, communities rely on both ground and dam waters for domestic use.
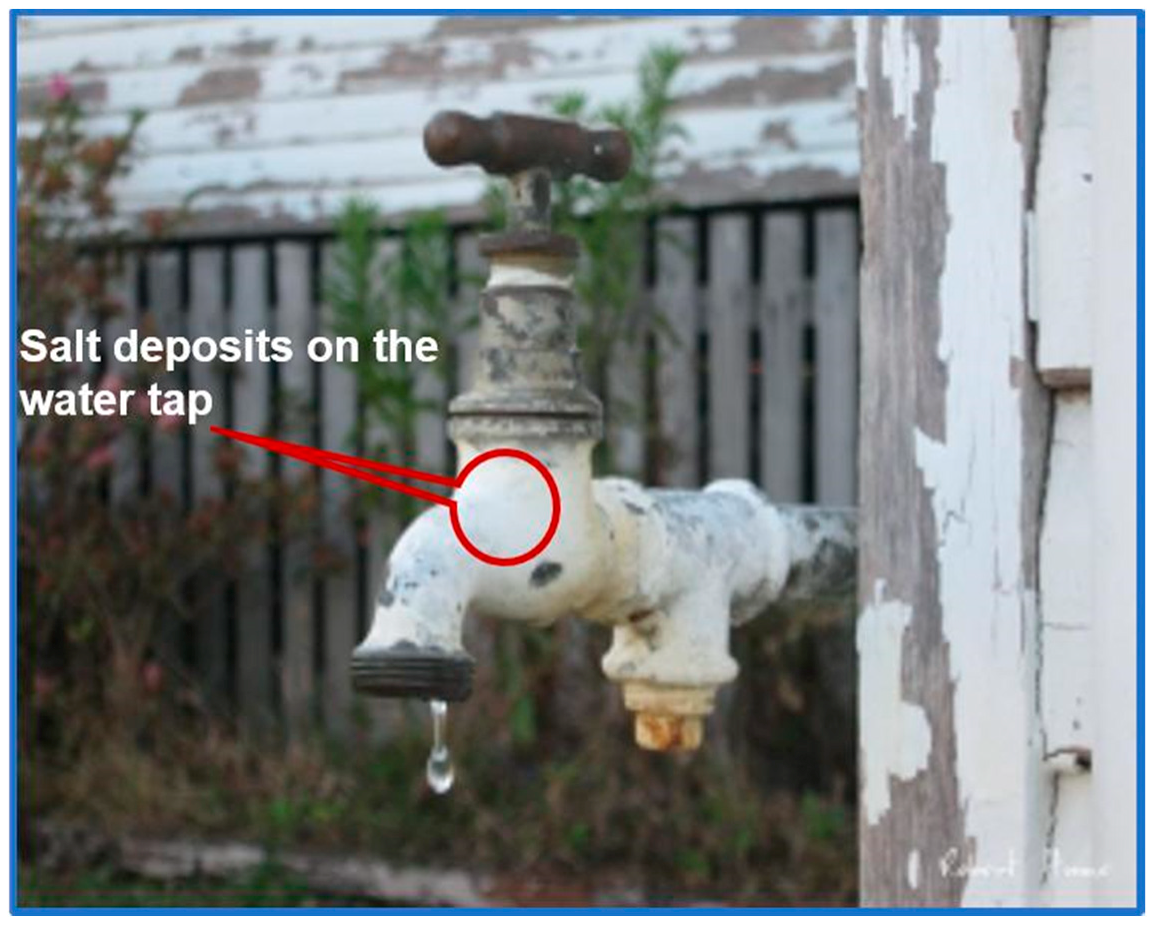
However, the presence of the dissolved salts from the water sourced from Nandoni Dam may pose a health danger to the people using this water for drinking, as there are no physical indicators on the quality of water being consumed.
The concentrations of all mineral ions that constitute water salinity were determined and the results are presented in
Table 5. The amounts of all ions studied were found to be significantly different throughout the seasons, with higher concentrations being observed during dry seasons (i.e., winter and spring). However, the detection of individual ions such as chloride and sodium ions demonstrated that the water in the Nandoni Dam was moderately saline, with chloride and sodium ion concentrations being below those of brackish water.
Although the ion concentrations of the Nandoni Dam are lower than those of brackish water, their total chemical interactions may lead to compromised water quality with unfavourable taste (too salty for drinking) and odour. For instance, sodium is available in water bodies in several chemical compositions that include sodium chloride, sodium carbonate, sodium sulphate, sodium phosphate, sodium bicarbonate and others.
3.2. Statistical Analysis
The single variance ANOVA test was used to determine the significant difference in water pollution by different ions that contribute to water salinity in Nandoni Dam at all seasons of the year. The Null hypothesis was that, there was no statistical significant difference in the concentrations of ions that affected the water salinity at different seasons of the year. That is expressed as µ
1 = µ
2 = µ
3 = µ
4 where µ
1, µ
2, µ
3 and µ
4 are the mean values of each parameter in spring, summer, autumn and winter respectively. F-values above 0.05 (presented in
Table 6) indicated that there is a significant difference in concentrations of ions contributing to water salinity at all seasons of the year except chloride, nitrate and sodium ions.
The student
t-test was further applied to determine if the water salinity falls within the brackish water brackets. The null hypothesis of a one-tailed test with the α = 0.05 was defined that the water in Nandoni Dam was brackish and the alternative hypothesis was that the water was fresh. The results were derived from the standard figures of fresh and brackish water presented in
Table 3 and
Table 4. For example, the null hypothesis was defined that the concentration of chlorides ions (that is the concentration in the range of 500–5000 mg/L) was in the category of brackish water. The
p-values of the salinity and magnesium concentrations showed that the water in Nandoni Dam was brackish except the rest of the other parameters that determine if the water is brackish of not.
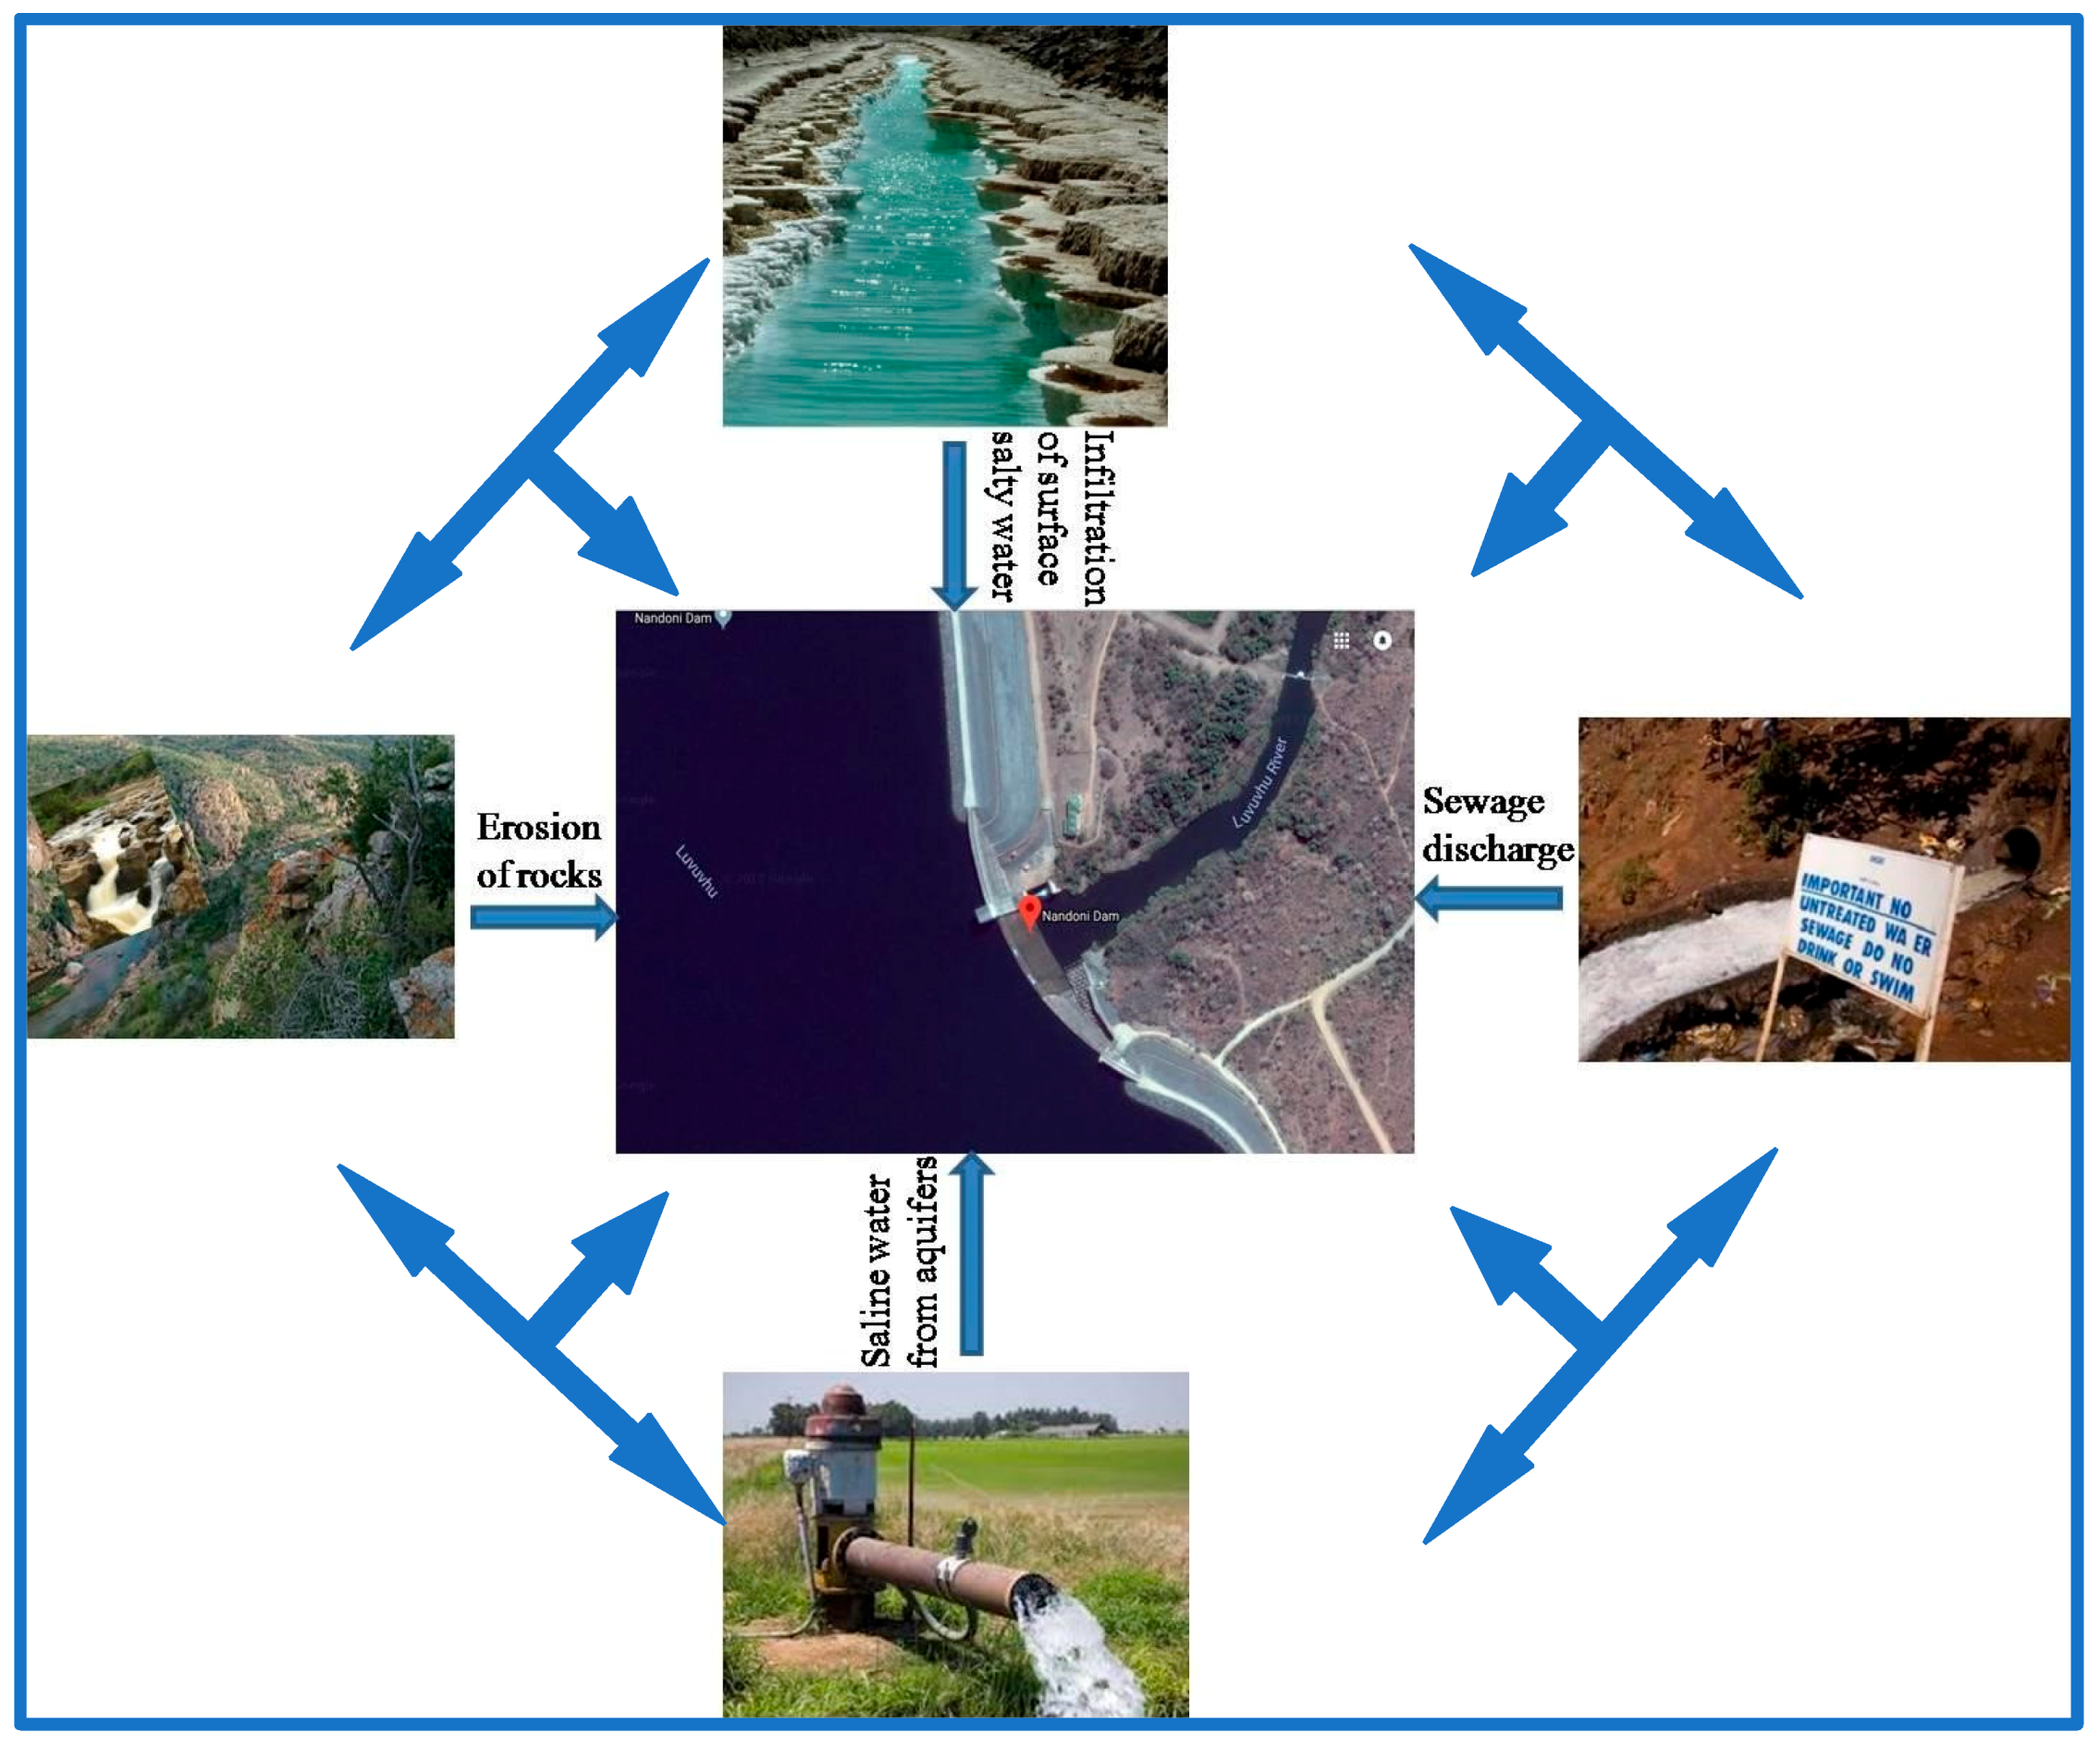
The most likely causes of salinity in the Nandoni Dam are presented in
Figure 3. Such causes include the erosion of salt-bearing rocks, infiltration of the saline water from aquifers by natural and anthropogenic activities, sewage discharge and the landfill leachates that contain dissolved salts [
40,
41,
42,
43]. The contribution of the sewage discharge to the surface water salinity is less significant compared to other sources. However, it affects the quality of the water by introducing high levels of pathogens and other contaminants, thus making the water sources unfit for domestic use [
44,
45,
46]. The erosion of the salt-bearing rocks are common in the Luvuvhu River and its tributaries, which are the main source of water supply for the Nandoni Dam. Source waters in the Vhembe District such as underground water and open wells are characterized by high levels of dissolved salts, which are assumed to find their way into the Nandoni Dam through small streams and tributaries that flow into the Luvuvhu River. Thus, these factors could contribute to the various levels of water salinity during different seasons of the year. The findings reported from a study conducted in Northern Cape in South Africa indicated the presence of Cl
−1 and Na
+ ions in the river water as well as the alluvial aquifers at the concentrations of 320–14,588 mg/L and 143–4933 mg/L [
47]. The main identified possible sources of the high levels of these ions were seawater intrusion, evaporitic salts dissolution, concentrations by evaporation, deep aquifer brines, dissolution of minerals from the aquifer geology as well as salts from anthropogenic activities (i.e., mining). Although this work was focused on determination of the water salinity, it was found that the quality of the water from Nandoni Dam was generally poor. The presence of ammonium in the concentration ranges of 1.32–5.96 mg/L exceeding 1.00 mg/L [
48], which is the permissible WHO limits, demonstrates that the water is not only unfavourable for drinking but also toxic for both aquatic life and human use. While other anions were below the permissible limits of different organizations such as WHO, USEPA, and South African standards (SANS 241) in drinking water, the nitrates were found to be generally higher than the SANS 241 set standards of 6.00 mg/L [
49].

 ,
, 


