Microbial Function and Hydrochemistry within a Stratified Anchialine Sinkhole: A Window into Coastal Aquifer Interactions


Department of Cell Biology, Microbiology and Molecular Biology, University of South Florida, Tampa, FL 33601, USA
*
Author to whom correspondence should be addressed.
Water 2018, 10(8), 972; https://doi.org/10.3390/w10080972
Submission received: 17 April 2018
/
Revised: 16 June 2018
/
Accepted: 29 June 2018
/
Published: 25 July 2018
(This article belongs to the Special Issue Salinization of Coastal Aquifer Systems)
Abstract
:Anchialine sinkholes provide insight into coastal aquifer systems and coastal mixing processes. Aquifer microbial community function is usually inferred from hydrochemical information, but there are few direct studies of microbial communities in the Floridan Aquifer. Hospital Hole is a 43 m-deep stratified sinkhole under the Weeki Wachee River, FL, with three distinct brackish layers: a hypoxic layer, a chemocline and a sulfidic anoxic layer. Illumina sequencing and bioinformatic tools were used to reconstruct metabolic functions and interactions of microbial communities in each layer. Each layer appears to originate from different parts of the coastal mixing zone and has a distinct microbial community with unique functions, which are influenced by the respective hydrochemistry. Sulfide oxidation and nitrate reduction are the most abundant functions. Syntrophy between methane oxidizers, methanogens and sulfate reducers is present. Similarities between the hydrochemistry and potential connectivity of Hospital Hole and the Floridan Aquifer coastal mixing zone suggest that microbial communities of Hospital Hole could be a surrogate for the coastal mixing zone of the aquifer in the absence of direct studies. Understanding how groundwater microbial communities react to saltwater intrusion and nutrient flux will be useful in predicting how coastal aquifer regions might react to anthropogenic change.
1. Introduction
Karst landscapes make up 20 percent of the world’s landmass. Human populations within Northwest Australia, the Caribbean, Eastern Europe and the Southeastern United States obtain municipal water from karst aquifers [1]. The Floridan Aquifer is one of the most productive aquifer systems in the world, with billions of liters of water withdrawn for human use daily. Studies of this and similar aquifers are important because anthropogenic activities cause a decline in overall water quality. In coastal karst systems, saltwater can infiltrate into the freshwater layer of the aquifer, and other contaminants such as nitrate from agricultural run-off or wastewater infiltration may be present [2].
Microbial processes affect hydrochemical cycling and contaminants within the groundwater. Microorganisms utilize several pathways within both the sulfur cycle and the nitrogen cycle, which are often coupled. Some sulfur-oxidizing Bacteria link sulfur oxidation with dissimilatory nitrate reduction to ammonia. Hydrogen sulfide may cause sulfur oxidation to couple with denitrification instead of dissimilatory nitrate reduction to ammonia [3]. Anaerobic degradation of organic material is often limited to small organic substrates [4]. Nutrient availability regulates organic matter degradation in the aquifer, which is carried out by acetogenic Bacteria, methanogens or sulfate reducers [5].
The Floridan Aquifer has two distinct layers, the Upper Floridan Aquifer and the Lower Floridan Aquifer, which are separated by at least one confining unit. The Upper Floridan Aquifer is characterized by freshwater, which can be discharged by springs or recovered from wells and utilized as a municipal water source [6]. Deeper regions of the Upper Floridan aquifer can contain saltwater, but in coastal regions, salt water infiltrates the shallower and normally freshwater regions of the Upper Floridan aquifer. Sulfate is also present within this system, either from saltwater intrusion, or from dissolution processes of gypsum within the aquifer. Phosphate and nitrate from fertilizers can infiltrate the Upper Floridan Aquifer in unconfined regions. The primary geological formations within the Upper Floridan Aquifer in the study region are the Ocala Limestone and the Avon Park Formation [2].
Most studies of the Upper Floridan Aquifer have inferred the presence of microbial communities from hydrochemical analyses. Only a few direct studies of microbial diversity within karst systems have been carried out. In the Edwards Aquifer in Texas, microbial community structure varied with hydrochemical stratification [7], and in the Wakulla spring system in North Florida, a spatial-temporal distribution of the microbial communities was observed [8]. The ability to study microbial processes within aquifers is limited by technical difficulties in sampling subsurface water. Sinkholes are prevalent within karst systems and common to West-Central Florida. These sinkholes allow access to Upper Floridan Aquifer water and may provide insight into the hydrochemical processes within the aquifer. Coastal saltwater wedge intrusion into the fresh water aquifer causes stratification that produces anchialine systems [9], which can extend into coastal water-filled sinkholes. Analysis of water samples from these coastal sinkholes may provide insight into microbial processes within coastal aquifers.
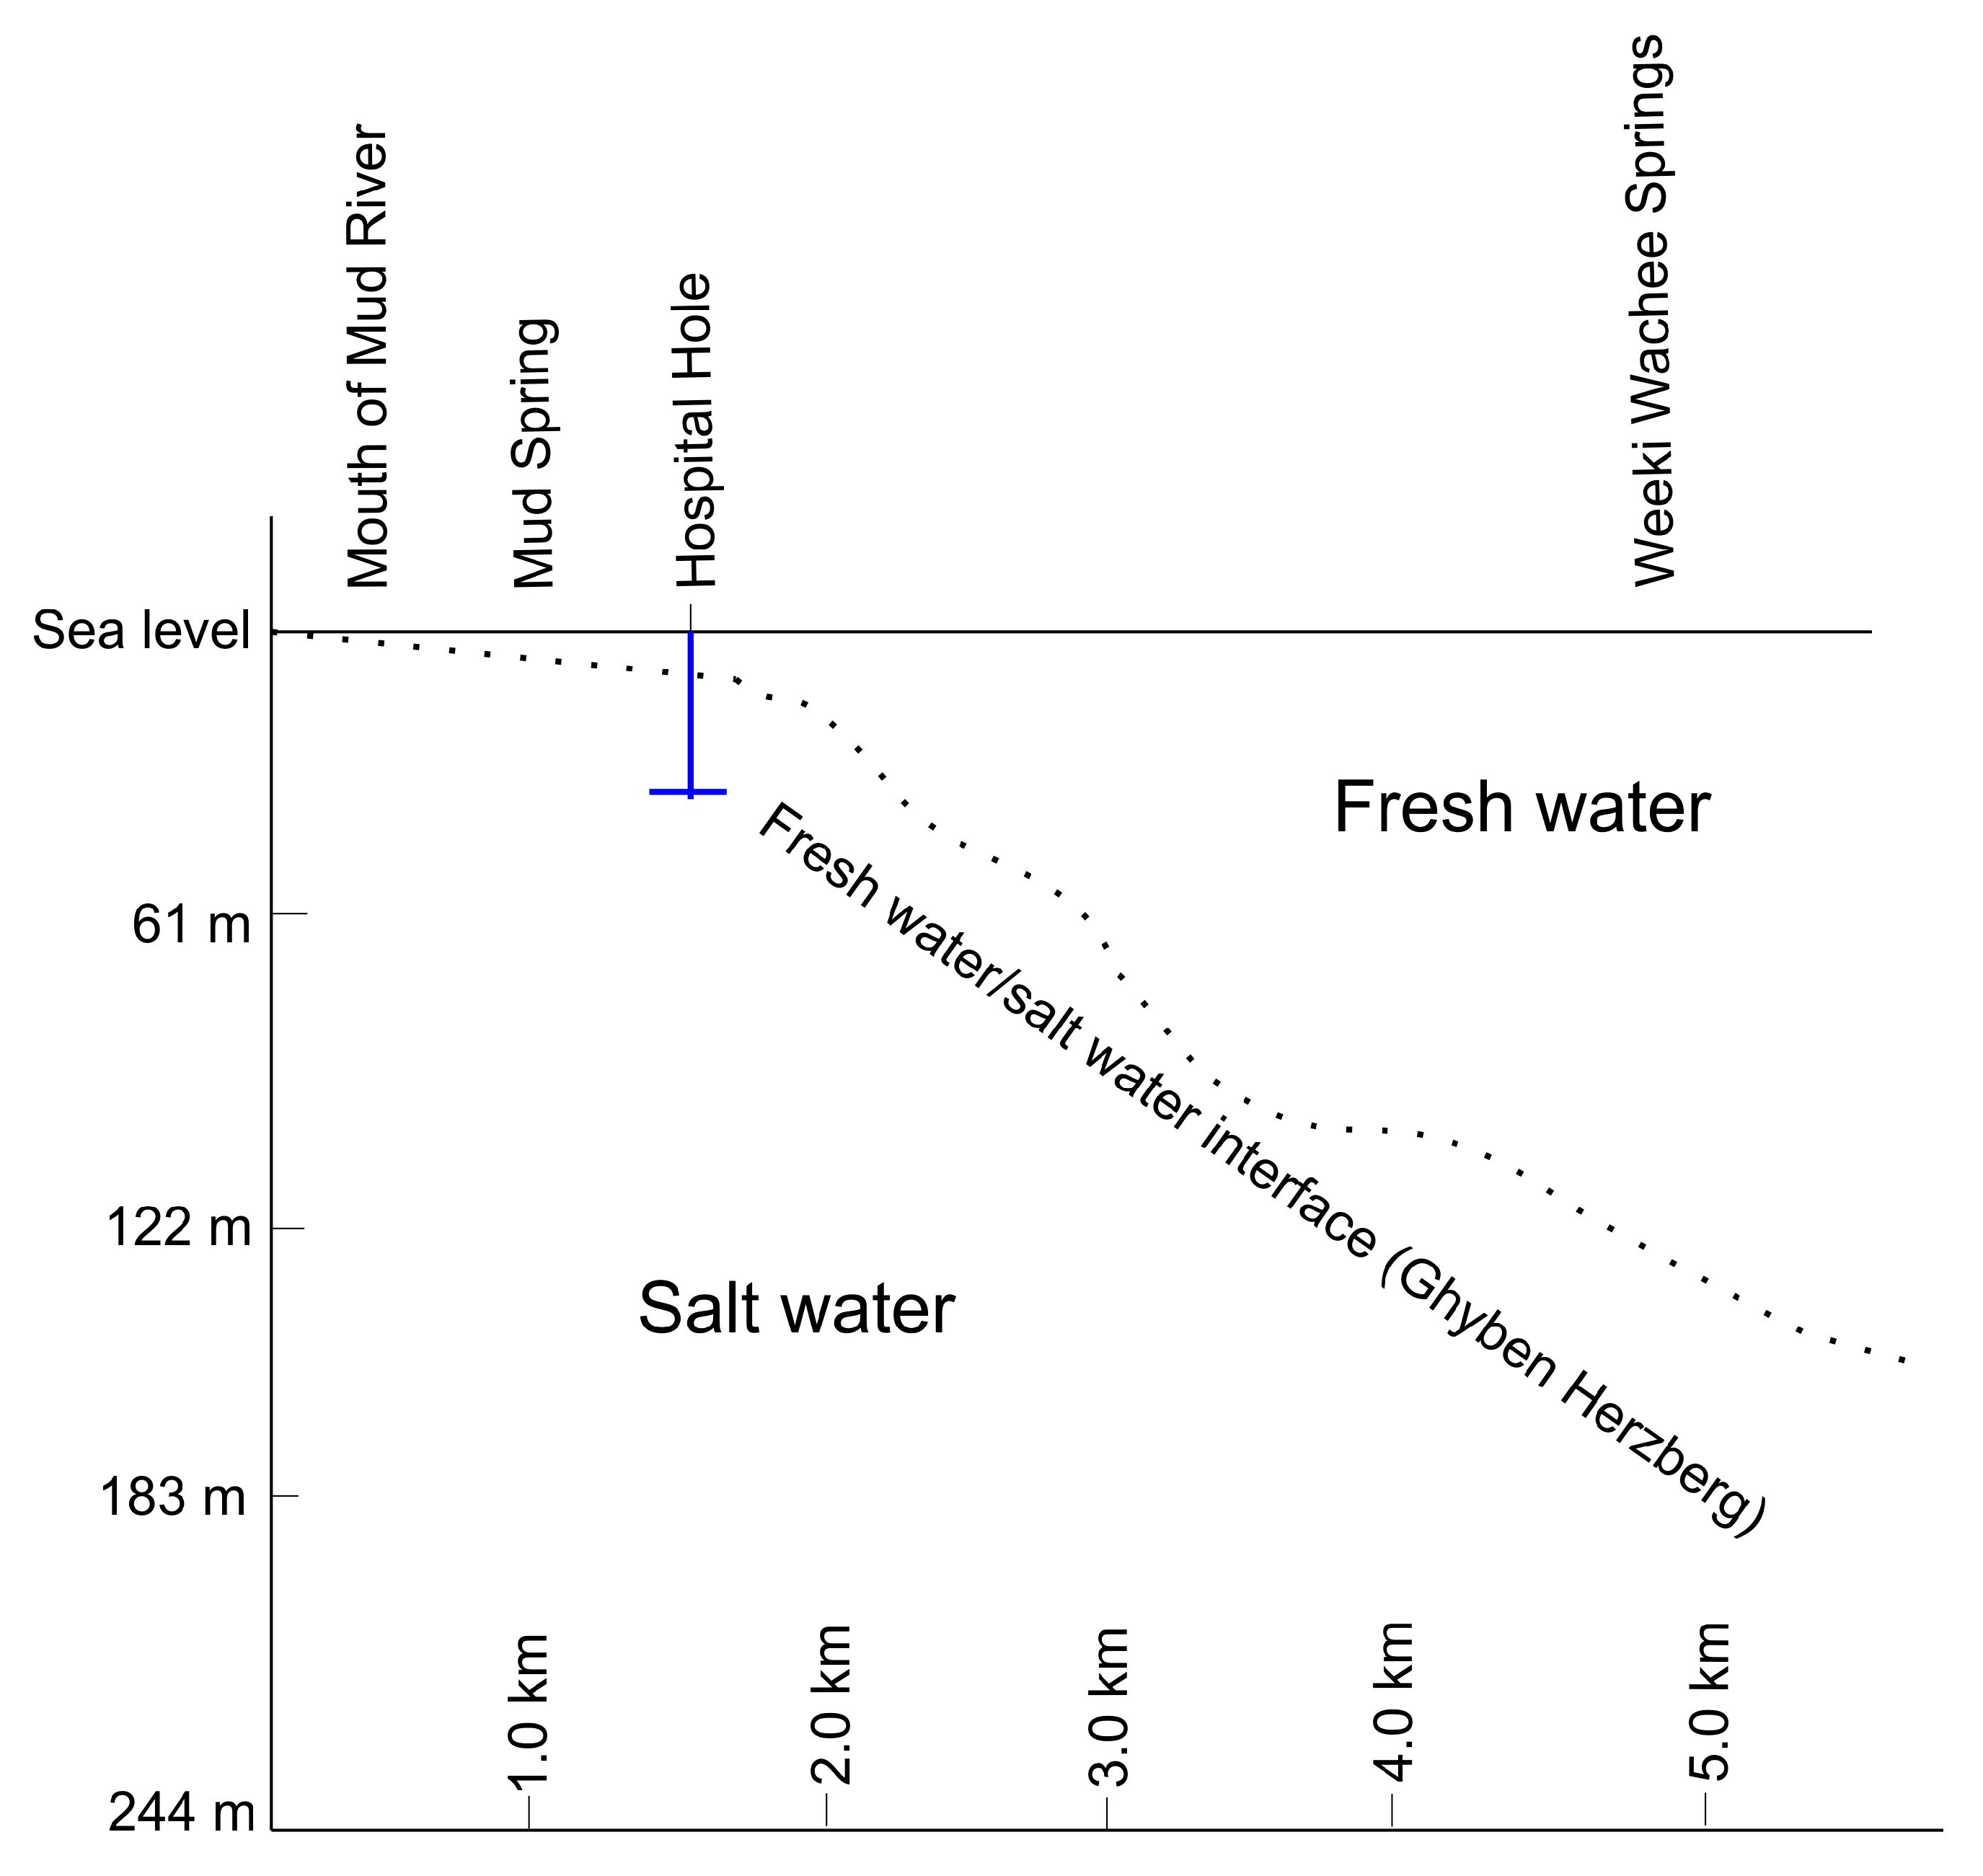
This study focuses on Hospital Hole, a coastal stratified anchialine sinkhole located underneath the Weeki Wachee River in Florida. Although it may have similarities to the coastal aquifer mixing zone, it does not represent the entire Floridan Aquifer. Distinct layers of water appear to be derived from parts of the Upper Floridan Aquifer via active conduits [6]. Hospital Hole is easily accessible by SCUBA divers and thus offers an easily studied window into the coastal aquifer mixing zone. The proximity to the coast and the presence of saltwater suggests that this sinkhole is influenced by coastal mixing processes, as shown in Figure 1, which demonstrates the location of Hospital Hole in relation to the coastal mixing zone. Hospital Hole appears similar to Jewfish Sink, an offshore sinkhole in West-Central Florida. The microbial community structure and function of this offshore sinkhole [10] appear connected to the coastal mixing zone of the Upper Floridan Aquifer, and thus, there could be similarities between the microbial community in Jewfish Sink and Hospital Hole. We hypothesize that each distinct layer of Hospital Hole hosts a distinct microbial community that fulfills an ecological function and service to the system. Studies of Hospital Hole and other coastal sinkholes can identify and characterize microbial processes that occur within the coastal mixing zone. The primary focus of this paper is to characterize the microbial communities and their function within this sinkhole to determine if these communities could be similar to those within the coastal mixing zone of the Upper Floridan Aquifer. Hydrochemical analyses were utilized in order to understand some of the nutrients utilized by the microbes within Hospital Hole.
2. Materials and Methods
2.1. Site Description
Hospital Hole is a submerged, anchialine sinkhole in the Weeki Wachee River, FL, as shown on the map in Supplemental Figure S2. It is located in West-Central Florida 1.4 km from the Gulf of Mexico. It is 44 m in maximal diameter and about 44 m in depth, depending on tide [6]. There are four layers within this system, as shown in Figure 2. The first is the surface river layer, which is no more than 3 m deep. The hypoxic layer is located between a 3-m and 21-m depth. At 21 m, there is a mixing zone between the hypoxic and anoxic layers, which contains particulate matter that looks cloudy and opaque and varies in thickness, from 6 m [6] to as thin as 3 cm. This mixing zone is referred to as the chemocline throughout the paper because of the distinct hydrochemical differences (e.g., salinity, sulfide, nitrate, temperature and pH) in the hypoxic layer above to the anoxic layer below, which is outlined in the Results and Discussion sections. The bottom is the anoxic layer, which extends to the bottom of the sinkhole and is characterized by the absence of light. There is a horizontal vent at 21 m that can discharge water into Hospital Hole [6].
2.2. Sampling Strategies
The overall strategy was to collect five replicate samples per layer for both hydrochemical and DNA sequencing analysis. Scientific divers collected water in five 500-mL bottles for DNA analysis and in five 125-mL glass bottles for chemical analysis (sulfide, sulfate, phosphorus, nitrite, nitrate, alkalinity and ammonia). Samples from the surface layer were collected at a depth of less than 1 m; from the hypoxic layer at 15 m; from the chemocline at roughly 21 m (depending on tide); and from the anoxic layer at 27 m. A Hydrolab DS5 accompanied divers on each dive in order to collect pH, salinity, temperature, depth and dissolved oxygen (OTT Hydromet, Loveland, CO, USA). All samples and data collections were made in March 2016, except for dissolved oxygen, which was from December 2015.
2.3. Hydrochemical Analysis
Depth, pH, temperature, conductivity, dissolved oxygen and salinity were collected at 30-s intervals using the Hydrolab DS5X (Hydromet). Water samples were collected by divers at each layer (four depths), transported on ice and analyzed in the lab. Nitrite (HACH, Loveland, CO, USA; Method 10207), nitrate (HACH; Method 8171), ammonia (HACH; Method 10205), total phosphorus (HACH; Method 8190), alkalinity (HACH; Method 10239), sulfide (HACH; Method 8131) and sulfate (HACH; Method 10248) were performed on our HACH DR 3900 spectrophotometer. We used the protocols from the manufacturer with some modifications; we used Nanopure water for all necessary sample dilutions. We were unable to measure organic carbon with HACH total organic carbon kits because high chloride interfered with the spectrophotometric method available.
2.4. Biological Analysis
Water samples were collected and filtered (500 mL) through 0.22-µm filters. Illumina sequence analyses of three replicates from each layer (hypoxic, chemocline and anoxic) were carried out.
Environmental DNA was extracted from filters using a phenol/chloroform procedure and used for PCR amplification with pro341f and pro805r primers [11]. PCR products were purified using AmPure XP beads (Illumina, San Diego, California, USA). Illumina 300-bp paired-end sequencing was done commercially (Applied Biological Materials Inc., Richmond, BC, Canada) from three replicate DNA samples from each layer (hypoxic, chemocline, anoxic) of the sinkhole. Sequences were analyzed using Mothur software [12] using their MiSeq standard operating procedures in which paired sequences were combined and ambiguous or chimeric sequences and those of unexpected length or poor quality removed. Sequences were compared to the Silva Version 128 database for initial identification. Bacterial and Archaeal sequences were clustered to operational taxonomic units (OTUs) of 97% identity. Bacterial and Archaeal sequences were clustered separately. For Archaea, the bootstrap cutoff for classification was 50; Bacteria followed the Mothur protocol using a cutoff of 80.
The top 100 Bacterial OTUs for each layer were identified, used as a GenBank query, and the nearest identified sequence match was used to provisionally identify each operational taxonomic unit (OTU). Due to the overlap of these OTUs in each layer, a total of 186 OTUs were investigated. Several sequence identified OTUs were given the same provisional identification. For example, OTU 1 and OTU 6 were both identified as Sulfurimonas, and references to Sulfurimonas included both OTUs. Archaea were processed similarly, but because there were far fewer Archaeal sequences, the top 25 OTUs for each layer were identified and a total of 54 OTUs investigated.
The potential metabolic function of each OTU was assigned by a review of the literature for each identified prokaryote. If a provisionally-identified OTU had more than one metabolic function (e.g., sulfur oxidizing and nitrogen reducing), it was scored in both categories. OTUs identified as fecal Bacteria, pathogens or previously found in wastewater treatment plants were categorized together. Facultative anaerobes and aerobes were categorized in the “facultative” category. Microbes listed as anaerobes were obligate. The aerobes category included obligate and microoxic microbes. Halotolerant and halophilic microbes were listed together. Sulfur reducers included sulfur disproportionation and dissimilatory sulfate reduction functions. Sulfur oxidizers included microbes that oxidize any sulfur compounds. Nitrogen reducers included microbes that carry out denitrification, nitrogen fixation and dissimilatory nitrogen reduction. Nitrogen oxidizers included microbes that can utilize nitrification and anaerobic ammonia oxidation. Methanogens included microbes that were obligate methane producers.
The relative abundance of sequences with a particular metabolic function (sequence abundance) was calculated independently in each layer. For each layer, the number of sequences with a provisional function was divided by the total number of sequences in the layer and converted to a percent. The 186 most abundant OTUs that represented the 100 most abundant Bacterial sequences in each layer were analyzed for function and represented 75,415 sequence or 30% of the sequences in our dataset. Archaea and Bacterial sequence abundance were calculated separately. The 55 most abundant Archaeal OTUs that represented the 25 most abundant sequences in each layer were analyzed for function and represented 10,651 sequences or 16.7% of the sequences in our Archaeal dataset.
2.5. Statistical Analysis
Statistical analyses of the replicate microbial community and hydrochemical data were performed using Primer v7/Permanova + statistical software (Primer-E Ltd., Albany, New Zealand). Abiotic data were transformed (log X + 1), normalized and clustered using Euclidean distance [13]. The OTU abundance of each replicate was used for the top 2000 OTUs for Bacteria and the top 200 OTUs for Archaea in our dataset for Primer-E biological analysis. Biological data were square-root transformed and clustered using Brays–Curtis similarity [13]. Biological and abiotic replicate data were analyzed using principal coordinate analysis (PCoA). A Bio-Env (BEST) analysis was performed to determine relationships between biotic and abiotic datasets [13]. Principal coordinate analyses were utilized in order to avoid multicollinearity, non-linearity and non-normality within the biological and abiotic data. Rarefaction curves were produced using PAST3 software for each layer by summing across the replicates [14].
3. Results
Hydrochemical analysis showed vertical stratification within Hospital Hole (Table 1). Alkalinity values were lowest in the surface layer and highest in the anoxic layer. The anoxic layer had higher ammonia and nitrate concentrations than the other layers. Phosphorus concentrations were highest in the surface layer. The chemocline layer had the highest concentration of nitrite. Sulfate was highest in the anoxic layer and was lower in the upper layers.
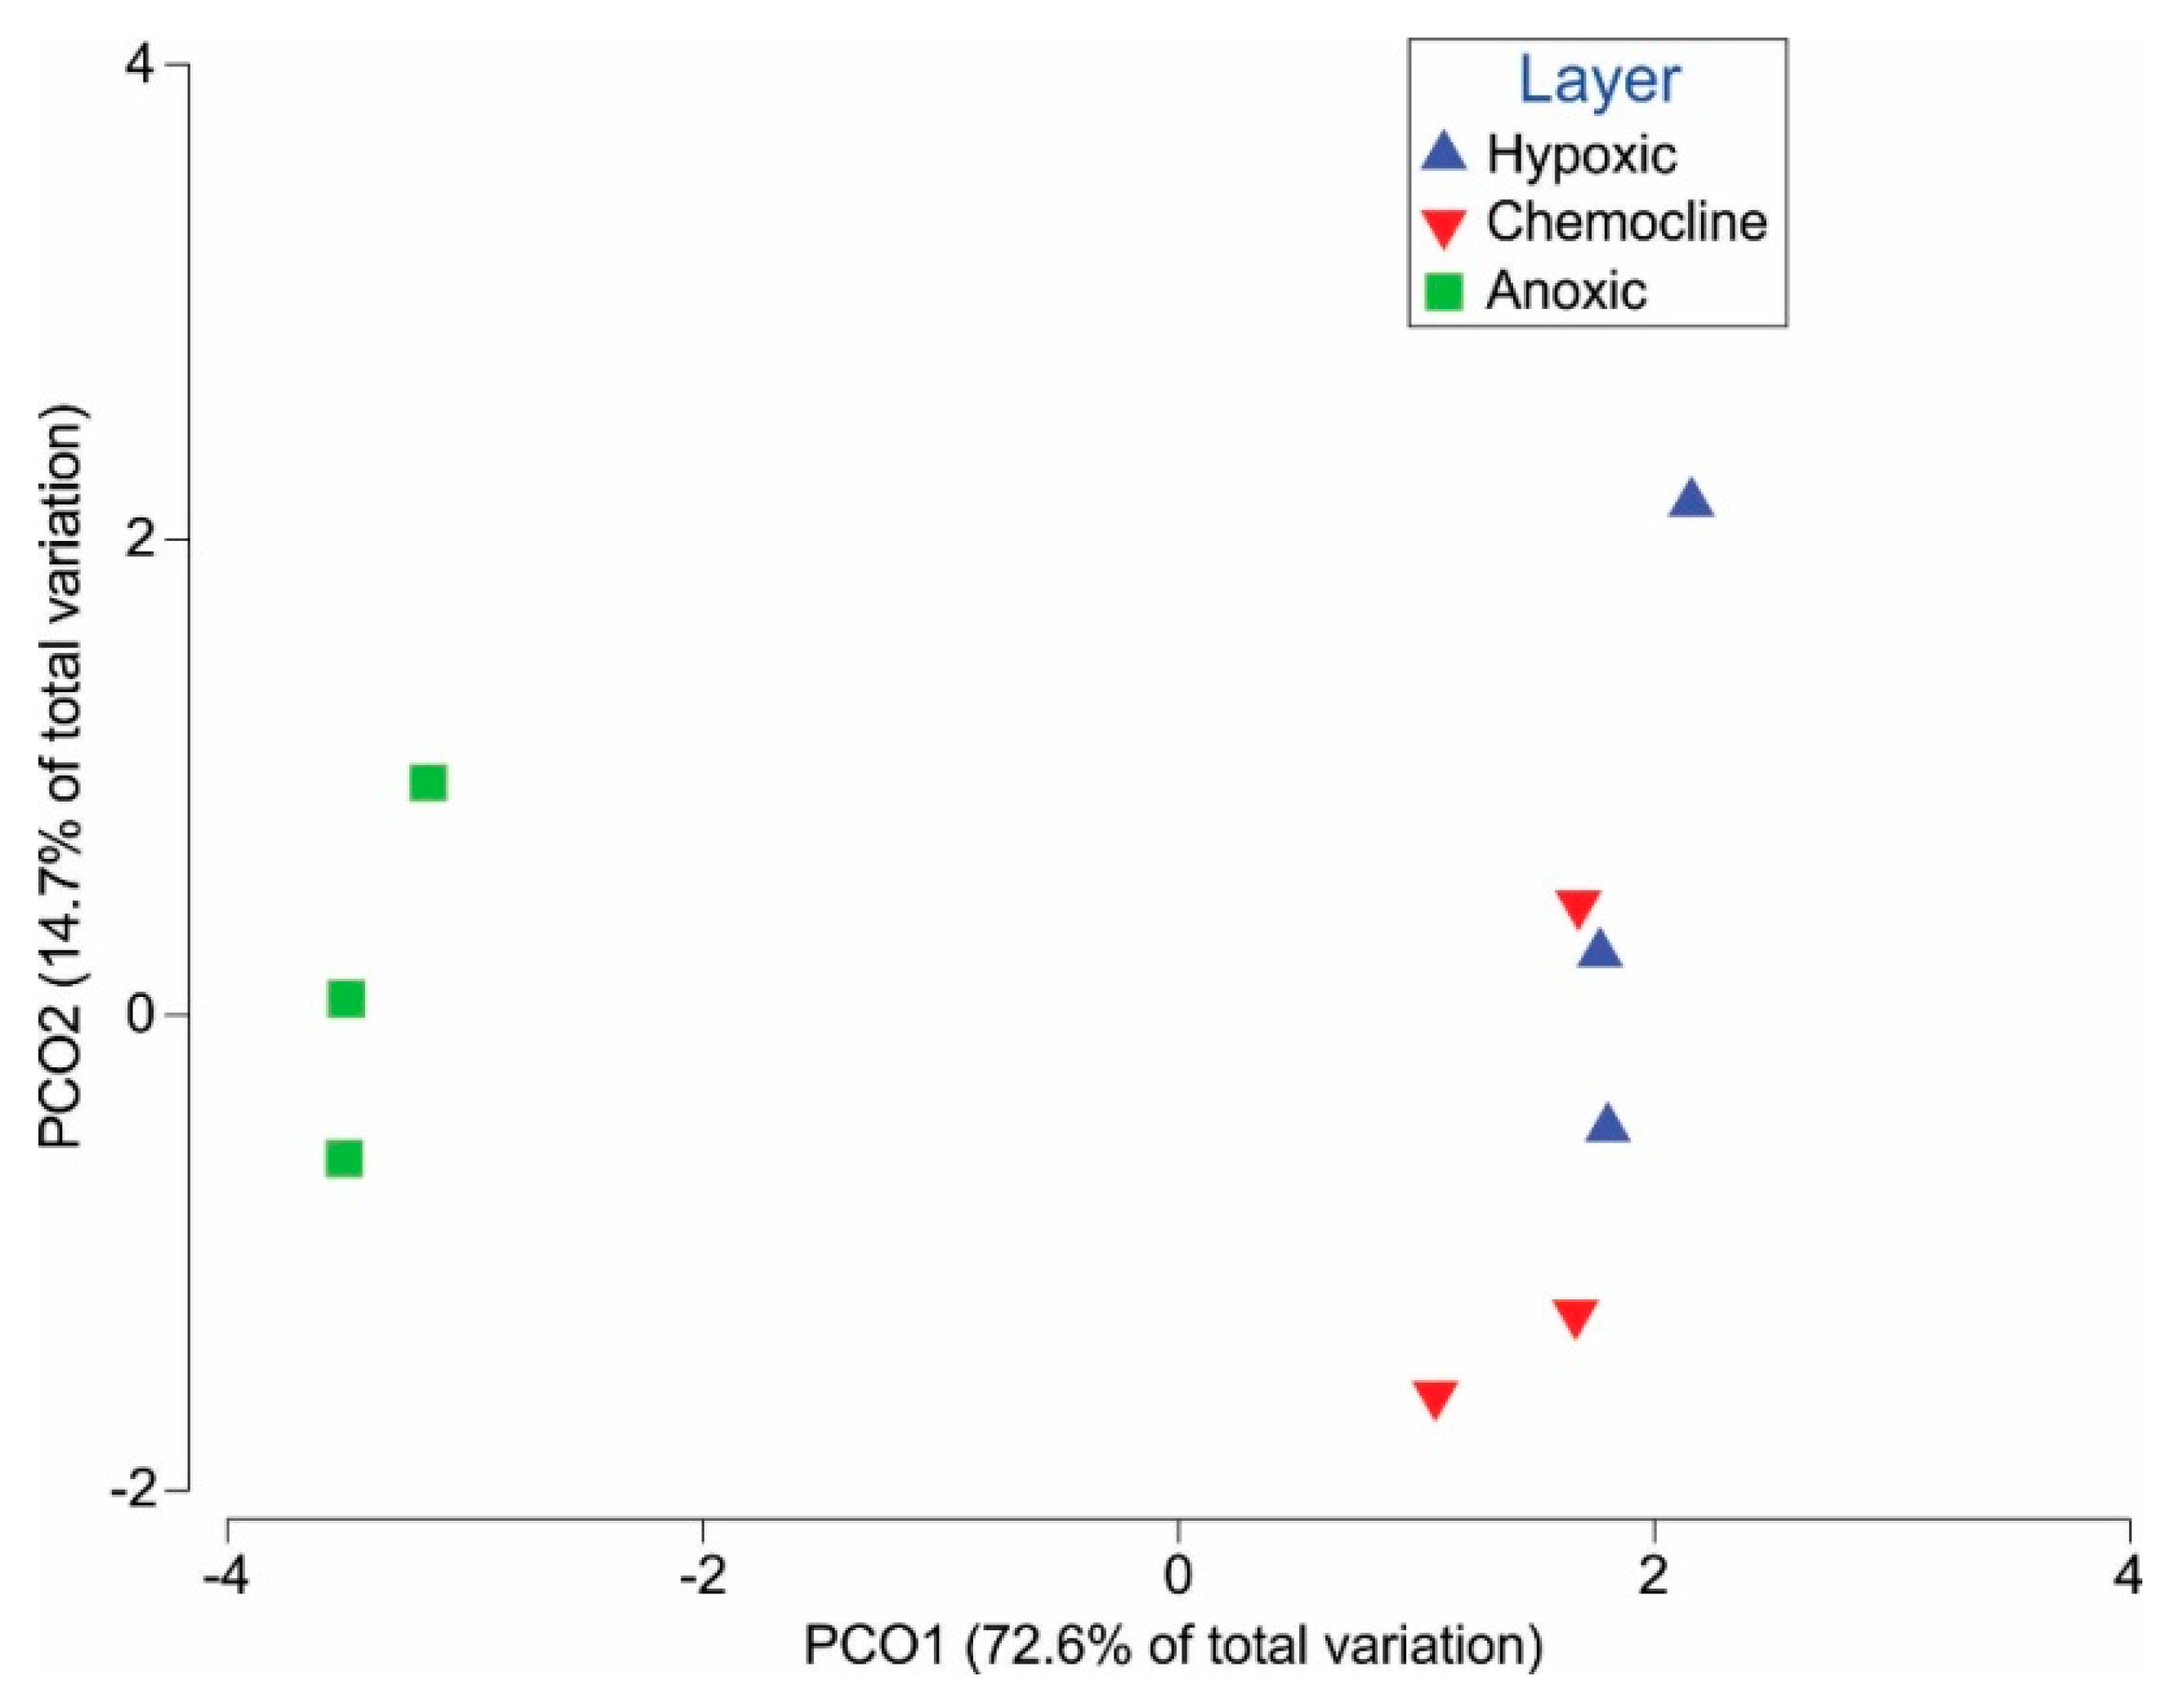
Hydrolab profiles also showed vertical stratification (Table 1). Salinity values at the surface were <1 ppt, increased to 10.09 ppt in the hypoxic layer and 14.90 ppt in the anoxic layer. Dissolved oxygen values were the highest in the surface layer (6 mg/L), were detectable in the chemocline and hypoxic layer and decreased to 0 mg/L in the anoxic layer. The pH was highest at the surface at 7.91 and decreased to 7.47 in the hypoxic layer and was 7.27 in the anoxic layer. Water temperature was generally 24 °C, but dropped to about 20 °C in the anoxic layer. The hydrochemistry PCoA plot (Figure 3) shows three distinct layers: the surface layer, the chemocline/hypoxic layers and the anoxic layer.
Mothur analysis of Illumina sequencing revealed 7432 distinct Bacterial OTUs representing 249,184 sequences and 2422 distinct Archaeal OTUs representing 10,651 sequences. Most of the sequences categorized by Mothur as “unknown” were found to be Archaea upon subsequent basic local alignment search tool (BLAST) analyses and so were included as Archaeal sequences in this study. Illumina sequences from the top 2000 Bacterial OTUs and the top 200 Archaeal OTUs were analyzed by principal coordinate analysis and coded by layer. The hydrochemical analysis is overlaid on the plot (Figure 4). Sequences from the anoxic layer clustered separately from the hypoxic layers. The chemocline separates as its own layer, but appears to be similar to both the hypoxic and anoxic layers.
Bioinformatic results are shown in the Supplemental Materials as a spreadsheet. These include the percent of match to closest identified genus and the known metabolic functions of the provisionally-identified genus.
The identity and function of the top 100 distinct OTUs in each layer were analyzed in detail and represent ~30% of the sequences. Archaeal sequences represented 4.1% of the total sequences identified. The 25 most abundant provisionally-identified genera in each layer are shown in Table 2.
Roughly 20% of the Bacterial sequence abundance in each layer identified microbes that are known fecal Bacteria and/or known pathogens (Table 3). Facultative aerobes/anaerobes were present in all layers. Bacterial sequence abundance of obligate anaerobes was higher in the chemocline and anoxic layers than in the hypoxic layer. Sulfur oxidizers and nitrogen reducers were present in all layers, while photosynthetic Bacteria were only in the hypoxic layer (1.4%). Methane oxidizers were identified in the anoxic layer (4.7%). The Bacterial sequence abundance of sulfur reducers was highest in the anoxic layer. Microbes capable of iron reduction and manganese oxidation were not identified in this system. Methanogens were present mainly in the anoxic layer (92.9%), and nitrifying Archaea were dominant in the hypoxic layer (90.8%).
4. Discussion
4.1. The Hypoxic Layer
The fresh river water flowing above the hypoxic layer is from Weeki Wachee Spring, several kilometers to the east. The hypoxic layer begins 2–3 m below the river surface where there is a halocline and salinity increases rapidly to 10 ppt (Table 1). Dissolved oxygen in the hypoxic layer varies from 0–1 mg/L and appears to be influenced by a vent that we observed located at 22 m [6] as indicated by a spike in oxygen around this depth (Table 1). Small contributions of dissolved oxygen from this and other vents appear to have selected for both aerobes and facultative aerobes/anaerobes (Table 3). The salinity and sulfate content suggests that water in the hypoxic layer is derived from the shallower part of the coastal mixing zone. Water with similar properties has been found in the Double Keyhole Spring system [13] and wells at least 160 m deep (Table 4), which penetrate the Avon Park Formation according to the well description by the South Florida Water Management District (SWFMD). Despite this comparison, we are currently unable to determine whether the sulfate is derived from gypsum dissolution from deeper within the aquifer or from saltwater from the Gulf of Mexico. The saline water in the hypoxic layer appears to select for halophilic microbes (Table 3).
Although some light penetrates the hypoxic layer (Figure 2), photosynthetic Bacteria represented only 1.4% of the sequence abundance of the layer (Table 3), and eukaryotic macroalgae were not observed. This could be explained by the shady location of Hospital Hole (Supplemental Figure S2). The predominant photosynthetic Bacteria present include Rhodobacter, Prochlorococcus and Roseobacter. The fifth most abundant microbe within this layer is Prochlorococcus, which is commonly found in aerobic marine ecosystems (Table 2). Rhodobacter is an anaerobic phototroph (Supplemental Table S1), while Roseobacter is also commonly found in aerobic marine ecosystems. Freshwater photosynthetic Bacteria, especially the kinds of Cyanobacteria commonly associated with Florida springs [15], have not yet been identified in the hypoxic layer.
4.2. The Anoxic Layer
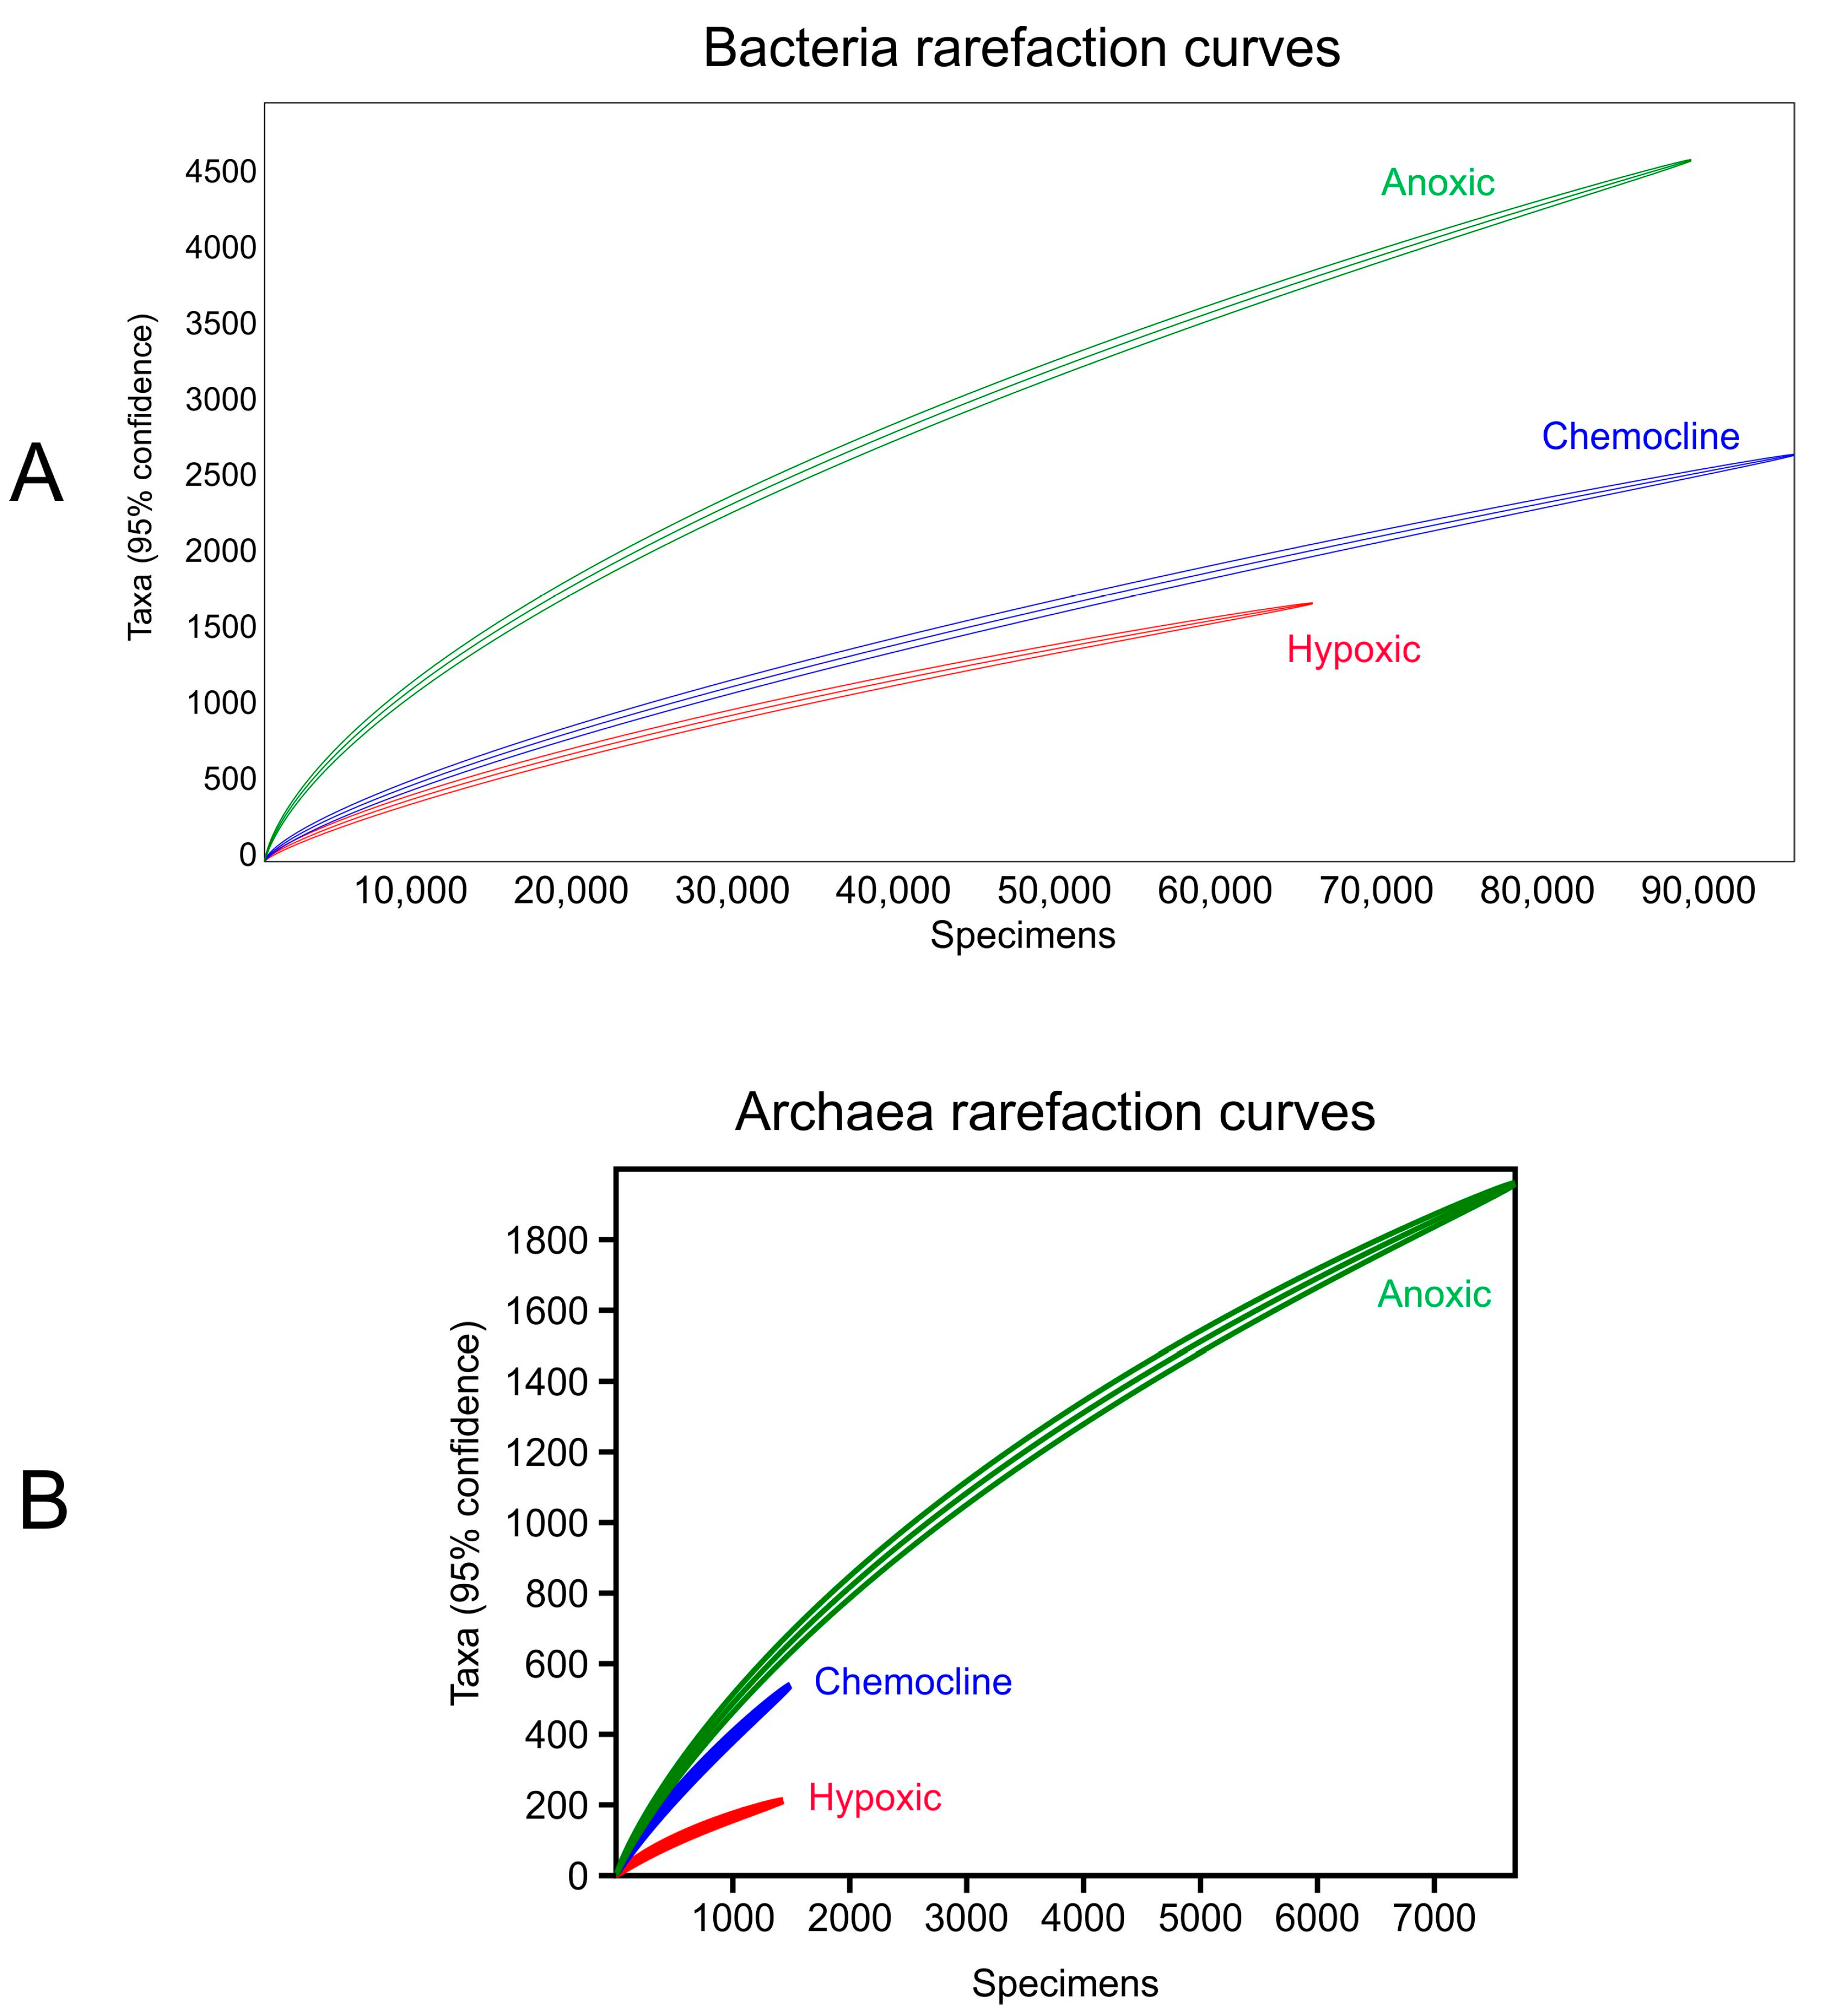
The anoxic layer is below the particulate-containing chemocline layer and extends to the bottom of the sinkhole. Light does not penetrate into this region (Figure 2). The signature of this layer is increased hydrogen sulfide and salinity compared to the hypoxic layer. Because of its salinity and sulfate content, it is likely that this water originates deeper in the coastal mixing zone than the hypoxic layer. Water with similar properties has been observed in nearby coastal sinks such as Palm Sink [16]. The high concentrations of sulfide (~30 mg/L) and sulfate (~1000 mg/L) in Hospital Hole (Table 1) are comparable to some Bahamian blue holes [17]. Despite comparisons of local wells to Hospital Hole (Table 4), we are unable to determine whether the source of the sulfate in the anoxic layer is primarily from dissolution of gypsum from deeper within the aquifer or derived from salt water from the Gulf of Mexico. Sulfur-reducing Bacteria were present in the anoxic layer (Table 3), and they are responsible for producing the hydrogen sulfide by utilizing carbon and sulfate [18]. The rarefaction analysis demonstrates that this community is more diverse than the communities within either the chemocline or hypoxic layers (Figure 5).
4.3. The Chemocline
The chemocline is defined as the boundary between the hypoxic and the anoxic layers. Particulate matter descends through the water column and forms a cloud-like zone at the bottom of the hypoxic layer (Figure 2) due to the higher density of the anoxic layer (Table 1). The thickness of the particulate layer likely depends on the degree of disturbance in this layer, such as from divers or from tidally-caused vertical mixing.
The hydrochemical and biological PCoA analyses each tell a unique story. Permutational multivariate analysis of variance (PERMANOVA) of the hydrochemical data from each layer shows that the chemocline is hydrochemically distinct from both the anoxic and hypoxic layers (p = 0.009). The hydrochemical PCoA suggests that the chemocline layer is most like the hypoxic layer because of its lower concentrations of alkalinity, phosphorus, ammonia and salinity (Figure 3). Lower concentrations of sulfide and sulfate in the chemocline further distinguish it from the anoxic layer. PERMANOVA analyses of the microbial communities in the three layers also show that the chemocline is distinct from both the anoxic and hypoxic layers (p = 0.006). Examination of a PCoA analysis of microbial communities in each layer demonstrates that the chemocline is clearly separate from the hypoxic and anoxic layers (Figure 4) because it hosts a unique microbial community. The two most abundant chemocline microbes (Sulfurimonas and Halioglobus) in the chemocline were also present in the other layers, while microbes such as Arcobacter and Alkalilimnicola were found in the highest abundance within the chemocline (Table 2). Archaea within this layer were not unique and appeared similar to those in either the hypoxic or anoxic layers (Table 2). Sulfide concentrations measured in the chemocline layer (200 µg/L) were intermediate in value between the sulfide in the hypoxic layer and the anoxic layer (Table 1). The high variation of sulfide within the replicate samples in this layer is likely due to difficulty collecting samples from this relatively thin layer by the divers.
The chemocline in Hospital Hole demonstrates that ecological niches at interfaces host unique microbes and functions that would have been missed from investigating hydrochemistry alone.
4.4. Hospital Hole: The Ecosystem
Water bodies within the Upper Floridan Aquifer are often defined by their hydrochemistry, but their microbial communities are most often inferred from the hydrochemistry and not studied directly. We suggest that direct studies of the microbial communities in the Upper Floridan Aquifer may provide new and different views of aquifer ecosystem function. The water of Hospital Hole exists as three layers, each with its own unique hydrochemistry and biological function. Within this stratified system, there are interactions between the layers and interactions between the layers and the aquifer, although the connectivity of the system to the aquifer is not completely known. There are numerous vents that discharge water into Hospital Hole, especially in the hypoxic layer [6]. The largest vent brings in oxygenated water 18 m below the river surface within the hypoxic zone (Figure 2 and Figure 3). The vents in the hypoxic layer likely originate from the coastal mixing zone of the Upper Floridan Aquifer. Around these vents, divers have identified unique biofilms, which can be white, brown or red. Small vents at the bottom of the anoxic layer have been seen discharging 2–3 cm yellow globules, presumably containing sulfur and sulfur Bacteria. Some distinctive biofilms are not directly associated with vents. For example, the walls of the sinkhole in the deepest part of the anoxic layer hosts grey finger-like Bacterial mats similar to those observed in Jewfish Sink [19]. Other parts of the anoxic layer contain long thin filamentous mats with a white coating.
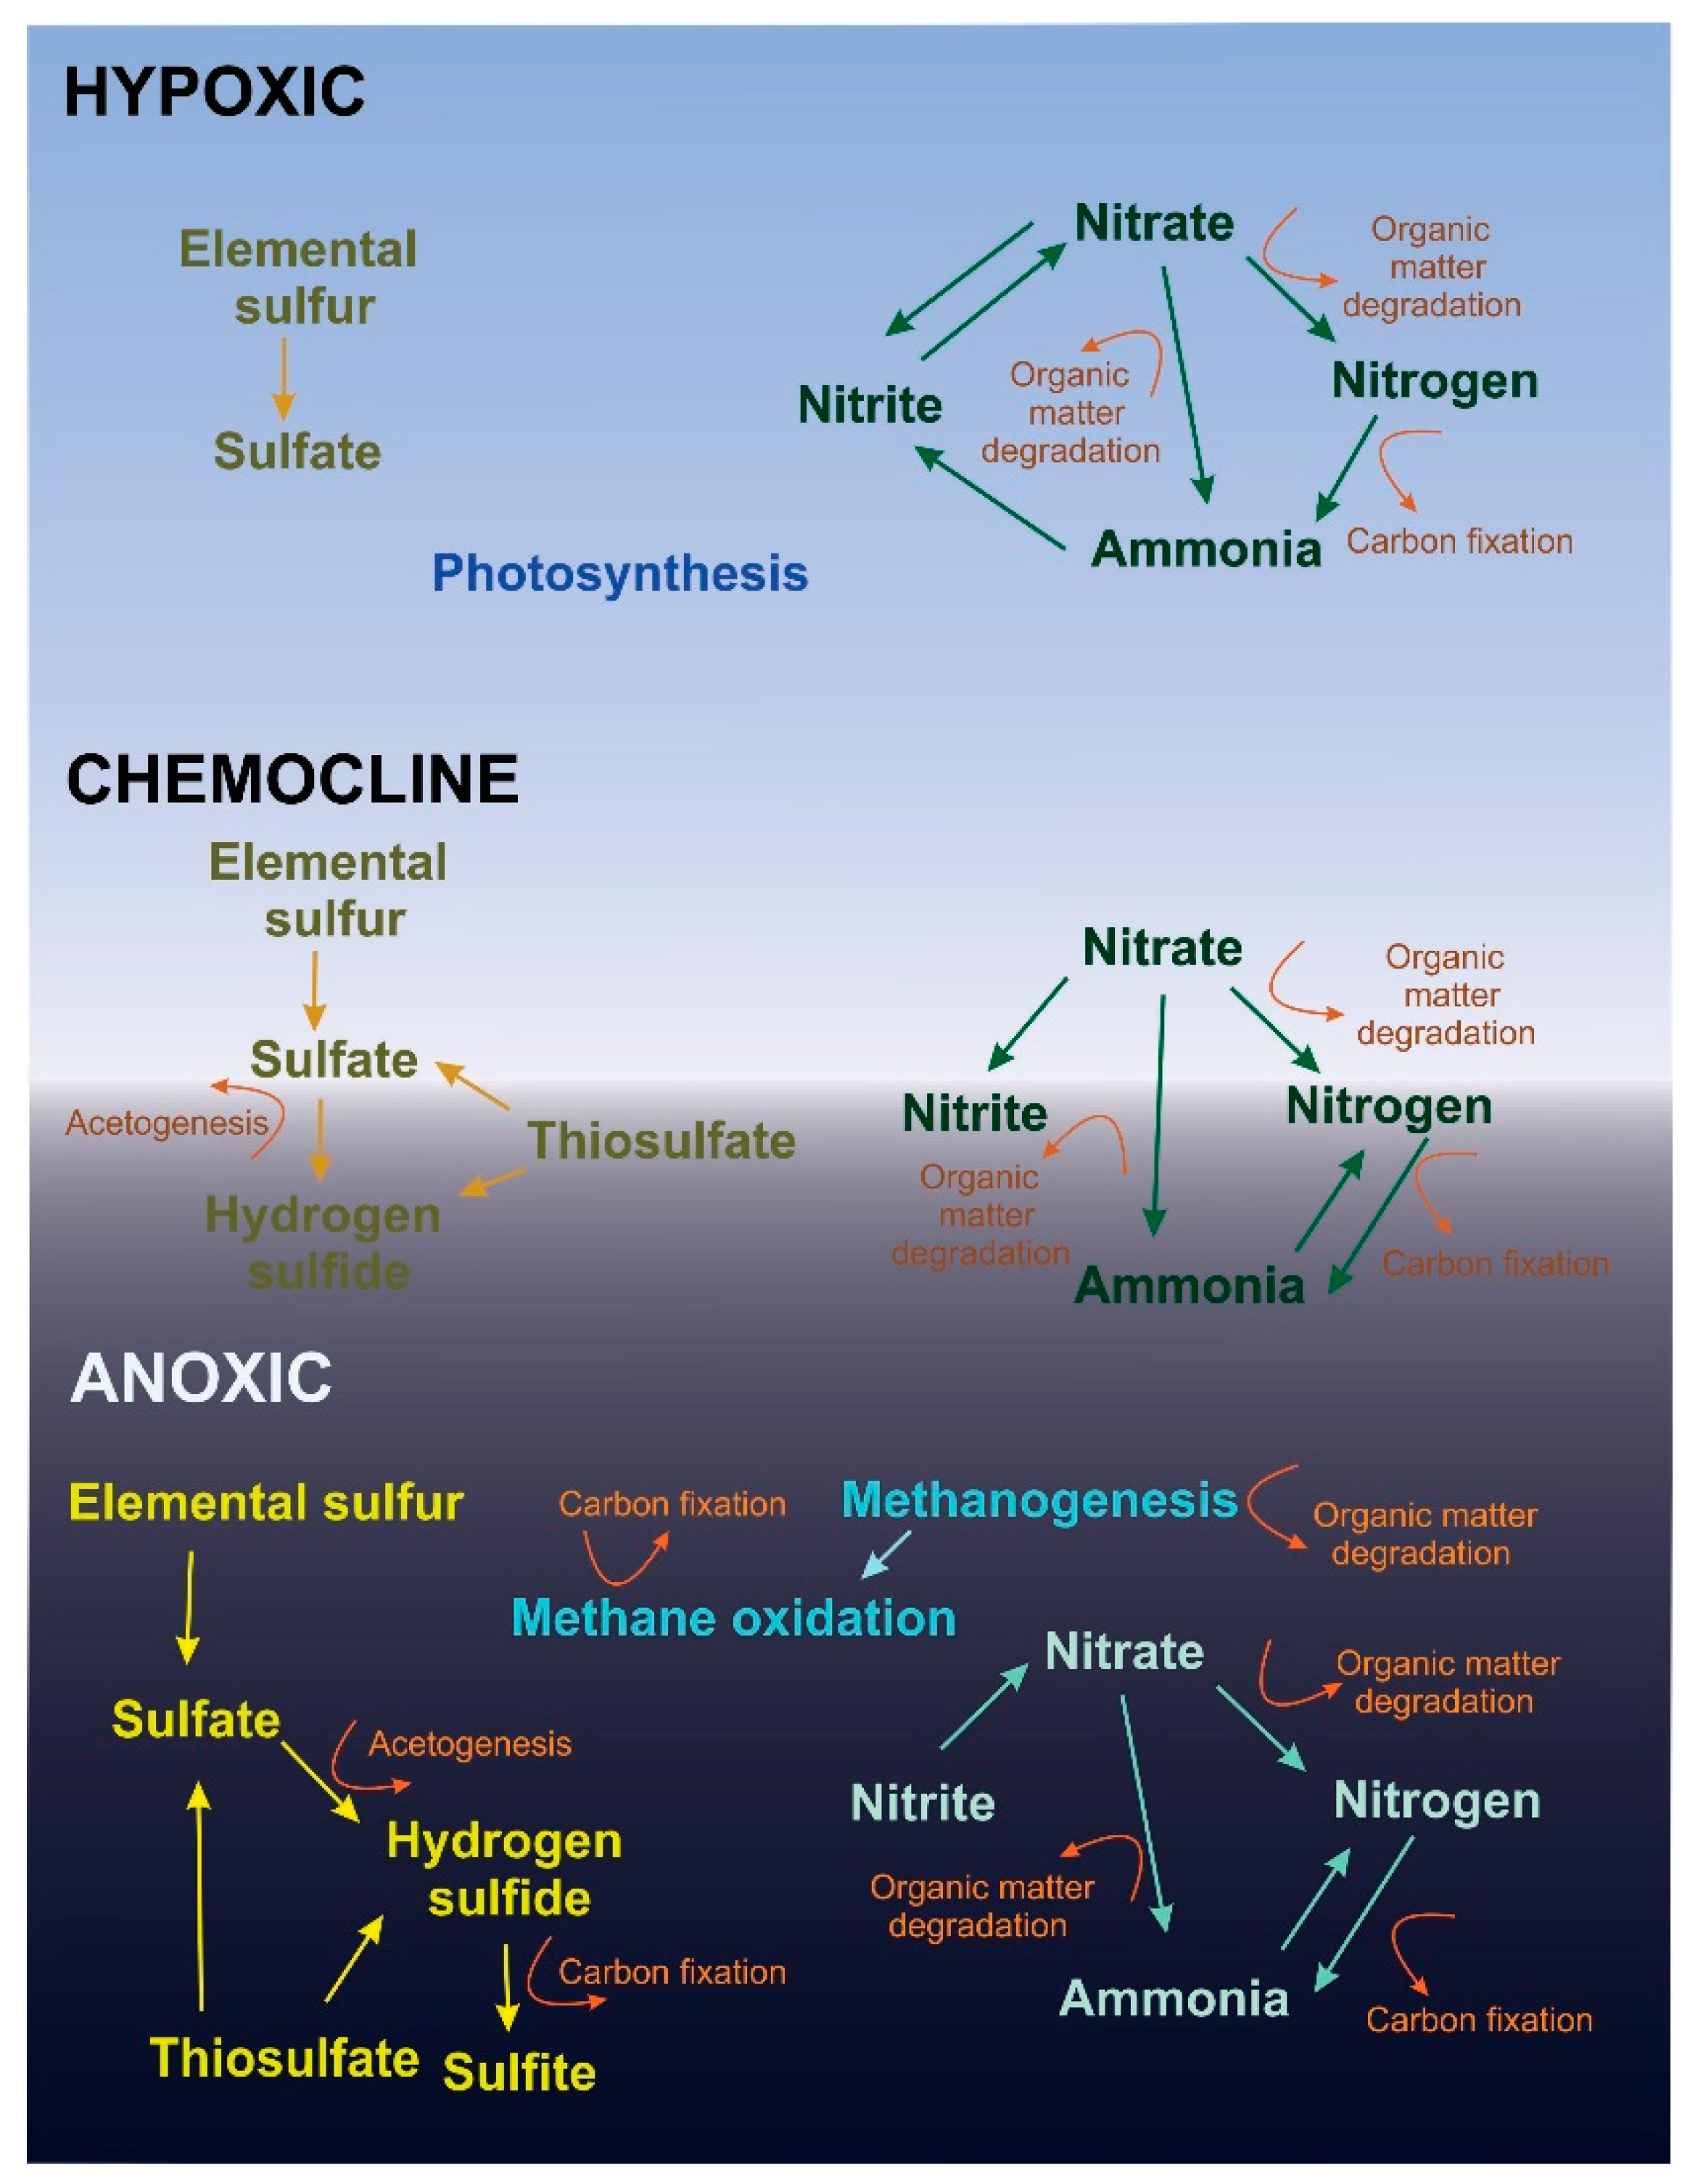
Nitrogen reduction is utilized by the majority of the analyzed microbes in this study (Table 3), but the specific pathways differ in each layer (Figure 6). Denitrification and nitrogen fixation were the most abundant types of nitrogen reduction, as suggested by the presence of ammonia in all layers (Table 1, Figure 6). Denitrification occurred in all three layers as evidenced by the abundance of Sulfurimonas and Halioglobus (Table 2, Figure 6). The high abundance of the Bacteria Arcobacter and the Archaea Methanococcus in the chemocline suggests that nitrogen fixation is a predominant function in that layer (Table 2, Figure 6). While Arcobacter is found in the hypoxic and anoxic layers, it is 10-fold less abundant than in the chemocline layer (Table 1 and Table 2). Dissimilatory nitrate reduction to ammonia likely occurs mostly at the chemocline, due to the presence of Alkalilimnicola (Table 2, Figure 6). This microbe may explain why nitrite was nearly 20-times higher in the chemocline than other layers (Table 1). Both nitrogen fixation and dissimilatory nitrate reduction produce ammonia, but ammonia concentrations were lower in the chemocline than other layers (Table 1), suggesting a rapid cycling of ammonia. The OTUs representing Bacteria that can reduce nitrate to nitrite were identified in both the hypoxic and chemocline layers, but not the anoxic layer (Figure 6). Prochlorococcus, Citreimonas and Alkalilimnicola were responsible for this reduction and were within both layers (Table 2) suggests that this pathway is important for metabolism in the hypoxic and chemocline layers. Archaeal sequences associated with nitrate reduction in the chemocline and anoxic layer are likely a minor component of the total Archaeal community (Table 3).
The potential nitrogen oxidation pathways determined by sequence analyses differed between the hypoxic layer and the anoxic/chemocline layers. Within the hypoxic layer, nitrification was the only oxidation pathway identified, and 90.8% of the Archaeal sequence abundance was capable of nitrification, primarily by Nitrosopumilus (Table 3, Figure 6). The Bacteria Nitrospira, Nitrospina and Acinetobacter and the Archaea Nitrosopumilus appeared to be responsible for nitrification in the chemocline layer (Table 2). In combination with the nitrogen reducers, these Bacteria help complete the cycle of nitrogen metabolism within the hypoxic layer (Figure 6). The chemocline and anoxic layer did not have Bacteria that utilize this type of oxidation (Figure 6). Instead, Bacteria in these layers utilized the anammox pathway, which is accomplished by Anammoximicrobium (Figure 6). The higher abundance of Anammoximicrobium compared to Nitrospina in this layer could be due to competition between these microbes for nitrite and ammonia [20]. It is likely that Nitrospina is dominant in the hypoxic layer due to the availability of oxygen [20]. Although Bacteria capable of nitrogen oxidation were identified within Hospital Hole, they were not very abundant (Table 3).
Nitrate values in Hospital Hole range from 0.44–5.1 mg/L while nitrate can range from 0–3.16 mg/L in the Upper Floridan Aquifer [2]. We cannot completely explain why the anoxic layer has high levels of nitrate in the presence of sulfide (Table 1). We found evidence of nitrogen reducers in all layers, but they had a lower relative abundance within the anoxic layer, which could account for part of the higher nitrate. Other than hydrochemistry, the main difference between the anoxic layer and the hypoxic layer was that organic debris (e.g., tree branches, leaves) collected at the bottom of the sinkhole, suggesting that organic carbon is more readily available in the bottom anoxic layer. This is consistent with the extremely high levels of sulfide present in the anoxic layer. It is possible that the persistence of nitrate in the anoxic layer was related to the high sulfate concentration.
Nitrate reduction occurs throughout the Upper Floridan Aquifer, affecting both the carbonate chemistry of the groundwater and the carbon isotope composition [2]. Dissimilative nitrate reduction and denitrification are important processes that aid in the removal of nitrate in the Upper Floridan Aquifer [2]. Nitrogen cycling within Hospital Hole may be similar to that of the coastal mixing zone of the Upper Floridan Aquifer and provide insight into subsurface bioremediation of nonpoint nitrate pollution in coastal aquifer regions.
Sulfur oxidation and nitrogen reduction are often coupled [3], as evidenced by our sequencing analysis (Supplemental Table S1). Bacterial sulfur oxidizers represent 8.8% of the sequence abundance in the hypoxic layer and roughly 50% sequence abundance in both the chemocline and the anoxic layer (Table 3). This abrupt difference is likely due to the presence of hydrogen sulfide [3], which links sulfur oxidation to dissimilatory nitrate reduction to ammonia. It has been suggested that sulfidic environments with high carbon allow for sulfur oxidizers to dominate [3]. These sulfur oxidizers likely reduce nitrate to ammonia or carry out denitrification [3]. The presence of hydrogen sulfide inhibits denitrification and promotes the reduction of nitrate to ammonia [3]. Despite the high concentrations of hydrogen sulfide in the anoxic layer, denitrification may be present (Figure 6) as Sulfurimonas is capable of denitrification and was the most abundant microbe in the anoxic layer (Table 2).
Bacterial sulfur reduction is an important process within the anoxic layer (Figure 6). Sulfur disproportionation and sulfate reduction are associated with several Bacteria identified in the anoxic layer. For example, Desulfocapsa can carry out sulfate disproportionation, and other Bacteria found in the anoxic layer such as Desulfosarcina and Desulfotalea (Table 2) can reduce sulfur. Despite the low abundance of Bacterial sulfur reducers (Table 2), sulfide concentration was high within the anoxic layer (Table 1). According to the BEST analysis, sulfide accounts for the majority of the variance in all layers (r = 0.787). The presence of sulfur reducers likely accounts for the 30 mg/L of sulfide detected within this layer (Table 1). It has been reported in a similar system that Archaea contribute more to sulfur reduction than Bacteria [10], but this is not corroborated by the Archaeal functional analysis (Table 3), suggesting that a significant population of Archaeal sulfur reducers was present, but not detected by our sequence analysis.
One of the main processes within the aquifer is sulfur reduction [2], very much like in the Hospital Hole hypoxic layer. The low sulfide concentrations within the hypoxic layer (Table 1) were likely due to the relatively low abundance of Bacterial sulfur reducers (Table 3) and the occasional presence of dissolved oxygen. Typical sulfide levels within the Upper Floridan Aquifer are similar to those of the hypoxic layer of Hospital Hole, indicating that this layer is a component of the Upper Floridan Aquifer (Figure 6). While sulfide concentrations were higher in the anoxic layer than normally found within the Upper Floridan Aquifer, the lack of available organic matter for sulfate reduction in the Upper Floridan Aquifer limits sulfate reduction [2]. Thus, the anoxic layer of sinkholes like Hospital Hole could serve as a model for the response of the aquifer to eutrophication.
The methanogens (Table 3) appear to have syntrophic relationships with the methane oxidizers and the sulfate-reducing Bacteria [21] in the anoxic layer. Sulfate-reducing Bacteria and methanogens can occur within similar anaerobic environments [22] and can develop syntrophic relationships [9,23,24]. Methanogens are known to be present in the Upper Floridan Aquifer [2], so the inferred interactions between methanogens, methanotrophs and sulfate-reducing Bacteria in Hospital Hole are similar to microbial interactions that occur within the Upper Floridan Aquifer [24].
Despite the potential of organic matter degradation as seen in Figure 6, bulky organic matter (branches, leaves and twigs) was present at the bottom of the anoxic layer. We suspect that bulky organic materials are present in Hospital Hole because the microbial community cannot degrade these materials faster than their input into the system. Most anaerobes are limited to the utilization of small organic substrates [4]. Dissimilatory nitrate reduction allows Bacteria to degrade complex organic matter to carbon dioxide [25], but not necessarily plant material. Carbon fixation from methane oxidation (Figure 6) could allow these microorganisms to grow independently of the organic carbon input to the system [26]. Another possibility is that the microbes that are able to degrade cellulose and other organic matter [27] are not abundant within this system.
The microbial metabolism in Hospital Hole may elucidate mechanisms for remediating nitrate eutrophication within the coastal mixing zone of the Upper Floridan Aquifer. Nitrate concentrations in all layers were higher than the Florida Department of Environmental Protection (FDEP) recommended concentrations [28]. Dissimilatory reductions of nitrate, denitrification and anammox reactions are microbially-mediated processes that transform nitrate within the groundwater systems [3]. These processes have been identified in Hospital Hole and could be used to demonstrate how subsurface ecosystems respond to elevated nitrate caused by agricultural and wastewater infiltration into the aquifer.
Microbes provisionally identified as fecal/pathogenic Bacteria accounted for ~20% of the sequence abundance in all three layers of Hospital Hole (Table 3). Escherichia includes human and cattle fecal Bacteria, which can be pathogenic in humans (Supplemental Table S1). Escherichia could occur naturally or could originate from nearby septic tanks or faulty sewer systems and enter Hospital Hole through the subsurface. Other potentially pathogenic Bacteria, such as Arcobacter, Clostridium and Vibrio, are opportunistic pathogens that are found within aquatic systems naturally (Supplemental Table S1). Arcobacter is suspected to have natural reservoirs within similar aquatic systems (Supplemental Table S1). Potential animal pathogens such as Erysipelothrix (Supplemental Table S1) identified in Hospital Hole could originate from nearby farmlands. Studying the microbial communities in Hospital Hole or other sinkholes may aid in the identification of microbial contaminants [29,30] that might be present in the coastal mixing zone of the Upper Floridan Aquifer.
The microbial communities within Hospital Hole are similar to other karst systems. Two genera, Vulcanibacillus and Thiobacillus, within Hospital Hole (Supplemental Table S1) were found in the Edwards Aquifer [7]. Sulfur reducers in the anoxic layer of Hospital Hole (Table 2), in Jewfish Sink [10] and the saltwater portion of Edwards Aquifer [7] were all within the order Desulfobacterales. Jewfish Sink and Hospital Hole had similar microbes. Arcobacter, Sulfurimonas, Desulfosarcina, Desulfofaba, Clostridium, Spirochaeata, Dehalococcoides, Cytophaga, Pelobacter and Desulfobacterium were present within both Hospital Hole (Table 2) and Jewfish Sink [10], which are 14 km apart. Sphingomonas was present in the Wakulla spring system in North Florida [8] and in Hospital Hole (Supplemental Table S1). Freshwater spring systems such as Wakulla springs likely do not share the same microbial communities with the coastal mixing zone, which may account for the lack of similarities between Hospital Hole. Nitrospira found in Hospital Hole is present in other karst systems including springs in Switzerland and Austria and the Frasassi cave system in Italy [31,32,33]. The microbial communities within Hospital Hole appear most similar to those of Jewfish Sink, suggesting a subsurface connectivity via the coastal mixing zone.
The chemocline thickness is an indicator of the amount of vertical mixing that occurs within Hospital Hole. This layer can be several centimeters to several meters thick as reported in the literature [6] and observed by our divers. While tidal mixing may influence the chemocline, especially its depth and thickness, anthropogenic activity (it is a popular SCUBA diving site) is the likely the main culprit of mixing within Hospital Hole. The chemocline is likely the main interface between the hypoxic and anoxic layers, and its disruption could interfere with key microbial functions that are unique to this layer (Figure 6).
The bio-hydrochemistry of Hospital Hole reflects those of the coastal mixing zone of the Upper Floridan Aquifer. Aerobic respiration, nitrate reduction, sulfate reduction and methane production are typical processes found within deep aquifers, including the Upper Floridan Aquifer [2,3]. The saltwater present is likely from the coastal mixing zone, and salinity increased with depth [34]. Sulfate present in Hospital Hole likely originates from freshwater from the Upper Floridan Aquifer that has dissolved gypsum [34] or from seawater. Sulfide measurements in all layers (Table 2) were similar to other sinkholes and to the Upper Floridan Aquifer [4,16,18]. Using sinkholes as a surrogate of the coastal aquifer mixing zone does not specifically address microbe-rock matrix interactions, but it is still able to elucidate how salinization of coastal aquifers affects some of the indigenous microbial communities.
5. Conclusions
The coastal karst system represented by Hospital Hole provides a unique window into the hydrochemical and biological processes that occur in the coastal regions of karst aquifers, including the Upper Floridan Aquifer. Each layer of Hospital Hole has unique hydrochemistry and microbial communities. The hydrochemistry of each layer affects the metabolic pathways that the microbial communities utilize. Sulfur oxidation and nitrogen reduction are the predominant metabolic functions and are often coupled. The hydrogen sulfide in the anoxic layer of Hospital Hole appears to be from both sulfur-reducing Bacteria and Archaea. Syntrophy of methane-oxidizers, methanogens and sulfate-reducing Bacteria appears to be present within Hospital Hole and Jewfish Sink. Similarities between microbial communities in Hospital Hole and Jewfish sink suggest subsurface connectivity between these sinkholes through the Floridan Aquifer coastal mixing zone. Studying the microbial communities in Hospital Hole and other sinkholes can expand our understanding of microbial processes, aid in the identification of microbial contaminants and predict microbial responses of karst aquifers to eutrophication in the coastal mixing zone.
Supplementary Materials
The following are available online at https://www.mdpi.com/2073-4441/10/8/972/s1, Figure S1: Aerial map of Hospital Hole, Table S1: Bacterial bioinformatics, Table S2: Archaeal bioinformatics. This Targeted Locus Study project has been deposited at DDBJ/EMBL/GenBank under the accession KCDC00000000. The version described in this paper is the first version, KCDC01000000.
Author Contributions
M.C.D. and J.R.G. conceived of and designed the experiments. M.C.D. performed the experiments. M.C.D. and J.R.G. analyzed the data. J.R.G. contributed reagents/materials/analysis tools. M.C.D. and J.R.G. wrote the paper.
Funding
This research received no external funding.
Acknowledgments
We thank Christina Moss for assistance with field work and molecular analyses; Haydn Rubelmann for his input on the functional analysis; Bobby Scharping for advice and help with the hydrochemical analysis, Areeba Keshwani and Misha Fini for their assistance in the hydrochemical analysis; and Sonya and Randall Sanders, Don and Katy Vanderhoef, Duane Davis, Ali Molina and Luna Davis for their support. This work was supported by the University of South Florida.
Conflicts of Interest
The authors declare no conflict of interest.
References
- Ford, D.; Williams, P. Speleogenesis: The Development of Cave Systems. In Karst Hydrogeology and Geomorphology; John Wiley & Sons Ltd.: Hoboken, NJ, USA, 2007; pp. 209–270. ISBN 978-0-470-84996-5. [Google Scholar]
- Sprinkle, C.L. Hydrochemistry of the Floridan Aquifer System in Florida and in Parts of Georgia, South Carolina, and Alabama; Report No.: 1403I; United States Government Printing Office: Washington, DC, USA, 1989.
- Burgin, A.J.; Hamilton, S.K. Have we overemphasized the role of denitrification in aquatic ecosystems? A review of nitrate removal pathways. Front. Ecol. Environ. 2007, 5, 89–96. [Google Scholar] [CrossRef] [Green Version]
- Amon, R.M.; Benner, R. Bacterial utilization of different size classes of dissolved organic matter. Limnol. Oceanogr. 1996, 41, 41–51. [Google Scholar] [CrossRef] [Green Version]
- Lovley, D.R.; Chapelle, F.H. Deep subsurface microbial processes. Rev. Geophys. 1995, 33, 365–381. [Google Scholar] [CrossRef]
- Sinclair, W.C. Preliminary Evaluation of the Water-Supply Potential of the Spring-River System in the Weeki Wachee Area and the Lower Withlacoochee River, West-Central Florida; U.S. Geological Survey, Water Resources Division: Reston, WV, USA, 1978.
- Gray, C.J.; Engel, A.S. Microbial diversity and impact on carbonate hydrochemistry across a changing hydrochemical gradient in a karst aquifer. ISME J. Multidiscip. J. Microb. Ecol. 2013, 7, 325–337. [Google Scholar]
- Moss, J.A.; Nocker, A.; Snyder, R.A. Microbial Characteristics of a Submerged Karst Cave System in Northern Florida. Geomicrobiol. J. 2011, 28, 719–731. [Google Scholar] [CrossRef]
- Coke, J.G.; Stoessell, R.K. An explanation for the lack of a dilute freshwater lens in unconfined tropical coastal aquifers: Yucatan example. Gulf Coast Assoc. Geol. Soc. Trans. 2006, 56, 785–792. [Google Scholar]
- Garman, M.K.; Rubelmann, H.; Karlen, D.; Wu, T.; Garey, J.R. Comparison of an inactive submarine spring with an active nearshore anchialine spring in Florida. Hydrobiologia 2011, 677, 65–87. [Google Scholar] [CrossRef]
- Takahashi, S.; Tomita, J.; Nishioka, K.; Hisada, T.; Nishijima, M. Development of a Prokaryotic Universal Primer for Simultaneous Analysis of Bacteria and Archaea Using Next-Generation Sequencing. PLoS ONE 2014, 9, e105592. [Google Scholar] [CrossRef] [PubMed]
- Schloss, P.D.; Westcott, S.L.; Ryabin, T.; Hall, J.R.; Hartmann, M.; Hollister, E.B.; Lesniewski, R.A.; Oakley, B.B.; Parks, D.H.; Robinson, C.J.; et al. Introducing mothur: Open-source, platform-independent, community-supported software for describing and comparing microbial communities. Appl. Environ. Microbiol. 2009, 7537–7541. [Google Scholar] [CrossRef] [PubMed]
- Menning, D.M.; Carraher-Stross, W.A.; Graham, E.D.; Thomas, D.N.; Phillips, A.R.; Scharping, R.J.; Garey, J.R. Aquifer Discharge Drives Microbial Community Change in Karst Estuaries. Estuaries Coasts 2017. [Google Scholar] [CrossRef]
- Hammer, Ø.; Harper, D.A.T.; Ryan, P.D. PAST: Paleontological statistics software package for education and data analysis. Palaeontol. Electron. 2001, 4, 1–9. [Google Scholar]
- Cowell, B.C.; Botts, P.S. Factors influencing the distribution, abundance and growth of Lyngbya wollei in central Florida. Aquat. Bot. 1994, 49, 1–17. [Google Scholar] [CrossRef]
- Garman, M.K. The Biohydrochemistry of Submerged Coastal Karst Features in West Central Florida. Ph.D. Thesis, University of South Florida, Tampa, FL, USA, 2010. [Google Scholar]
- Bottrell, S.H.; Smart, P.L.; Whitaker, F.; Raiswell, R. Hydrochemistry and isotope systematics of sulphur in the mixing zone of Bahamian blue holes. Appl. Hydrochem. 1991, 6, 97–103. [Google Scholar]
- Gonzalez, B.; Iliffe, T.; Macalady, J.; Schaperdoth, I.; Kakuk, B. Microbial hotspots in anchialine blue holes: Initial discoveries from the Bahamas. Hydrobiologia 2011, 677, 149–156. [Google Scholar] [CrossRef]
- Garman, M.K.; Garey, J.R. The transition of a freshwater karst aquifer to an anoxic marine system. Estuaries 2005, 28, 686–693. [Google Scholar] [CrossRef]
- Kuenen, J.G. Anammox Bacteria: From discovery to application. Nat. Rev. Microbiol. 2007, 6, 320–321. [Google Scholar] [CrossRef] [PubMed]
- Oremland, R.S.; Polcin, S. Methanogenesis and Sulfate Reduction: Competitive and Noncompetitive Substrates in Estuarine Sediments. App. Environ. Microbiol. 1982, 44, 1270–1276. [Google Scholar]
- Fry, N.K.; Fredrickson, J.K.; Fishbain, S.; Wagner, M.; Stahl, D.A. Population structure of microbial communities associated with two deep, anaerobic, alkaline aquifers. Appl. Environ. Microbiol. 1997, 63, 1498–1504. [Google Scholar] [PubMed]
- Boetius, A.; Ravenschlag, K.; Schubert, C.J.; Rickert, D.; Widdel, F.; Gieseke, A.; Amann, A.; Jørgensen, B.B.; Witte, U.; Pfannkuche, O. A marine microbial consortium apparently mediating anaerobic oxidation of methane. Nature 2000, 407, 623–626. [Google Scholar] [CrossRef] [PubMed]
- Thamdrup, B.; Dalsgaard, T. Production of N2 through Anaerobic Ammonium Oxidation Coupled to Nitrate Reduction in Marine Sediments. Appl. Environ. Microbiol. 2002, 68, 1312–1318. [Google Scholar] [CrossRef] [PubMed] [Green Version]
- Kellermann, M.Y.; Wegener, G.; Elvert, M.; Yoshinaga, M.Y.; Lin, Y.S.; Holler, T.; Mollar, X.P.; Knittel, K.; Hinrichs, K.U. Autotrophy as a predominant mode of carbon fixation in anaerobic methane-oxidizing microbial communities. Proc. Natl. Acad. Sci. USA 2012, 109, 19321–19326. [Google Scholar] [CrossRef] [PubMed] [Green Version]
- Leschine, S.B. Cellulose degradation in anaerobic environments. Ann. Rev. Microbiol. 1995, 49, 399–426. [Google Scholar] [CrossRef] [PubMed]
- Harrington, D.; Maddox, G.; Hicks, R. Florida Springs Initiative Monitoring Network Report and Recognized Sources of Nitrate; Florida Department of Environmental Protection: Tallahassee, FL, USA, 2010.
- Boyer, D.G.; Pasquarell, G.C. Agricultural Land Use Impacts on Bacterial Water Quality in a Karst Groundwater Aqifer. JAWRA J. Am. Water Resour. Assoc. 1999, 35, 291–300. [Google Scholar] [CrossRef]
- Griebler, C.; Lueders, T. Microbial biodiversity in groundwater ecosystems. Freshw. Biol. 2009, 54, 649–677. [Google Scholar] [CrossRef] [Green Version]
- Blaschke, A.P.; Derx, J.; Zessner, M.; Kirnbauer, R.; Kavka, G.; Strelec, H.; Farnleitner, A.H.; Pang, L. Setback distances between small biological wastewater treatment systems and drinking water wells against virus contamination in alluvial aquifers. Sci. Total Environ. 2016, 573, 278–289. [Google Scholar] [CrossRef] [PubMed]
- Farnleitner, A.H.; Wilhartitz, I.; Ryzinska, G.; Kirschner, A.K.T.; Stadler, H.; Burtscher, M.M.; Hornek, R.; Szewzyk, U.; Herndl, G.; Mach, R.L. Bacterial dynamics in spring water of alpine karst aquifers indicates the presence of stable autochthonous microbial endokarst communities. Environ. Microbiol. 2005, 7, 1248–1259. [Google Scholar] [CrossRef] [PubMed]
- Macalady, J.L.; Lyon, E.H.; Koffman, B.; Albertson, L.K.; Meyer, K.; Galdenzi, S.; Mariani, S. Dominant Microbial Populations in Limestone-Corroding Stream Biofilms, Frasassi Cave System, Italy. Appl. Environ. Microbiol. 2006, 72, 5596–5609. [Google Scholar] [CrossRef] [PubMed] [Green Version]
- Pronk, M.; Goldscheider, N.; Zopfi, J. Microbial communities in karst groundwater and their potential use for biomonitoring. Hydrogeol. J. 2009, 17, 37–48. [Google Scholar] [CrossRef]
- Sacks, L.A.; Tihansky, A.B. Geochemical and Isotopic Composition of Ground Water with Emphasis on Sources of Sulfate in the Upper Floridan Aquifer and Intermediate Aquifer System in Southwest Florida; U.S. Geological Survey Water Resource Investigations Report 96-4146; US Department of the Interior: Washington, DC USA, 1996.
Figure 1.
Diagram of the freshwater-saltwater interface near the study region. The blue line indicates the depth of Hospital Hole in relation to the freshwater/saltwater coastal mixing zone. Image recreated from [6].
Figure 1.
Diagram of the freshwater-saltwater interface near the study region. The blue line indicates the depth of Hospital Hole in relation to the freshwater/saltwater coastal mixing zone. Image recreated from [6].

Figure 2.
Profile view of the Hospital Hole site. Layers and boundaries within Hospital Hole are designated in this profile diagram. The direction of the river flow is southwest. Photographs taken by divers of the corresponding three layers within this study are shown.
Figure 2.
Profile view of the Hospital Hole site. Layers and boundaries within Hospital Hole are designated in this profile diagram. The direction of the river flow is southwest. Photographs taken by divers of the corresponding three layers within this study are shown.

Figure 3.
Principal coordinate analysis (PCoA) of the Hydrochemistry. This PCoA plot includes hydrochemistry data from Table 1. Three replicates from each layer are shown. The horizontal axis, principal coordinate 1 (PCO1), is related to pH, temperature, ammonia, salinity, nitrate and sulfide. The vertical axis, principal coordinate 2 (PCO2), is related to alkalinity, phosphorus and sulfate.

Figure 4.
Principal coordinate analysis of the sequences. This PCoA shows the Illumina sequencing data with three replicates from each layer for (A) Bacteria and (B) Archaea. The hydrochemical data from Table 1 were used to produce the trend lines within the circles in the figure. These trends explain the biological variation as defined by PCO1 and PCO2.

Figure 5.
Rarefaction curves of the (A) Bacterial sequence abundance and (B) Archaeal sequence abundance for each layer are shown.
Figure 5.
Rarefaction curves of the (A) Bacterial sequence abundance and (B) Archaeal sequence abundance for each layer are shown.

Figure 6.
Microbial metabolism within layers of Hospital Hole. The metabolic pathways determined from the functional analysis are shown for each layer. Pathways associated with OTUs that were less than 1.0% of the sequence abundance were omitted.
Figure 6.
Microbial metabolism within layers of Hospital Hole. The metabolic pathways determined from the functional analysis are shown for each layer. Pathways associated with OTUs that were less than 1.0% of the sequence abundance were omitted.


Table 1.
Hydrochemistry of Hospital Hole.
| Alkalinity (mg/L) | Ammonia (mg/L) | Nitrate (mg/L) | Nitrite (mg/L) | Sulfate (mg/L) | Sulfide (µg/L) | |||||||
|---|---|---|---|---|---|---|---|---|---|---|---|---|
| Surface | 145 | ±30 | 0.601 | ±0.008 | 0.440 | ±0.11 | 0.005 | ±0.001 | 0 | ±0 | 7 | ±1 |
| Hypoxic | 192 | ±38 | 0.434 | ±0.079 | 0.640 | ±0.15 | 0.000 | ±0.001 | 800 | ±158 | 1 | ±1 |
| Chemocline | 153 | ±28 | 0.356 | ±0.038 | 0.800 | ±0 | 0.197 | ±0.048 | 1000 | ±58 | 200 | ±6 |
| Anoxic | 206 | ±23 | 0.659 | ±032 | 5.080 | ±0.15 | 0.000 | ±0.001 | 1000 | ±55 | 30,000 | ±7972 |
| pH | Salinity (ppt) | Temperature (°C) | Dissolved oxygen (mg/L) | Phosphorus (mg/L) | ||||||||
| Surface | 7.91 | ±0.02 | 0.44 | ±0.05 | 23.93 | ±0.00 | 6.25 | ±0.02 | 0.50 | ±0.16 | ||
| Hypoxic | 7.47 | ±0.16 | 10.09 | ±3.89 | 24.15 | ±0.10 | 0.24 | ±0.53 | 0.16 | ±0.0 | ||
| Chemocline | 7.42 | *** | 11.75 | *** | 24.18 | *** | 0.01 | *** | 0.15 | ±0.20 | ||
| Anoxic | 7.27 | ±0.55 | 14.90 | ±0.7 | 20.5 | ±1.04 | 0 | ±0.00 | 0.28 | ±0.00 | ||
Asterisks (***) indicate that only one measurement was made in the chemocline layer during the 30-s sampling interval of Hydrolab, so standard deviations could not be calculated for pH, salinity, temperature and dissolved oxygen.
Table 2.
Abundant taxa present within Hospital Hole. The 25 most abundant provisionally-identified Bacterial operational taxonomic units (OTUs) and all of the Archaeal OTUs for each layer are shown. Taxa found predominantly in one layer are shown in bold.
Table 2.
Abundant taxa present within Hospital Hole. The 25 most abundant provisionally-identified Bacterial operational taxonomic units (OTUs) and all of the Archaeal OTUs for each layer are shown. Taxa found predominantly in one layer are shown in bold.
| Bacteria | |||||
| Name | Hypoxic | Name | Chemocline | Name | Anoxic |
| Halioglobus | 15,033 | Sulfurimonas | 10,604 | Sulfurimonas | 12,659 |
| Escherichia | 2994 | Halioglobus | 10,264 | Escherichia | 2433 |
| Arcobacter | 782 | Arcobacter | 5757 | Unknown | 1434 |
| Sulfurimonas | 703 | Alkalilimnicola | 1023 | Desulfocapsa | 1144 |
| Prochlorococcus | 182 | Emcibacter | 366 | Christensenella | 745 |
| Oceanicola | 148 | Unknown | 344 | Lentimicrobium | 624 |
| Emcibacter | 136 | Desulfocapsa | 275 | Arcobacter | 565 |
| Alkalilimnicola | 129 | Escherichia | 204 | Erysipelothrix | 469 |
| Rhodobacter | 109 | Lentimicrobium | 133 | Desulfosarcina | 354 |
| Citreicella | 87 | Sulfurovum | 129 | Mariniphaga | 304 |
| Thalassobius | 84 | Christensenella | 76 | Candidatus Aquiluna | 276 |
| Unknown | 56 | Desulfosarcina | 71 | Anammoximicrobium | 245 |
| Clostridium | 46 | Thalassobius | 65 | Ornatilinea | 168 |
| Citreimonas | 41 | Prochlorococcus | 51 | Claocimonetes | 158 |
| Methylotenera | 32 | Erysipelothrix | 48 | Sulfurovum | 156 |
| Desulfocapsa | 30 | Mariniphaga | 48 | Desulfotalea | 155 |
| Hypnocyclicus | 28 | Candidatus Aquiluna | 42 | Thermomarinilinea | 140 |
| Pelobacter | 26 | Dissulfuribacter | 40 | Sphingobacteriia | 139 |
| Lentimicrobium | 25 | Citreicella | 40 | Nibribacter | 129 |
| Streptococcus | 22 | Draconibacterium | 34 | Dissulfuribacter | 126 |
| Dechloromonas | 22 | Anammoximicrobium | 33 | Cryobacterium | 117 |
| Nitrospina | 18 | Cytophaga | 29 | Pelolinea | 112 |
| Psychrobacter | 17 | Lutibacter | 28 | Draconibacterium | 104 |
| Thiobacillus | 13 | Citreimonas | 28 | Cytophaga | 100 |
| TOTAL | 20,764 | TOTAL | 29,731 | TOTAL | 22,855 |
| Archaea | |||||
| Name | Hypoxic | Name | Chemocline | Name | Anoxic |
| Halarchaeum | 0 | Halarchaeum | 9 | Halarchaeum | 54 |
| Haloparvum | 2 | Haloparvum | 0 | Haloparvum | 0 |
| Halorubrum | 1 | Halorubrum | 3 | Halorubrum | 16 |
| Methanobacterium | 5 | Methanobacterium | 5 | Methanobacterium | 66 |
| Methanobrevibacter | 3 | Methanobrevibacter | 4 | Methanobrevibacter | 69 |
| Methanocalculus | 1 | Methanocalculus | 12 | Methanocalculus | 115 |
| Methanocaldococcus | 1 | Methanocaldococcus | 5 | Methanocaldococcus | 55 |
| Methanococcus | 6 | Methanococcus | 72 | Methanococcus | 599 |
| Methanoculleus | 0 | Methanoculleus | 4 | Methanoculleus | 20 |
| Methanomicrobium | 0 | Methanomicrobium | 2 | Methanomicrobium | 31 |
| Methanoplanus | 2 | Methanoplanus | 0 | Methanoplanus | 0 |
| Methanosaeta | 0 | Methanosaeta | 2 | Methanosaeta | 36 |
| Methanosaeta | 6 | Methanosaeta | 3 | Methanosaeta | 1 |
| Methanosphaera | 1 | Methanosphaera | 1 | Methanosphaera | 1 |
| Methanospirillum | 4 | Methanospirillum | 2 | Methanospirillum | 0 |
| Methanothermococcus | 3 | Methanothermococcus | 5 | Methanothermococcus | 13 |
| Nitrosopulmilus | 365 | Nitrosopulmilus | 164 | Nitrosopulmilus | 6 |
Table 3.
Sequence abundance of function by layer. Sequence abundance was determined for each layer, and the percentage of abundance of function for each layer is shown for Bacteria and Archaea.
Table 3.
Sequence abundance of function by layer. Sequence abundance was determined for each layer, and the percentage of abundance of function for each layer is shown for Bacteria and Archaea.
| Bacteria | Total per Layer | Fecal/ WTP/ pathogen | Anaerobes | Aerobes | Facultative Aerobe/ Anaerobe | Halotolerant | Photosynthetic | Methane Oxidizers | ||
| Hypoxic | 20,947 | Total | 3956 | 931 | 651 | 19,037 | 16,715 | 299 | 39 | |
| Percent | 18.9% | 4.4% | 3.1% | 90.9% | 79.8% | 1.4% | 0.2% | |||
| Chemocline | 30,301 | Total | 6667 | 6576 | 725 | 22,396 | 23,111 | 71 | 277 | |
| Percent | 22.0% | 21.7% | 2.4% | 73.9% | 76.3% | 0.2% | 0.9% | |||
| Anoxic | 24,167 | Total | 5633 | 4937 | 666 | 16,363 | 15,033 | 6 | 1143 | |
| Percent | 23.3% | 20.4% | 2.8% | 67.7% | 62.2% | 0.0% | 4.7% | |||
| Total per Layer | Sulfur Reducers | Sulfur Oxidizers | Nitrogen Reducers | Nitrogen Oxidizers | Iron Reducers | Manganese Oxidizers | Unknown Organism | |||
| Hypoxic | 20,947 | Total | 66 | 1847 | 17,104 | 7 | 8 | 0 | 59 | |
| Percent | 0.3% | 8.8% | 81.7% | 0.0% | 0.0% | 0.0% | 0.3% | |||
| Chemocline | 30,301 | Total | 502 | 17,616 | 28,137 | 35 | 42 | 0 | 407 | |
| Percent | 1.7% | 58.1% | 92.9% | 0.1% | 0.1% | 0.0% | 1.3% | |||
| Anoxic | 24,167 | Total | 2289 | 13,466 | 14,711 | 246 | 152 | 0 | 1882 | |
| Percent | 9.5% | 55.7% | 60.9% | 1.0% | 0.6% | 0.0% | 7.8% | |||
| Archaea | Total per Layer | Fecal/ WTP/ Pathogen | Halotolerant | Aerobe | Anaerobe | Facultative | Methanogen | Sulfate Reducers | ||
| Hypoxic | 402 | Total | 19 | 373 | 368 | 32 | 0 | 32 | 0 | |
| Percent | 4.7% | 92.8% | 91.5% | 8.0% | 0.0% | 8.0% | 0.0% | |||
| Chemocline | 295 | Total | 20 | 193 | 166 | 119 | 9 | 121 | 0 | |
| Percent | 6.8% | 65.4% | 56.3% | 40.3% | 3.1% | 41.0% | 0.0% | |||
| Anoxic | 1083 | Total | 204 | 204 | 22 | 1006 | 54 | 1006 | 0 | |
| Percent | 18.8% | 18.8% | 2.0% | 92.9% | 5.0% | 92.9% | 0.0% | |||
| Total per Layer | Nitrate Reduction | Nitrification | Hydrogen Sulfide Formation | Nitrogen Fixation | ||||||
| Hypoxic | 402 | Total | 3 | 365 | 4 | 10 | ||||
| Percent | 0.7% | 90.8% | 1.0% | 2.5% | ||||||
| Chemocline | 295 | Total | 12 | 163 | 17 | 77 | ||||
| Percent | 4.1% | 55.3% | 5.8% | 26.1% | ||||||
| Anoxic | 1083 | Total | 70 | 6 | 125 | 665 | ||||
| Percent | 6.5% | 0.6% | 11.5% | 61.4% |
Table 4.
Comparative hydrochemistry. Hydrochemistry of local Upper Floridan Aquifer wells in comparison to the hypoxic and anoxic layer of Hospital Hole. Well data retrieved from the South Florida Water Management District (SWFMD).
Table 4.
Comparative hydrochemistry. Hydrochemistry of local Upper Floridan Aquifer wells in comparison to the hypoxic and anoxic layer of Hospital Hole. Well data retrieved from the South Florida Water Management District (SWFMD).
| Well Identifier | Well Depth (m) | Casing Depth (m) | Distance to Coast (km) | Collection Date | Sulfate (mg/L) | Alkalinity (mg/L) | Specific Conductance (uS/cm) |
|---|---|---|---|---|---|---|---|
| 20891 | 29 | 13 | 1.2 | 11 February 2016 | 6.7 | 211.3 | 1999 |
| 20890 | 49 | 41 | 1.2 | 11 February 2016 | 26.6 | 300.1 | 2100 |
| 20690 | 92 | 84 | 2.4 | 24 March 2016 | 193 | 146.9 | 4643 |
| 20124 | 138 | 135 | 2.8 | 3 February 2016 | 618 | 140.8 | 358 |
| 20893 | 159 | 147 | 4.0 | 11 February 2016 | 1100 | 122 | 3851 |
| 20939 | 160 | 154 | 0.8 | 24 March 2016 | 2750 | 113 | 50,246 |
| 20735 | 171 | 46 | 8.0 | 31 January 2001 | 2569 | N/A | 12,600 |
| Hospital Hole hypoxic layer | 1.4 | 28 March 2016 | 800 | 145 | 20,000 | ||
| Hospital Hole anoxic layer | 1.4 | 28 March 2016 | 1000 | 200 | 25,000 | ||
© 2018 by the authors. Licensee MDPI, Basel, Switzerland. This article is an open access article distributed under the terms and conditions of the Creative Commons Attribution (CC BY) license (http://creativecommons.org/licenses/by/4.0/).
Share and Cite
MDPI and ACS Style
Davis, M.C.; Garey, J.R. Microbial Function and Hydrochemistry within a Stratified Anchialine Sinkhole: A Window into Coastal Aquifer Interactions. Water 2018, 10, 972. https://doi.org/10.3390/w10080972
AMA Style
Davis MC, Garey JR. Microbial Function and Hydrochemistry within a Stratified Anchialine Sinkhole: A Window into Coastal Aquifer Interactions. Water. 2018; 10(8):972. https://doi.org/10.3390/w10080972
Chicago/Turabian StyleDavis, Madison C., and James R. Garey. 2018. "Microbial Function and Hydrochemistry within a Stratified Anchialine Sinkhole: A Window into Coastal Aquifer Interactions" Water 10, no. 8: 972. https://doi.org/10.3390/w10080972
Note that from the first issue of 2016, this journal uses article numbers instead of page numbers. See further details here.