Water and Nitrogen Productivity of Potato Growth in Desert Areas under Low-Discharge Drip Irrigation

French Associates Institute for Agriculture and Biotechnology of Drylands, The Jacob Blaustein Institutes for Desert Research, Ben-Gurion University of the Negev, Sede Boqer Campus, Midreshet Ben-Gurion 84990, Israel
*
Author to whom correspondence should be addressed.
Water 2018, 10(8), 970; https://doi.org/10.3390/w10080970
Submission received: 3 July 2018
/
Revised: 19 July 2018
/
Accepted: 21 July 2018
/
Published: 24 July 2018
(This article belongs to the Special Issue Water Management for Sustainable Food Production)
Abstract
:Narrow profit margins, resource conservation issues and environmental concerns are the main driving forces to improve fertilizer uptake, especially for potatoes. Potatoes are a high value crop with a shallow, inefficient root system and high fertilizer rate requirements. Of all essential nutrients, nitrogen (N) is often limiting to potato production. A major concern in potato production is to minimize N leaching from the root zone. Therefore, the main objective of this study was to examine the potato crop characteristics under drip irrigation with low-discharge (0.6 L h−1) and to determine the optimal combination of irrigation (40, 60, 80, and 100%) and fertigation (0, 50, and 100%) doses. In this study, the 80% (438.6 mm) irrigation dose and a 50% (50 mg N L−1) fertigation dose (W80%F50%) showed that these doses are sufficient for optimal potato yield (about 40 ton ha−1) in conjunction with water and fertilizer savings. Moreover, this treatment did not exhibit any qualitative changes in the potato tuber compared to the 100% treatments. When considering water productivity and yield, one may select a harsher irrigation regime if the available agricultural soils are not a limiting factor. Thus, higher yields can be obtained with lower irrigation and fertigation doses and a larger area.
HIGHLIGHTS:
- Potatoes grown under low-discharge drip irrigation in desert region
- Tuber yields and quality were similar to the ones from sprinkler irrigation
- Water productivity affected by water dose and nitrogen level
1. Introduction
Potato (Solanum tuberosum L.) growth is characterized by a high demand for nitrogen fertilizer due to its necessity for proper plant and tuber development [1,2,3]. However, due to a shallow (approximately 30 cm) and inefficient root system, applied water and fertilizer is at risk of leaching below the root zone [4,5]. Although potatoes have a relatively high value, fertilization costs might negatively affect their profitability [6,7]. Therefore, one needs to adjust nitrogen and water availability to crop demand in order to maximize yield, tuber quality, and nitrogen productivity [8,9,10].
The potato growing season in Israel is from autumn (September–November) to late spring (May–June). The growing area is about 16,000 ha with annual production of approximately 650,000 ton/year. Most growing areas are found in the western Negev region (about 75%); about 20% are located in the center and the remainder in the Galilee and Arava Desert. Whilst appropriate areas for growing potatoes are available in the Arava Desert, there is a shortage of irrigation water and the supply needs to be ensured throughout the growing season. Additionally, the quality of the irrigation water available for potato growth in this region is low due to its relatively high salt content (2–4 dS m−1). This presents a real obstacle to the use of sprinkler irrigation—commonly considered as the best irrigation technique for potatoes [11]. Moreover, due to the low irrigation efficiency of sprinkler irrigation (about 75%), there is a loss of water and leaching of mobile nutrients. These inherent inefficiencies clearly lead to very low recoveries of applied fertilizers as well as the possibility of groundwater contamination.
In Israel, potatoes are usually grown on sandy soils, which have low water and nutrient holding capacity, thus increasing the risk of nitrogen loss by leaching under excess irrigation [12,13]. Thus, an alternative practice should be adopted in such areas and especially in arid areas where water resources are limited.
The use of drip irrigation and fertigation may be the solution. The employment of dripper discharge lower than 0.6 L h−1 has been recently demonstrated as an efficient method for potato growth in an arid region [14]. Due to low discharge and precise water application, drip irrigation reduces groundwater contamination, water and fertilizer waste, and energy inputs [15,16,17]. Surface or subsurface drip irrigation enables high water and oxygen availability in the root zone due to partial wetting [18]. Because of high soil-water pressure head and hydraulic conductivity in the root zone, water and nutrient availability is increased [19,20]. By minimizing the seepage losses beneath the shallow potato root zone, water and nitrogen productivity can be increased [21,22]. However, in the long term, one should monitor and prevent the accumulation of salts in the root zone, especially in arid areas where precipitation is almost negligible [23,24,25].
In areas where fertigation is applied, it is important to take into consideration the dripper discharge, the spacing between drippers, and soil hydraulic properties in order to achieve the optimal water content [26,27,28,29] and nitrogen availability [30] in the root zone.
Increasing water productivity (i.e., the volume of irrigation water required for a desired yield) is currently one of the main goals in arid and semi-arid regions [31,32]. Recently, Trifonov et al. [14] suggested that higher water productivity in potato crops could be achieved in the Arava Desert by using low-discharge drip irrigation. In their study, the combination of emitter discharge (0.6 vs. 1.6 L h−1), spacing (25 vs. 50 cm) and irrigation dose (40, 50, 60, 80, 100 and 120%; where 100% was approximately 620 mm) was examined. In terms of tuber yield, it was found that a combination of sprinkler irrigation for germination (approximately 100 mm) and low discharge drip irrigation produced potato yields similar to the ones obtained from sprinkler irrigation, without harming tuber marketability (i.e., size and quality). The results suggested that the 80% irrigation dose is sufficient for optimal tuber yields and that discharge of 0.6 L h−1 is applicable for dripper spacing ranging from 20 to 50 cm. In terms of water productivity, it was demonstrated that the lower the irrigation dose the higher the water productivity.
Following the insights from our previous study [14], we further examined the influence of the irrigation water dose in conjunction with three nitrogen levels on potato growth in the Arava Desert. Hence, the main objective of this study was the optimization of potato growth under a low discharge drip irrigation and fertigation regime.
2. Materials and Methods
2.1. Site Description
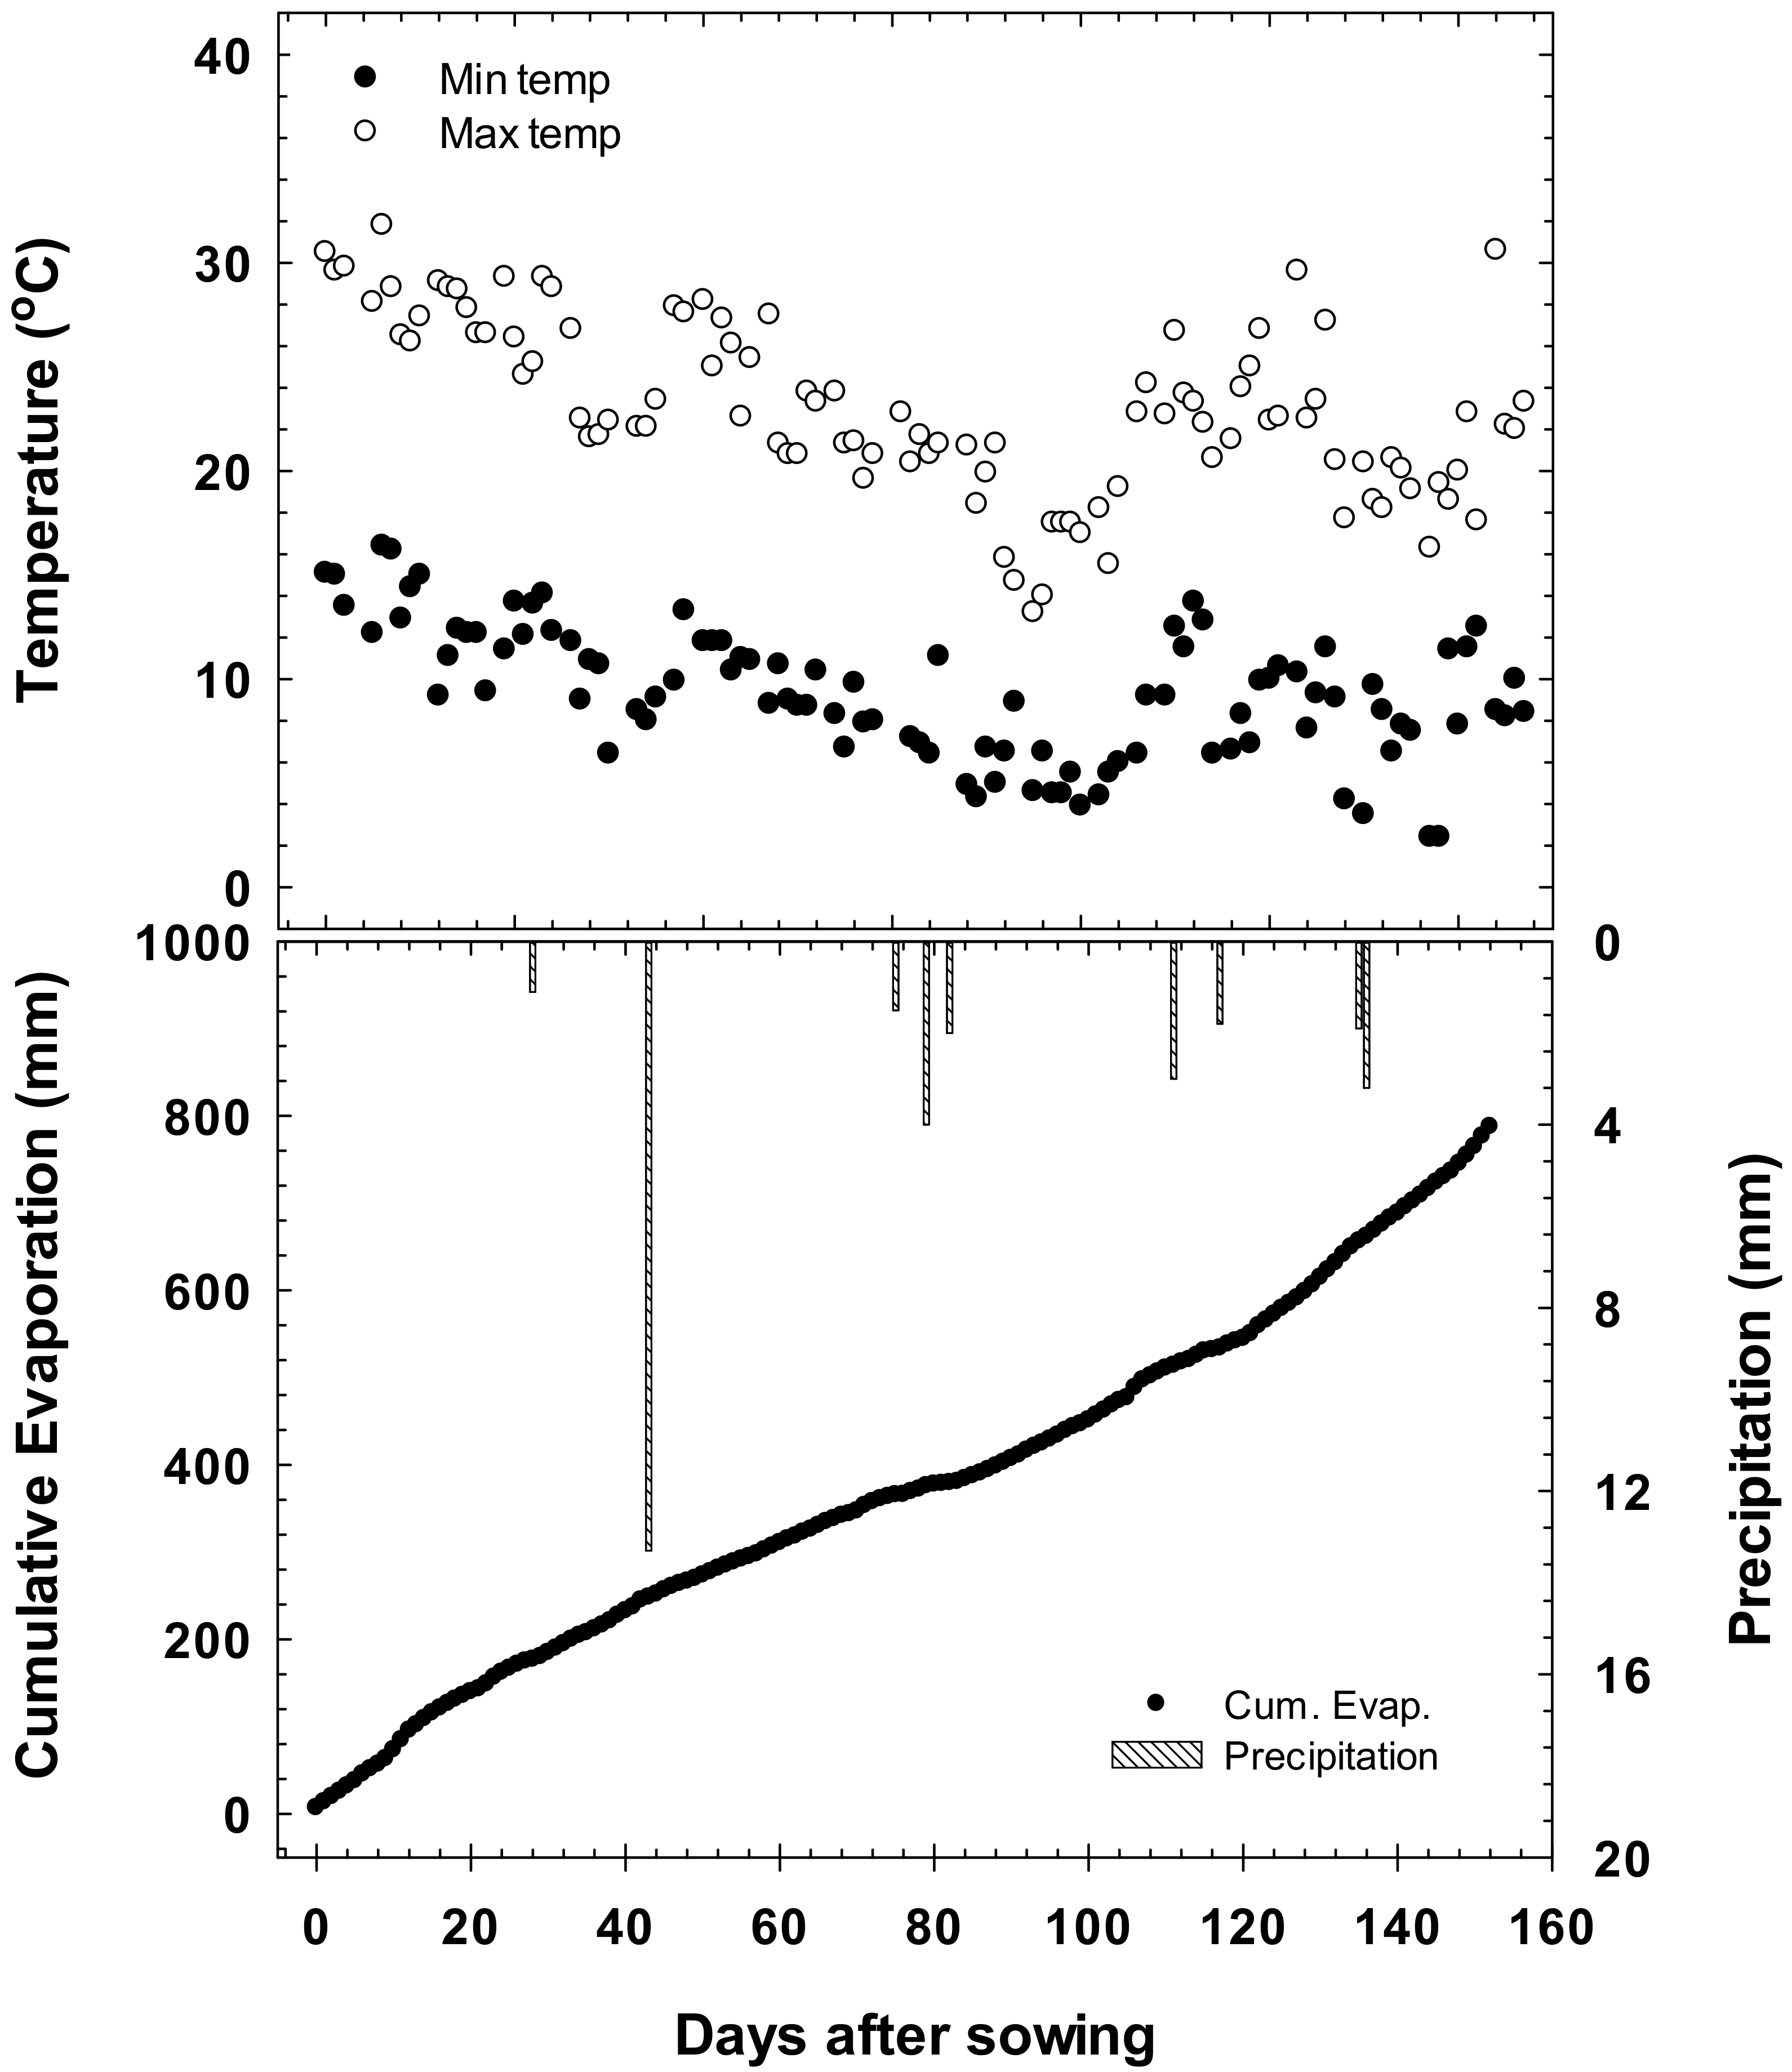
The experiment was carried out over the winter of 2014–2015 on Kibbutz Yotvata, situated in the Arava Desert region of Israel. The commonest crops in this area are date palms, onions, and potatoes grown mainly in loamy sand (83% sand, 8% silt, and 9% clay) with a bulk density of 1.3 g cm−3. The saturated water content, field capacity and wilting point are 0.36, 0.13, and 0.05 (v v−1), respectively. The saturated hydraulic conductivity of this soil is 0.15 m h−1. This area has a dry desert climate and during the study period the mean precipitation and class-A evaporation pan were approximately 32 mm and 620 mm, respectively. The annual temperature varied between 16 °C and 31 °C (Figure 1). Additional climatic information on the study area and season can be found in [14].
2.2. Experimental Design
The experimental field was roughly 0.2 ha in size (A = L × W = 180 m × 10.8 m). The experimental design consisted of 12 treatments with four replicates (i.e., 48 plots). Each replicate consisted of three beds, each 15 m by 0.9 m. The drip line had drippers with a 0.6 L h−1 discharge and 25 cm spacing between the drippers. As mentioned previously, this setup was selected based on our previous experiments that examined drip discharge and spacing for optimal water productivity [14]. The main findings from the previous study demonstrated that a combination of sprinkler irrigation for germination followed by low discharge drip irrigation could provide potato yields similar to those reported for sprinkler irrigation only, without harming tuber size and quality. During the two years of the previous study, the 80% water dose (i.e., 100% was approximately 620 mm) was sufficient for optimal potato growth in conjunction with water and fertilizer savings (fertigation rate was 100 mg N L−1). Accordingly, the current experiment examined the effect of nitrogen dosage (i.e., 0, 50, and 100%) in conjunction with the water dose (i.e., 40, 60, 80, and 100%) on potato growth and yield. The treatments were marked as following: WX%FX%, where W and F refer to water irrigation and fertigation, respectively, and X is a % value (e.g., W80%F50%: 80% irrigation water dose and 50% fertigation dose). The treatment blocks were randomly distributed over the experimental fields. The representative chemical composition of the irrigation water in Yotvata is shown in Table 1.
Potato tuber (cv. Hermes) sowing took place on 28 October 2014. This date is day zero after sowing (i.e., DAS = 0). Tubers were distributed at a density of five tubers per meter at a depth of 20 cm. The spacing was 1 m between beds and the height of each bed was 40 cm with a trapezoid-like shape—created during placement of the shallow subsurface drip irrigation laterals at 5 cm depth (DAS = 2). The cumulative dose of irrigation water for germination was about 100 mm and was provided by sprinkler irrigation at three-day intervals. The actual cumulative irrigation dose, supplied by drip irrigation for each treatment, is shown in Table 2.
In the Kibbutz Yotvata fields, the main nitrogen sources are fertigation and soil amendment with composted cattle manure, produced from the kibbutz’s dairy barns. The representative composition of this composted cattle manure is given in Table 3. It was applied at 40 m3 ha−1 before sowing. Consequently, this was the main nitrogen source for the F0% treatments. The fertigation with nitrogen fertilizer, 100 mg N L−1 of “Arava” liquid fertilizer (ICL Ltd., Haifa, Israel), was supplied with the irrigation water. The nitrogen amount for each irrigation regime was proportional to the irrigation dose. However, since a continuous irrigation regime was employed, the available nitrogen concentration in the soil solution was comparable. The Arava fertilizer consists of NH4NO3 and KNO3 as the nitrogen sources. Moreover, it was adjusted to be used with the irrigation water that is common to the Arava region (<1% Cl− and an acidic pH). It is important to mention that the fertigation started with initiation of drip irrigation (DAS = 26) and halted at the foliage top-kill (DAS = 130). Following the foliage top-kill, irrigation (without fertigation) was continued for three weeks, for the purpose of peel formation, until the harvest (DAS = 152).
2.3. Sampling and Analysis
Each replicate consisted of three rows and, to avoid edge effects, only the middle bed was sampled. During the growing stage, five samples (DAS = 58, 71, 85, 99 and 113) of petiole nitrate-N concentration were taken. The sampling was performed on fully expanded youngest leaves on the main stem, typically fourth or fifth from the top, from three different plants [33]. The sampling was performed at 7 to 14 day intervals [34]. At DAS = 152, the potato yield was assessed on collected tubers from an approximately 2 m2 area (2.2 m by 0.9 m). The yield from all four replicates was pooled and weighed. In addition to this, two random replicates from each treatment were selected and the following data were collected for about 1600 tubers: Tuber length, tuber width, tuber mass, and their total number. The tuber qualitative evaluation included dextrose concentration and percentage of total solids. The soil, both above (0–5 cm) and beneath (5–20, 20–40 and 40–60 cm) the drippers, was sampled at the beginning and end of the growing season. These samples are referred to later as 5, 20, 40 and 60 cm, respectively. Chemical analyses (EC, Cl−, dissolved organic carbon (DOC), total nitrogen (TN), NO3−, and NH4+) were performed on 1:1 soil:double distilled water (DDW) extracts.
2.4. Statistical Analysis
Multifactorial analysis of the irrigation and nitrogen treatments showed no significant effect. We performed our statistical analysis based on each treatment. Data were analyzed by analysis of variance (ANOVA) by using JMP software (version 12, 2015, SAS InstituteCary, NC, USA). Means were separated using the Student’s-t comparison test at the probability level (p) of 0.05. Differences at the p < 0.05 level were considered to be significant. Deviation from the mean is presented in the tables and figures as standard deviation (SD).
3. Results and Discussion
3.1. Water Inputs and Outputs
The impacts of water restriction on potato production will likely increase over the next decades due to climate change. Alternatively, areas that were not previously considered as arid may undergo desertification, thus forcing farmers to adapt to new conditions. Therefore, there is a need for a suitable irrigation regime as well as knowledge of soil properties. Each soil type has its own properties that will indicate the water availability to the crop. Based on the field capacity and wilting point of the soil in our study, the available soil water storage was approximately 8%. Specifically, a bed width of 0.9 m and active root zone of 0.3 m allows for an estimation that the available water (storage) is approximately 22 mm. Assuming that this is the case for all treatments, it makes up about 10% of the low irrigation dose (i.e., 40%) and about 4% of the higher dose (i.e., 100%). Note that the net contribution of rainfall to the water balance was negligible (about 32 mm) as the differences in water storage between the beginning and end of the growing season were small. Specifically, the mean precipitation in the study area is about 30 mm/year, distributed over 5 to 10 rain events (e.g., Figure 1). Considering the potential evaporation in the study region (i.e., approximately 5 mm/day), clearly the rain contribution on a daily basis is negligible. The above precipitation level and distribution is common to the study area [14] and, consequently, the rain contribution to the total water balance. Consequently, the potato growth in this area is entirely dependent on the supplied irrigation and fertigation. The actual irrigation dose corresponded well to the planned doses as can be seen in Table 2, with the average deviation from the planned dose being <1%. The actual 100% irrigation dose was about 545 mm; together with the germination dose (100 mm), the total water applied was 645 mm, comprising about 80% of the cumulative potential evaporation during the growing season (787 mm—Figure 1).
3.2. Tuber Yield
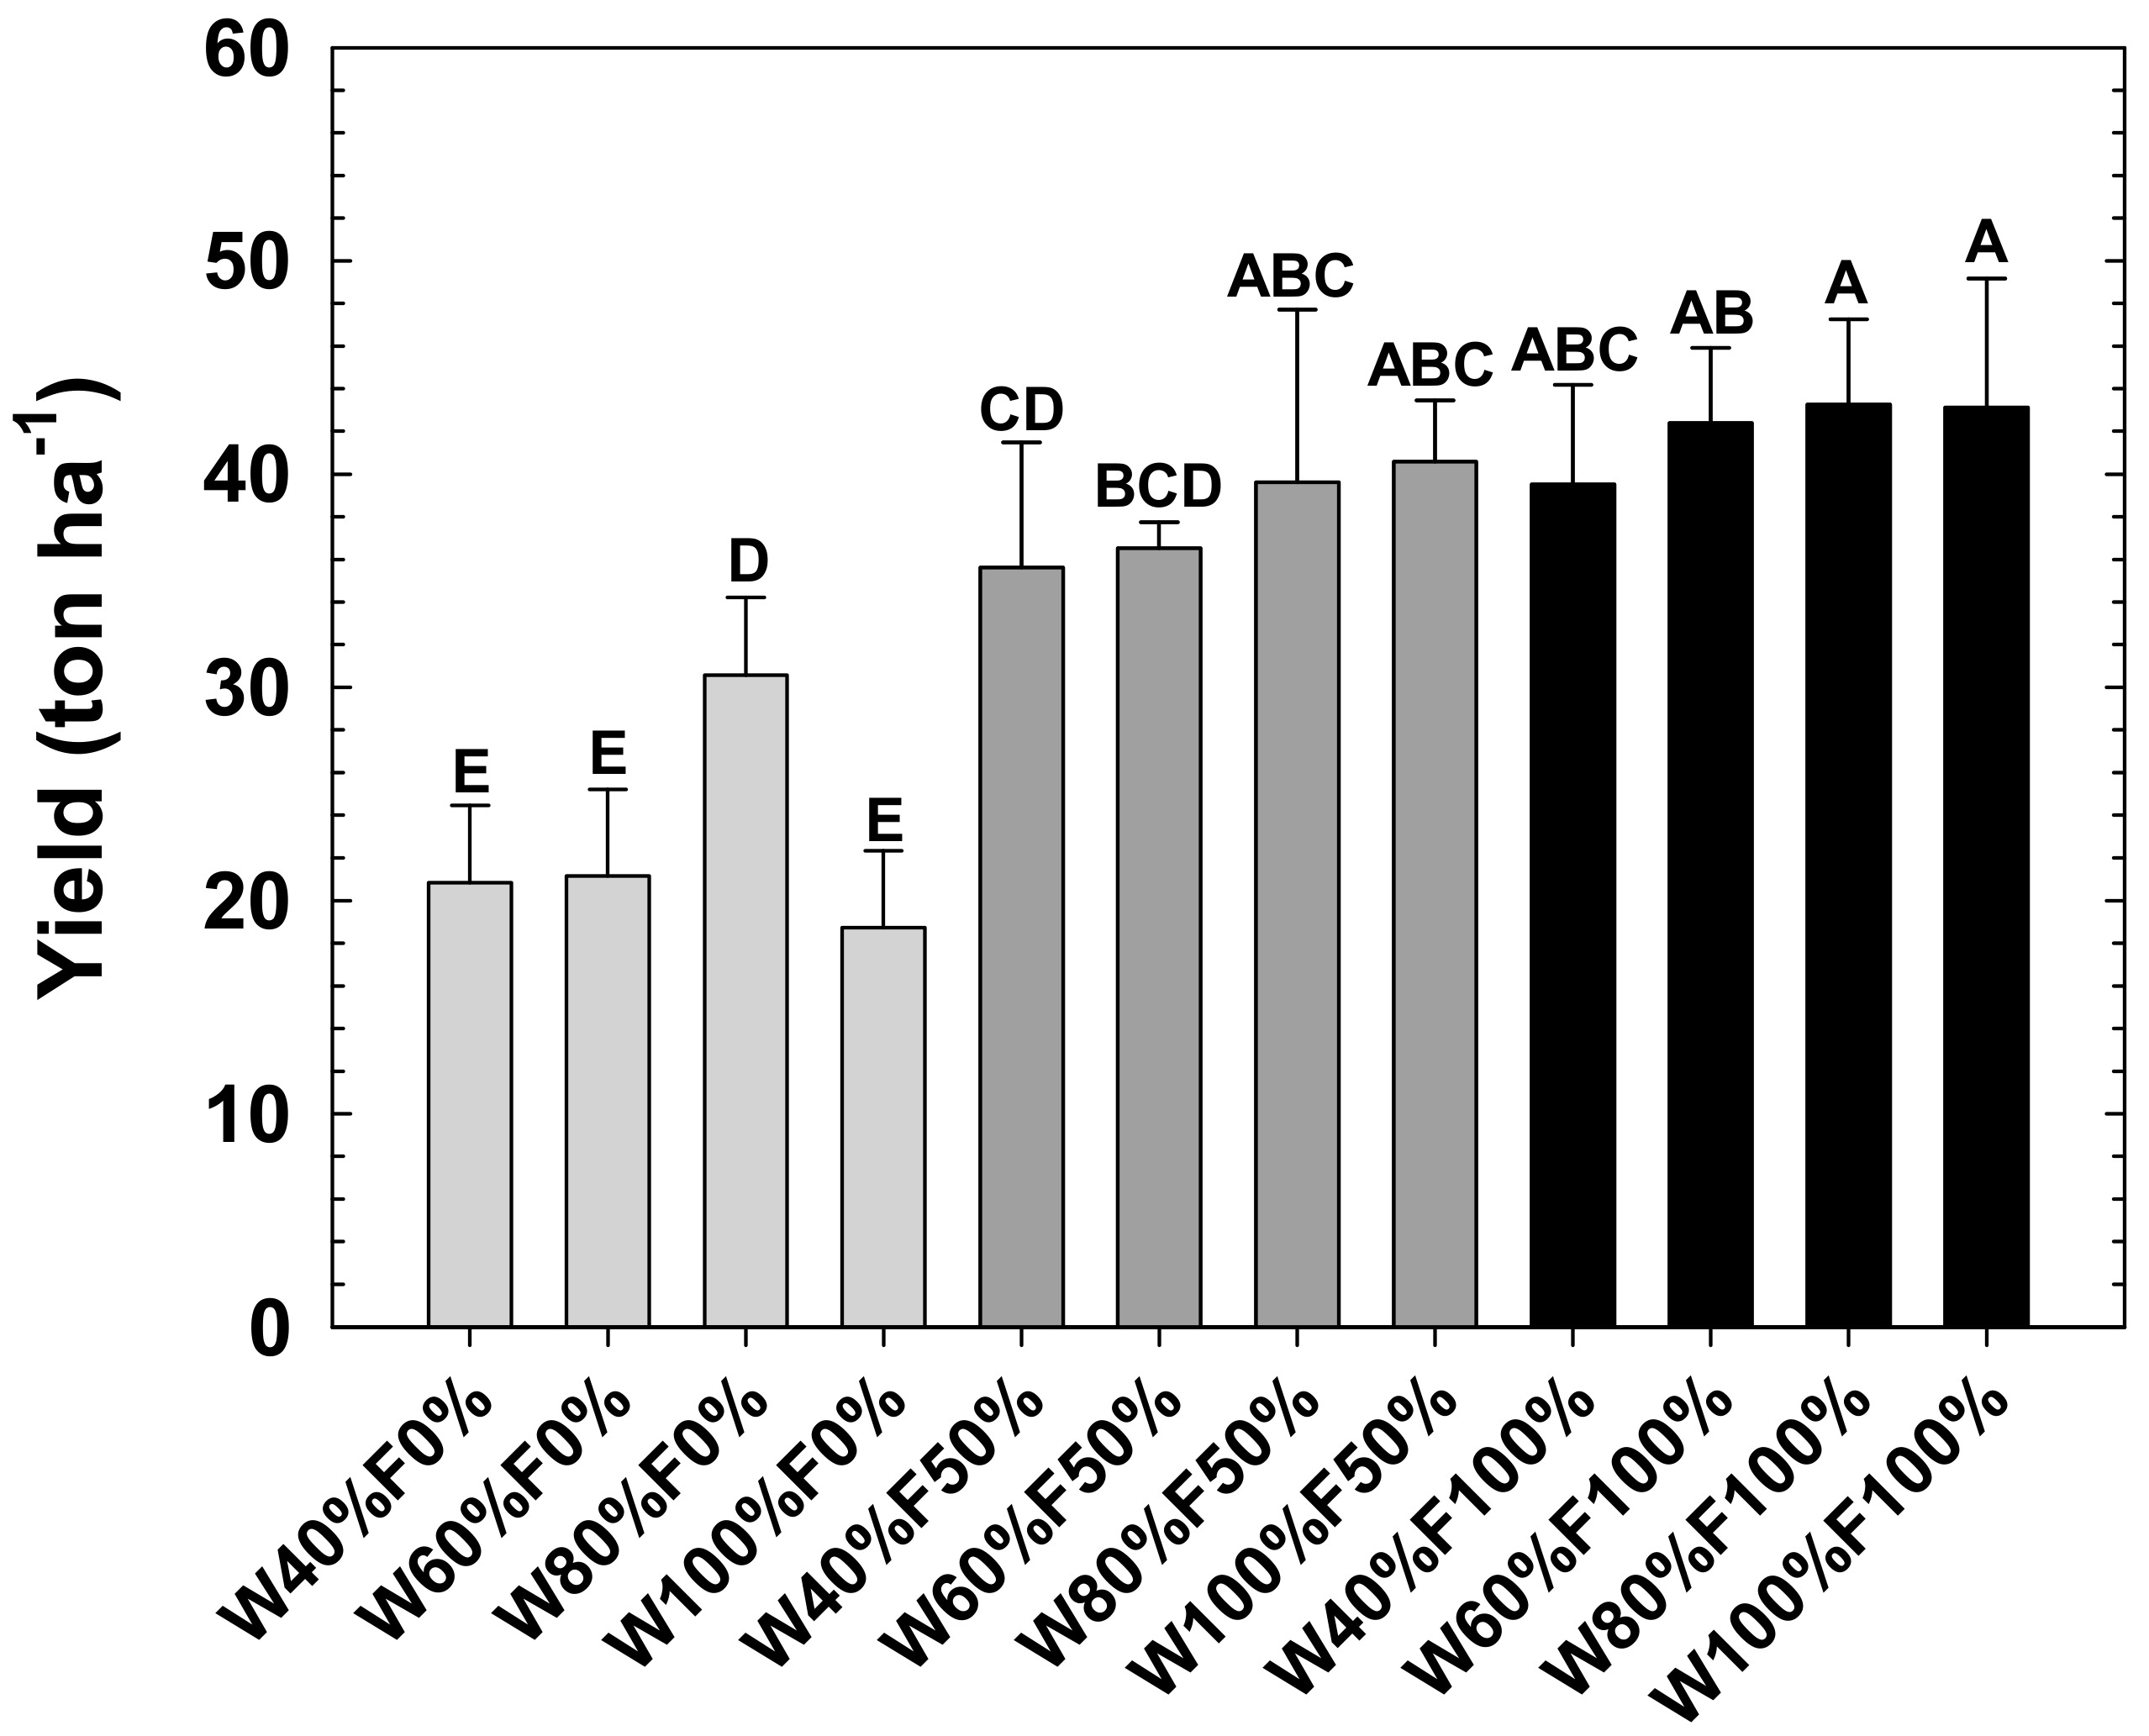
A common yield value for the Hermes cultivar in the Arava region is approximately 40 ton ha−1 [14]. The potato yield from this study (3rd year) attained that value and was similar to the results obtained from the study two years earlier. This supports the evidence that the yield under low-discharge drip irrigation is similar to that reported for sprinkler irrigation and ranges from 30 to 50 ton ha−1 [11,35,36]. In Figure 2, the results obtained for the total tuber yield as a function of nitrogen (F0, 50 100%) and water doses (W40, 60, 80, 100%) are presented. For a given nitrogen treatment, no significant differences for tuber yield were found between the irrigation doses, excluding the F0% treatment where tuber yield under the W80% irrigation dose was found to be significantly higher than the lower (i.e., W40% and W60%) and higher (i.e., W100%) irrigation doses. A possible explanation for this observation may be attributed to the nitrogen availability. Specifically, since the only source of nitrogen in the F0% treatment is from the applied compost, the rate and extent of its release from the solid compost to the soil solution will govern its availability. In this regard, an irrigation dose lower than W80% may not be sufficient while the higher irrigation dose (i.e., W100%) may leach the available nitrogen from the root zone. Figure 2 suggests that some saving of water and fertilizer are possible. However, additional parameters should be considered in order to conclude the optimal irrigation and fertigation regime.
3.3. Water Productivity
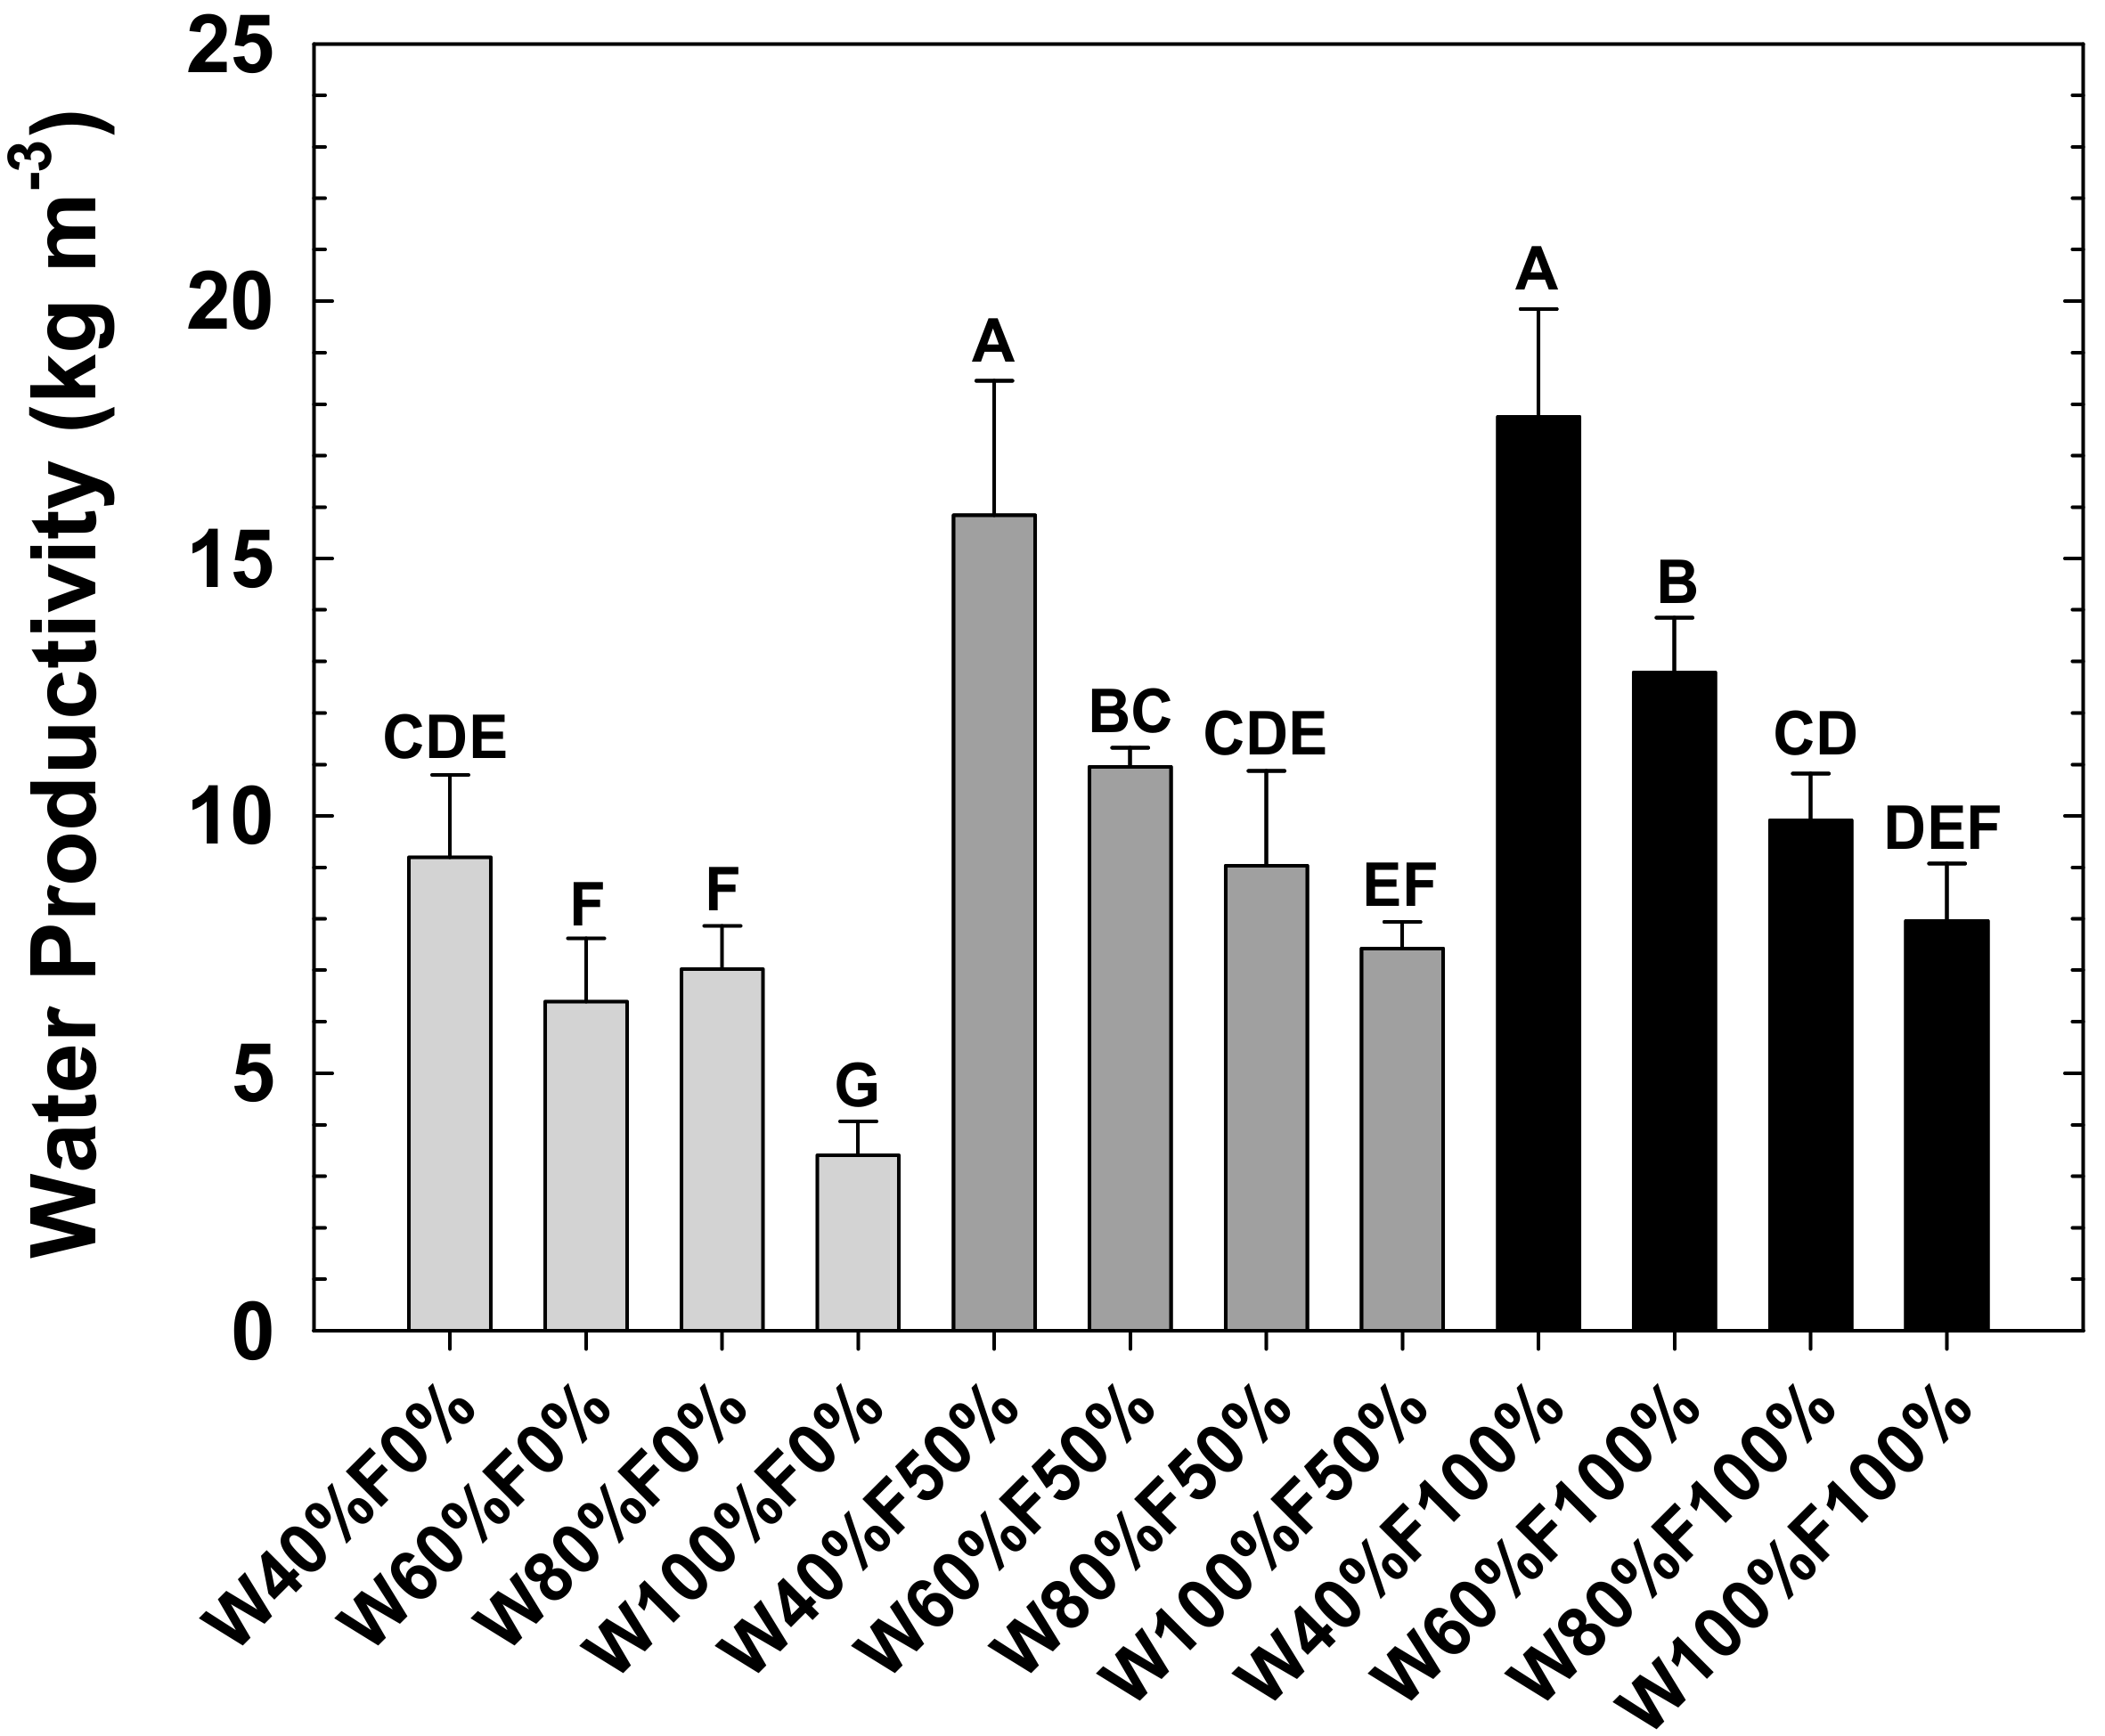
The amount of irrigation water needed to obtain a given yield (kg m−3) is termed water productivity. The results obtained (Figure 3) clearly demonstrated that, for a given nitrogen treatment, water productivity decreases with increased irrigation dose. These results are in agreement with our previous study on potato growth using low discharge drip irrigation [14].
However, for a given irrigation dose, significant differences in water productivity could only be observed between the F0% treatment relative to the F50% and F100% treatments. The latter did not exhibit a significant difference, implying that for the nitrogen treatments employed in this study the limiting factor of water productivity in potato growth is the dose of irrigation water.
The comparison between the F0% treatment relative to the F50% and F100% treatments implied that both nitrogen and water doses should be considered. Therefore, further reduction in the nitrogen dose should be examined to evaluate the minimum nitrogen treatment from which water productivity is reduced. It was interesting to see that the total tuber yield obtained for the W80%F0% treatment was not significantly different from the one obtained for the W40%F50% and W60%F50% treatments. However, the other F0% treatments exhibited a significantly lower yield than the F50% and F100% treatments, suggesting that at low irrigation doses, nitrogen availability is the limiting factor for tuber yield. Concerning the W100%F0% treatment, we can assume that the additional water caused additional leaching of nutrients such as nitrogen.
If water and fertilizer costs are of a big concern for the farmer, one may apply the W40%F50% regime. However, in order to compensate for a relatively decreased yield, it is necessary to increase the field size in order to produce profitable amounts of potatoes.
3.4. Nitrogen Productivity
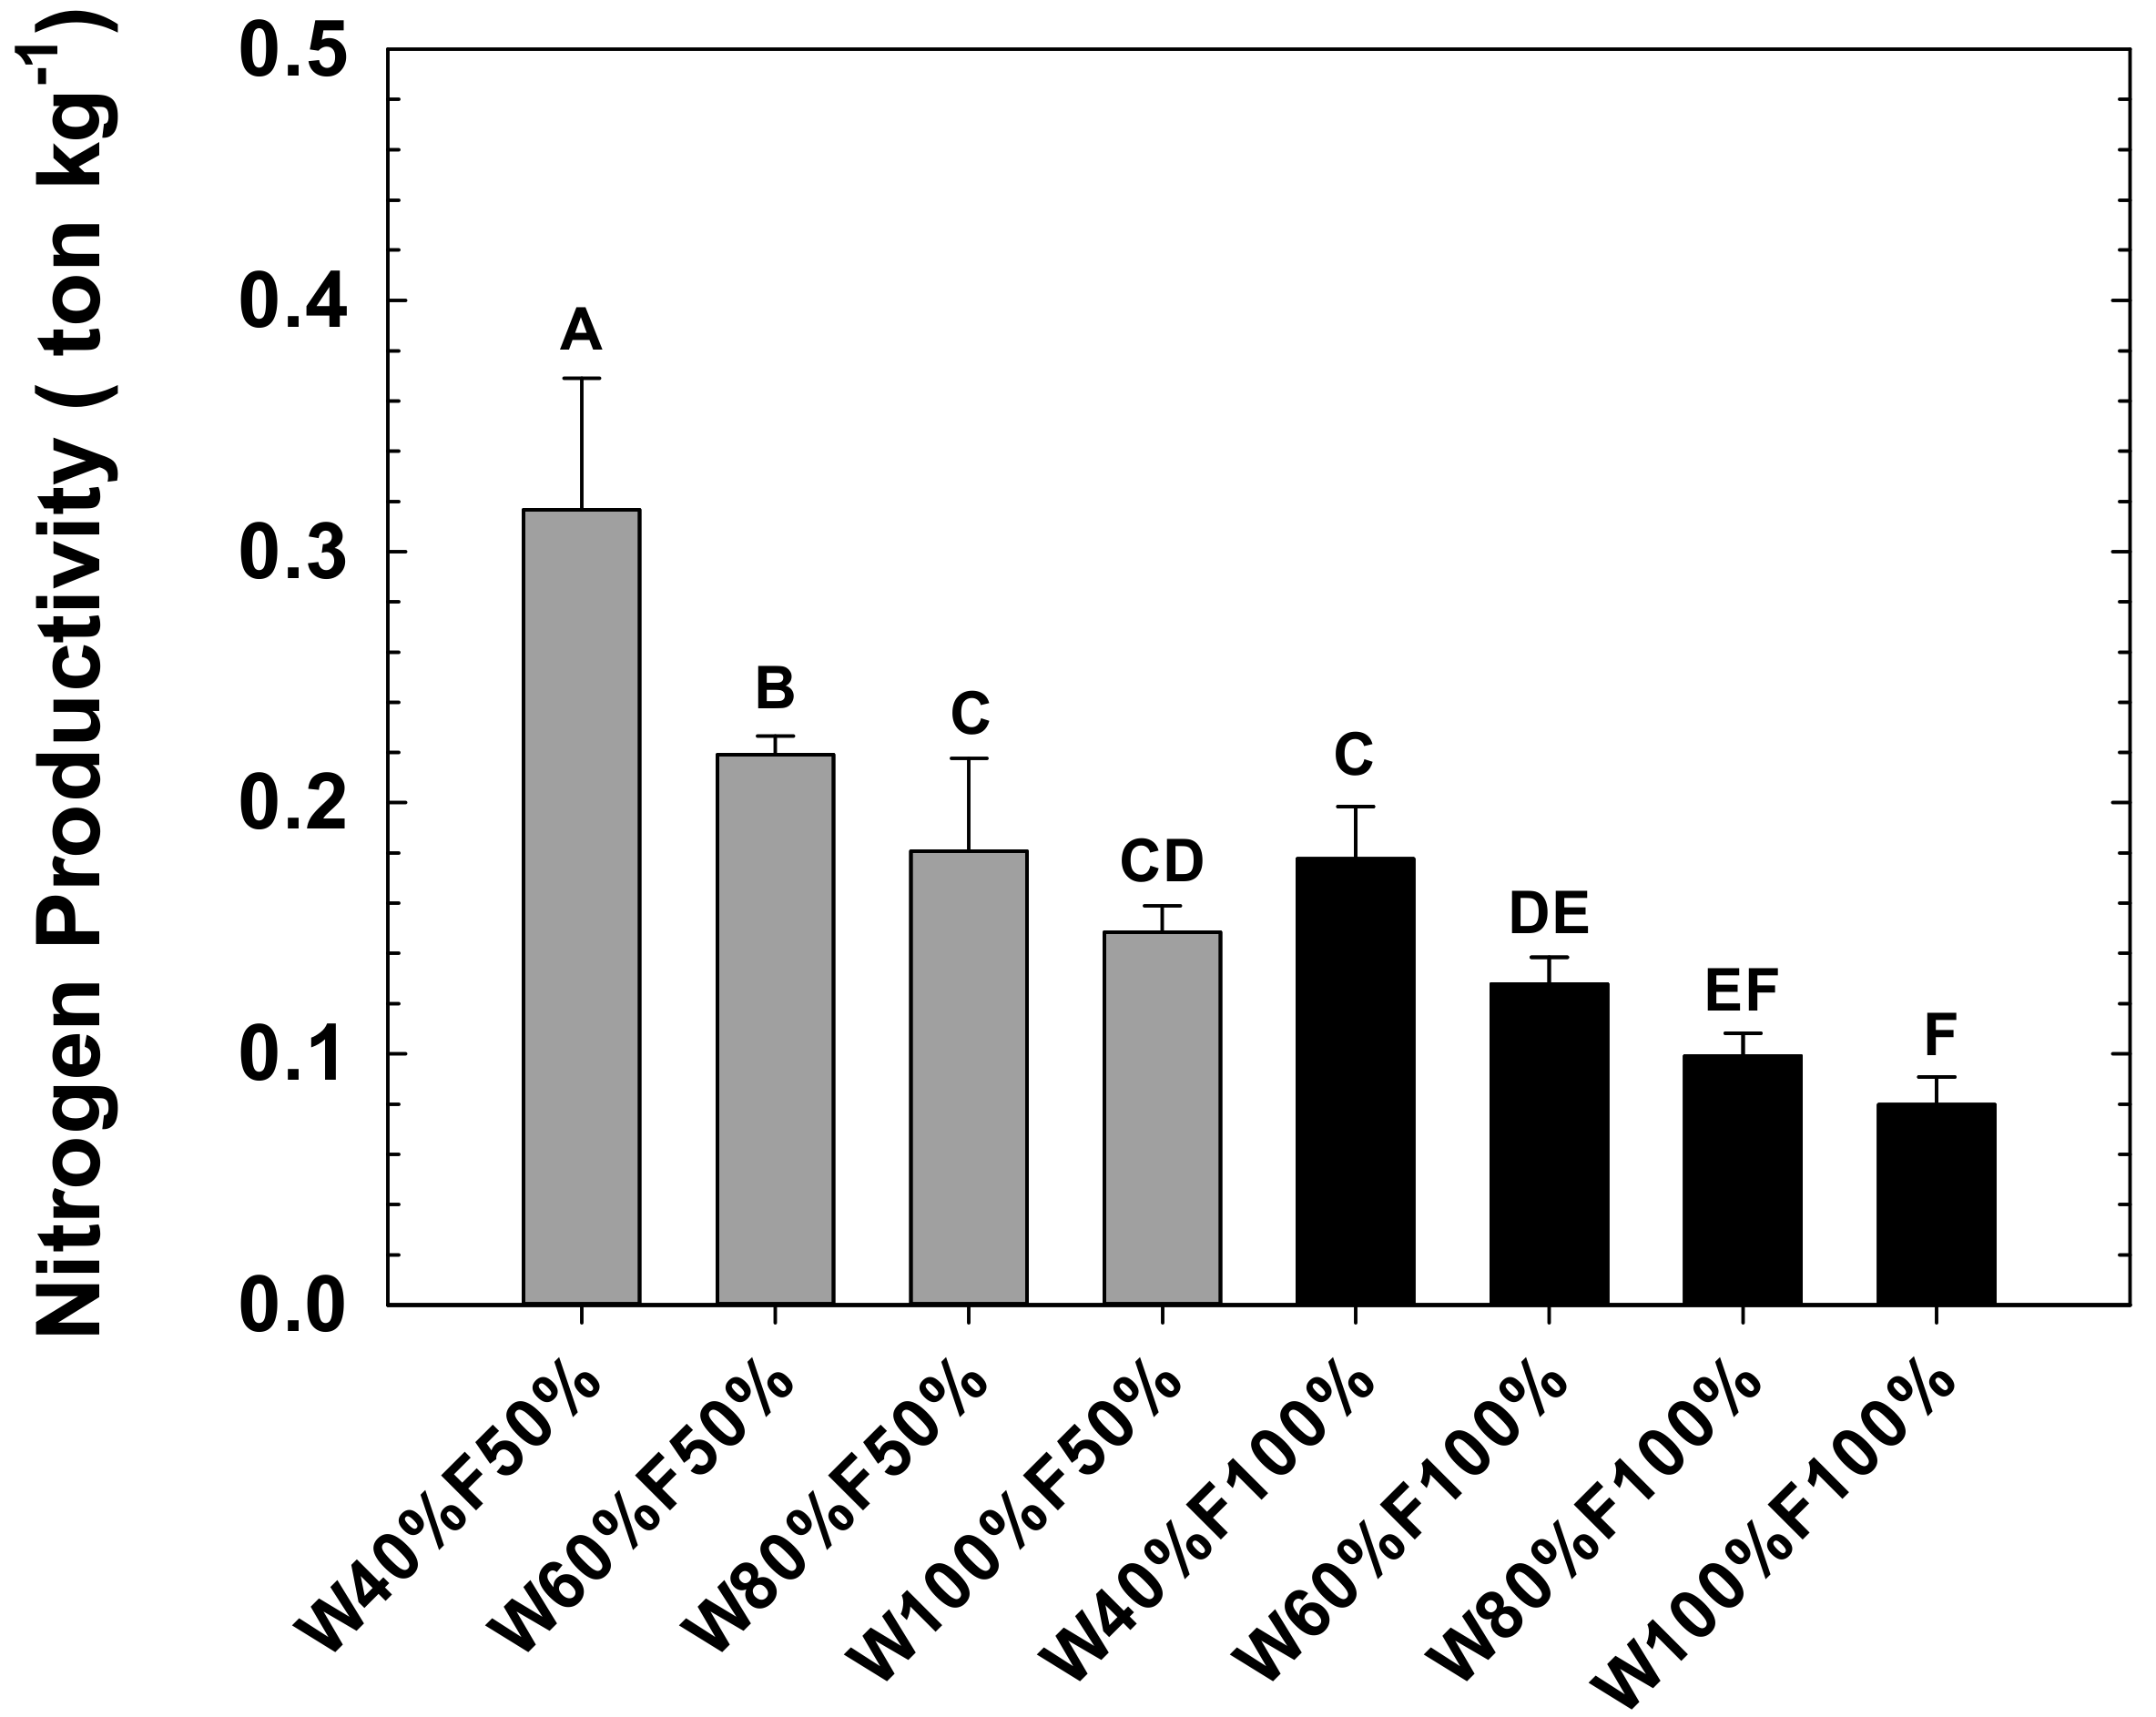
Nitrogen productivity refers to the yield per applied N fertilizer (ton kg−1). This value also implicitly depends on the interaction of the given water dose to the fertigation and, as a result, the harvested yield (Figure 4). The main nitrogen addition was due to fertigation and therefore the F0% treatments are not included in Figure 4 due to uncertainty regarding the release dynamics and concentrations of soluble nitrogen from the soil-compost solid phase. Nitrogen productivity decreases with an increasing water dose, which indicates an efficient usage of nitrogen fertilizer. Similar to the results for water productivity, Figure 4 shows that much more nitrogen was applied as compared to the yield with increasing water dose.
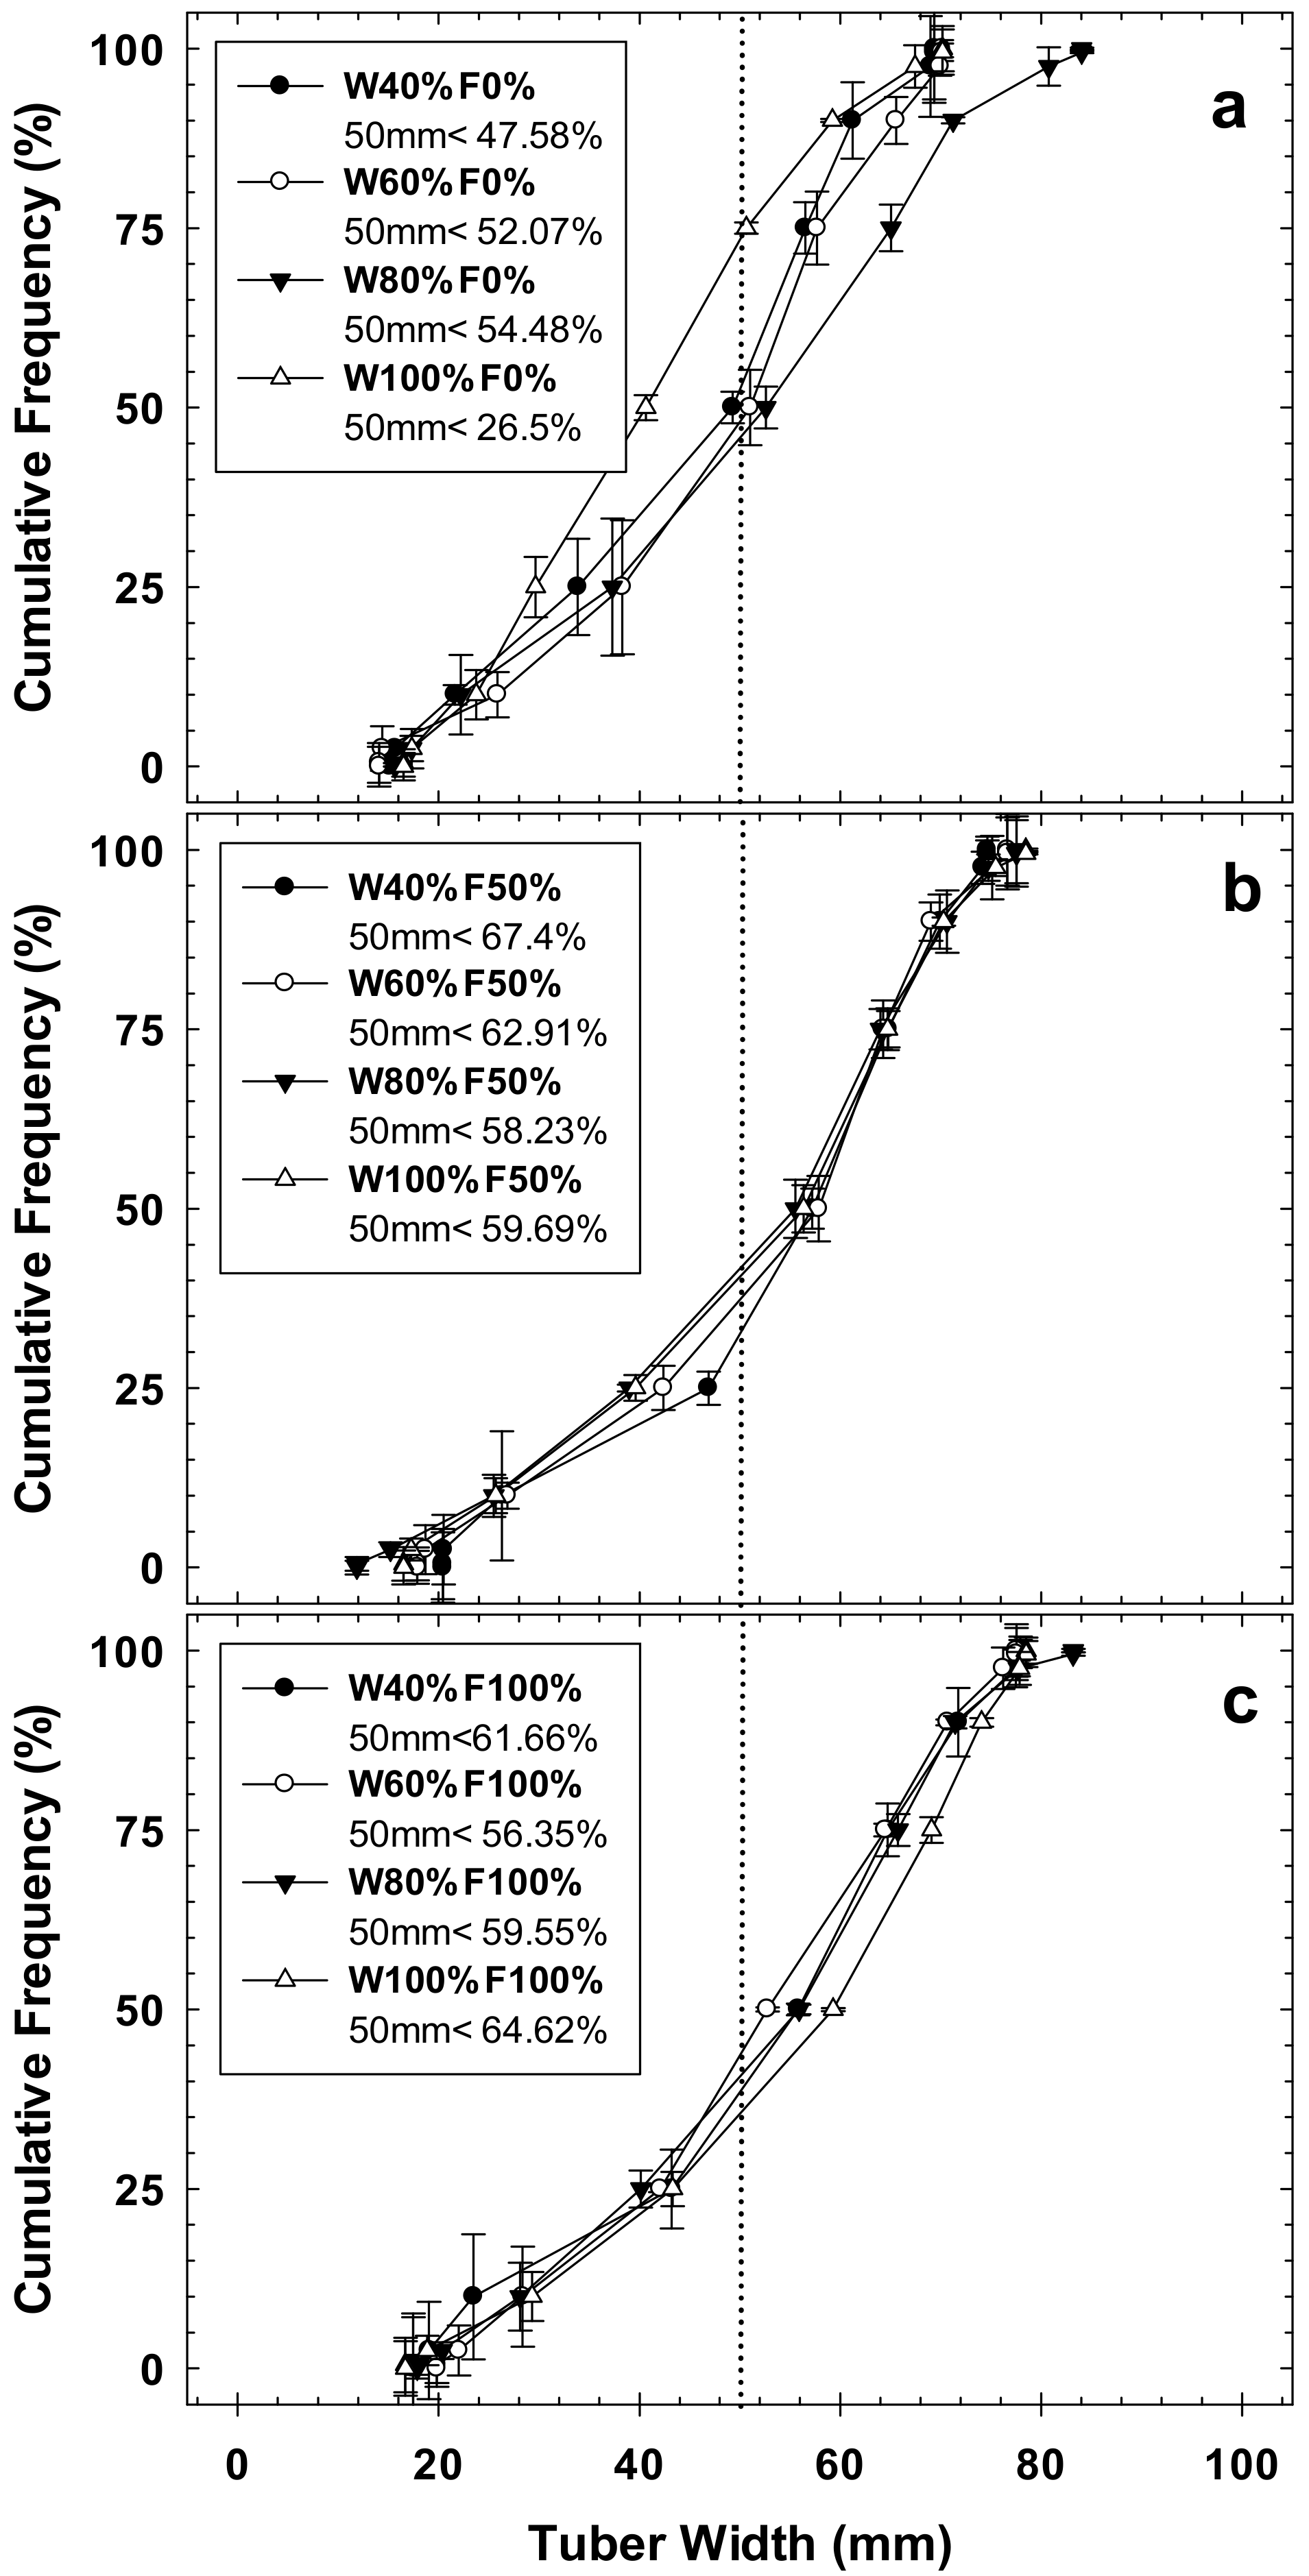
3.5. Potato Tuber Size Distribution
In addition to the total harvested yield, marketability and commercial value are of considerable importance in directing farmer decision making. In Israel, a major marketability criterion is tuber width. The results of the cumulative width distribution of all treatments are shown in Figure 5. We used the trade standard of selecting potatoes larger than 50 mm width (diameter); vertical dashed lines in Figure 5. The following cumulative width distributions are based on this standard. The results show that the mean value of tuber widths higher than 50 mm for the three fertigation treatments are 45.16 ± 12.76%, 62.06 ±4.06%, 60.55 ± 3.49% for the F0%, F50%, and F100%, respectively (see Figure 4 for detailed values per fertigation treatment). The F50% treatment was similar to F100% and both were very different from the F0%. With regard to the water doses, no significant differences between treatments were found. Tuber length and mass distribution were also recorded (data not shown) and good correlations were found between tuber length/width and tuber mass/width (mass = 0.0007 width2.9273, R2 = 0.98; length = 0.7599 width1.1016, R2 = 0.93). Based on this scaling it is reasonable to use one tuber parameter.
3.6. Potato Tuber Quality
Representative samples of tubers from each treatment were assessed for other commonly used quality parameters. Tuber color was assessed by spectroscope, where a score of 60 (arbitrary units) and above is considered acceptable for market. No significant differences were found between treatments (mean value 67.0 ± 1.94). Total solids percentage (dry mass basis) should range from 19 to 26%. Our results were a low but acceptable mean of 21.3 ± 0.45%. The Hermes cv. is primarily grown as a chipping potato and so low dextrose values are preferred. Higher dextrose values (>0.1 g L−1) are not considered marketable as high dextrose concentrations leads to dark tubers, an unattractive trait for potato chips. While color and total solids were consistent between treatments, the dextrose concentrations showed some variation (mean 0.008 ± 0.005 g L−1), although this was not significant.
Field size may compensate for the total yield. However, the quality of the potato tuber should be a significant parameter in this agricultural practice selection. Considering the large treatment differences in fertigation and irrigation in this study, it is surprising that tuber size and mass distribution was so consistent. Regarding fertigation, the 50% fertigation dose did not result in reduced tuber size. This may be because of the irrigation method used here (i.e., shallow, subsurface and with low discharge rates), which delivers both water and nutrients to the active root zone, and its combination with applied composted manure. Moreover, there were no qualitative differences observed between the treatments.
These insights, in conjunction with the results of water and nitrogen productivity, imply that the additional nitrogen (i.e., the difference between the F50% and F100% treatments), was mainly consumed and allocated to vegetative growth (canopy), and is not reflected in significantly higher tuber yield and/or quality. Moreover, the additional nitrogen also may have been wasted and leached from the root zone, thus leading to economic waste and potential groundwater contamination.
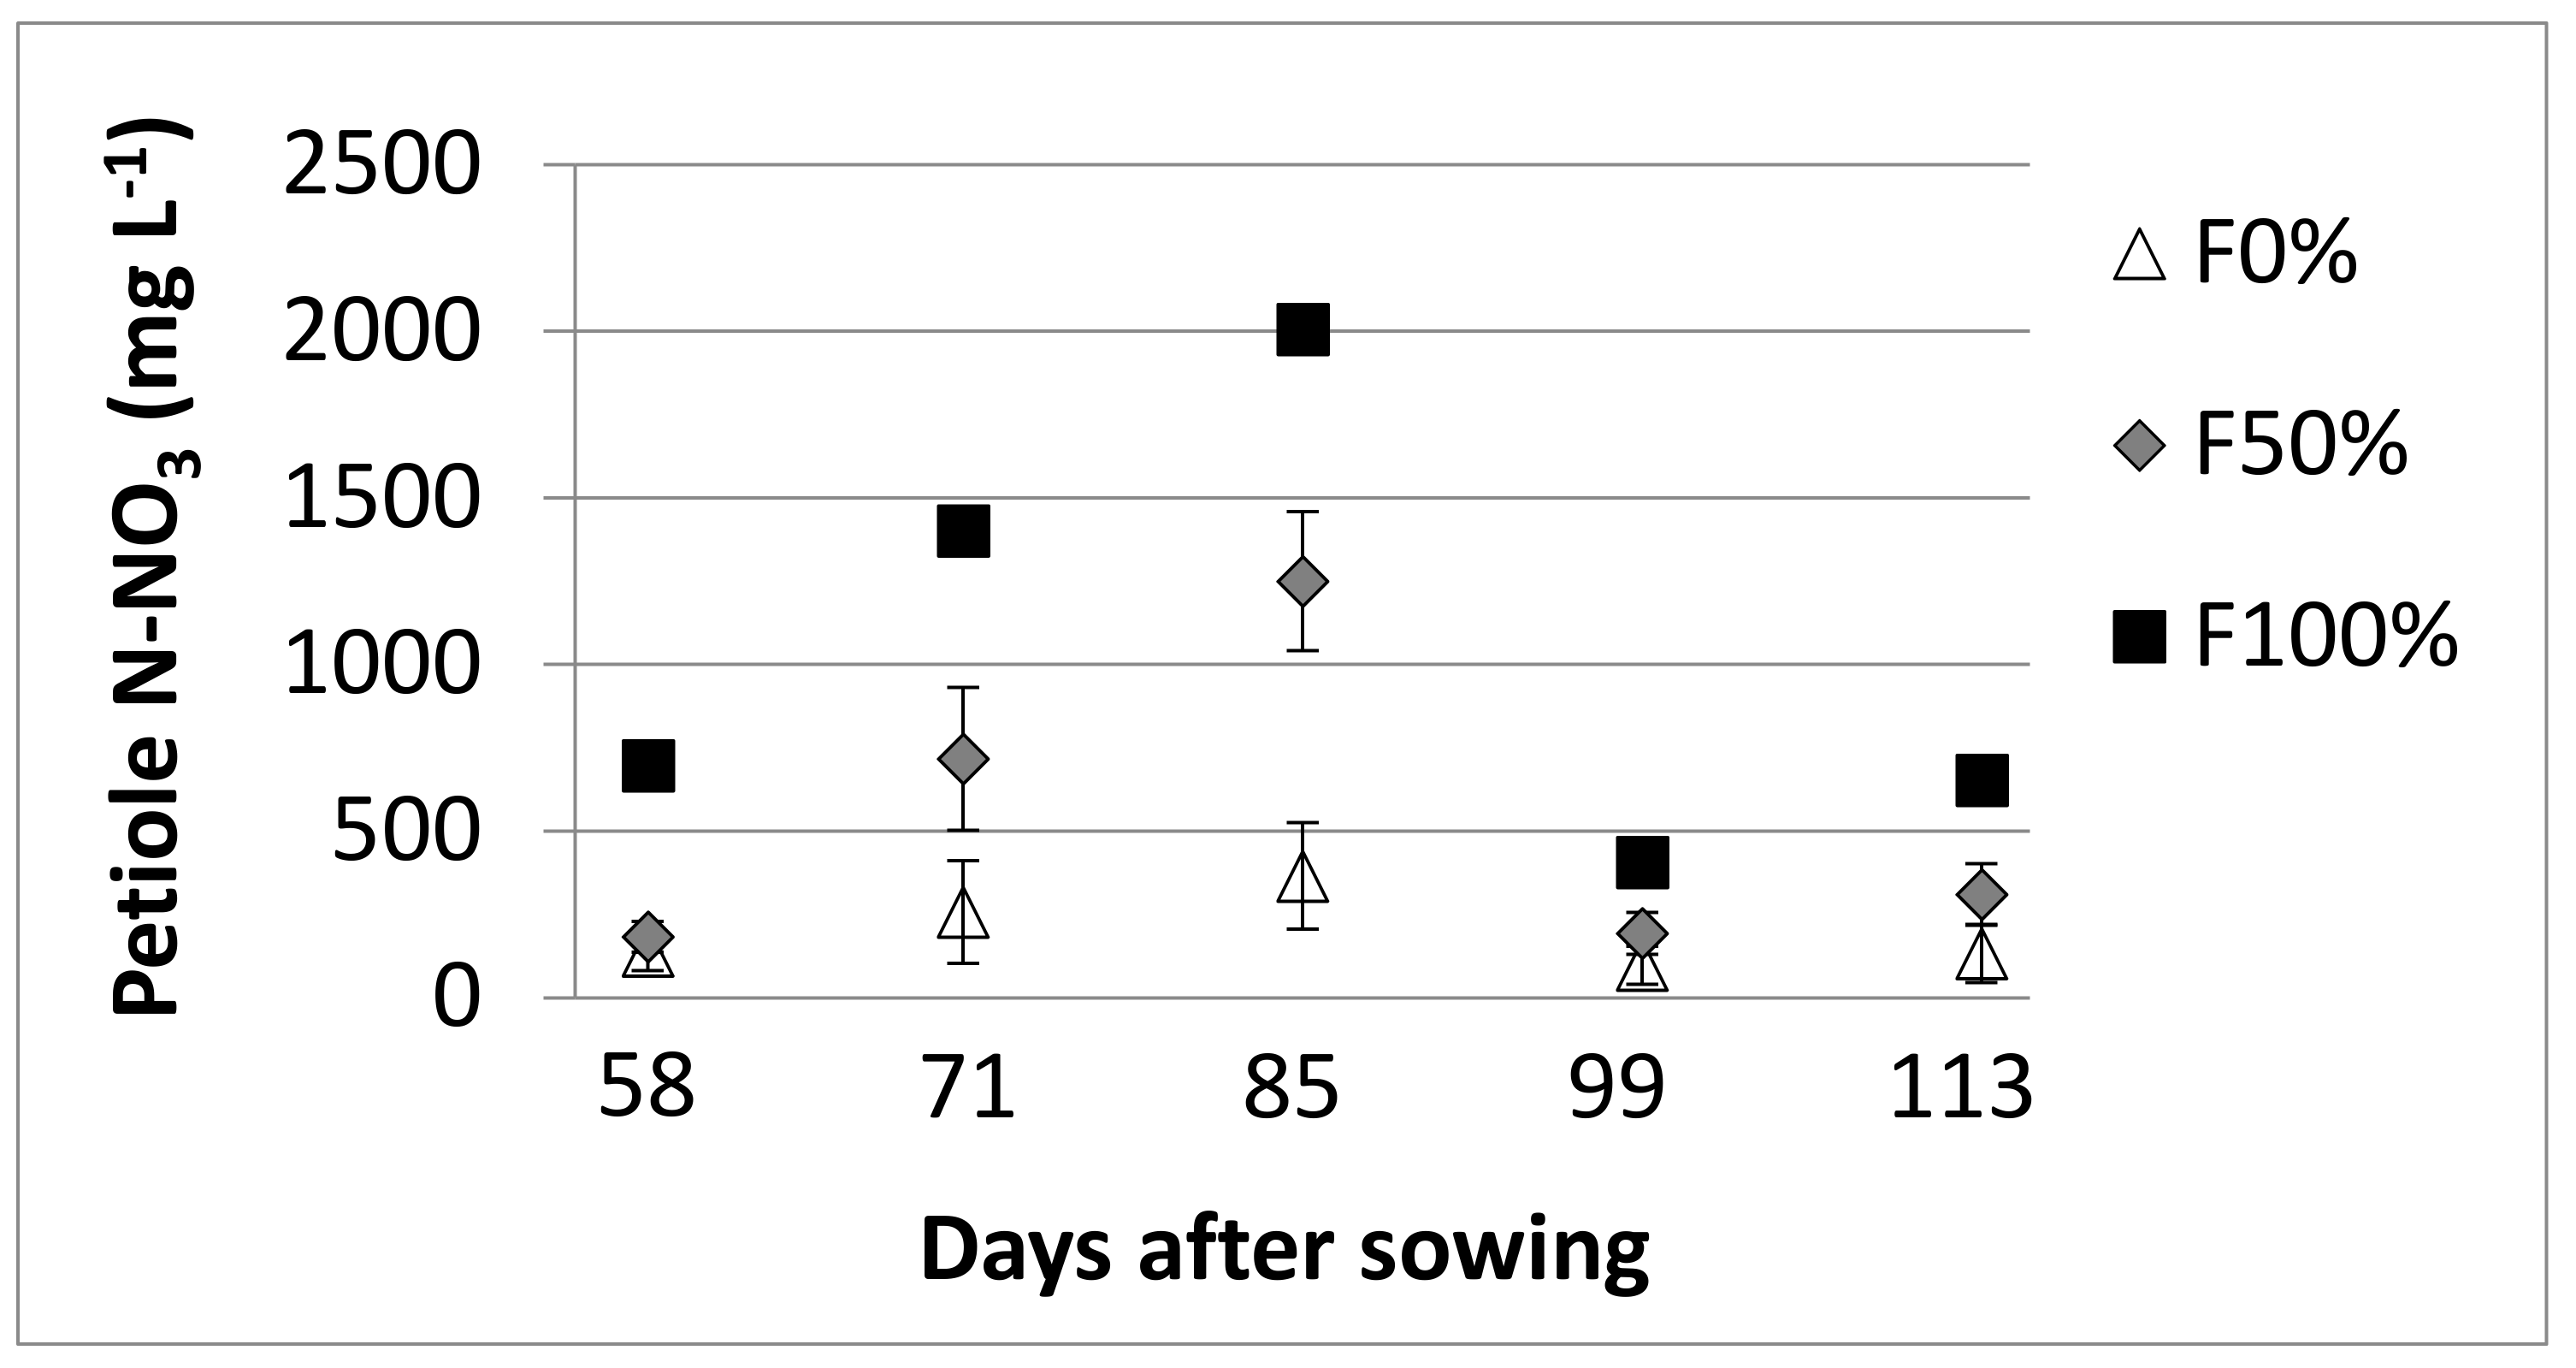
3.7. Nitrogen in the Petioles
The petiole N-NO3 concentration is a common indicator for plant N demand and the available nitrogen from fertilization [33]. We used this metric to better understand nitrogen uptake and demand during the season and thus to monitor the effect of different N regimes. From the multivariate analysis of the petiole nitrogen, we found that, for a given N treatment, there was no significant difference in petiole nitrogen between the water doses. Thus, in Figure 6 the results are the means from the four water treatments at a given nitrogen treatment (i.e., 16 replicates). It can be seen for all the treatments that petiole nitrogen concentration increases with increasing plant size until it reaches a maximum at DAS = 85. After that stage until harvest, there is a decrease in petiole nitrogen concentration, likely due to resource translocation for tuber development. There is a clear difference between the fertigation doses; the higher the fertigation dose the higher the petiole nitrogen concentration in all five sampling events. This is particularly marked for the F100% treatment compared to the F50% and F0% treatments.
3.8. Soil Analysis
Deficient irrigation may cause accumulation of salts, especially when it combines fertigation. In addition, when applying fertilizers that contain highly mobile components such as nitrates, one should consider leaching and possible contamination hazards. As mentioned before, shallow sub-drip irrigation with low discharge can minimize these hazards. However, there is a need to leach the accumulated salts, especially from the top 30 cm of the soil profile (i.e., the potato root zone). Therefore, it is important to examine the soil profile as well as crop parameters.
The soil profile was first sampled after 100 mm sprinkler irrigation was supplied, following germination and initial seedling establishment (‘Initial’ in Figure 7 and Figure 8). Based on a saturated soil water content of 0.36 (v v−1) this amount of water is equivalent to about 1.4 pore volumes that flow through the top 20 cm of the soil. Theoretically, for non-reactive solute transport, two pore volumes of saturated water flow should fully displace the native salts in this layer.
Even at the lowest irrigation regime (40%, 226.6 mm), approximately 1.6 pore volume of the 20–60 cm layer is displaced and this is enough to leach non-reactive solutes such as Cl− from the active root zone (Figure 7). Clearly, then, the higher irrigation regimes are able to continuously leach solutes from the soil profile to a depth of 60 cm and deeper. At the end of the growing season, before the harvest and soil sampling, the fertigation was stopped in order to ‘kill’ the foliage (i.e., plant water uptake and transpiration are negligible), but irrigation with reduced water salinity (due to the lack of fertilizer) continued for a further 21 days, allowing for efficient solute leaching and peel formation. As already mentioned, the dripper was buried to 5 cm and therefore, under continuous fertigation, the top soil accumulates salts continuously due to evaporation and capillary rise. Sprinkler or surface irrigation can achieve removal of these salts between growing seasons when there is no interference of the foliage.
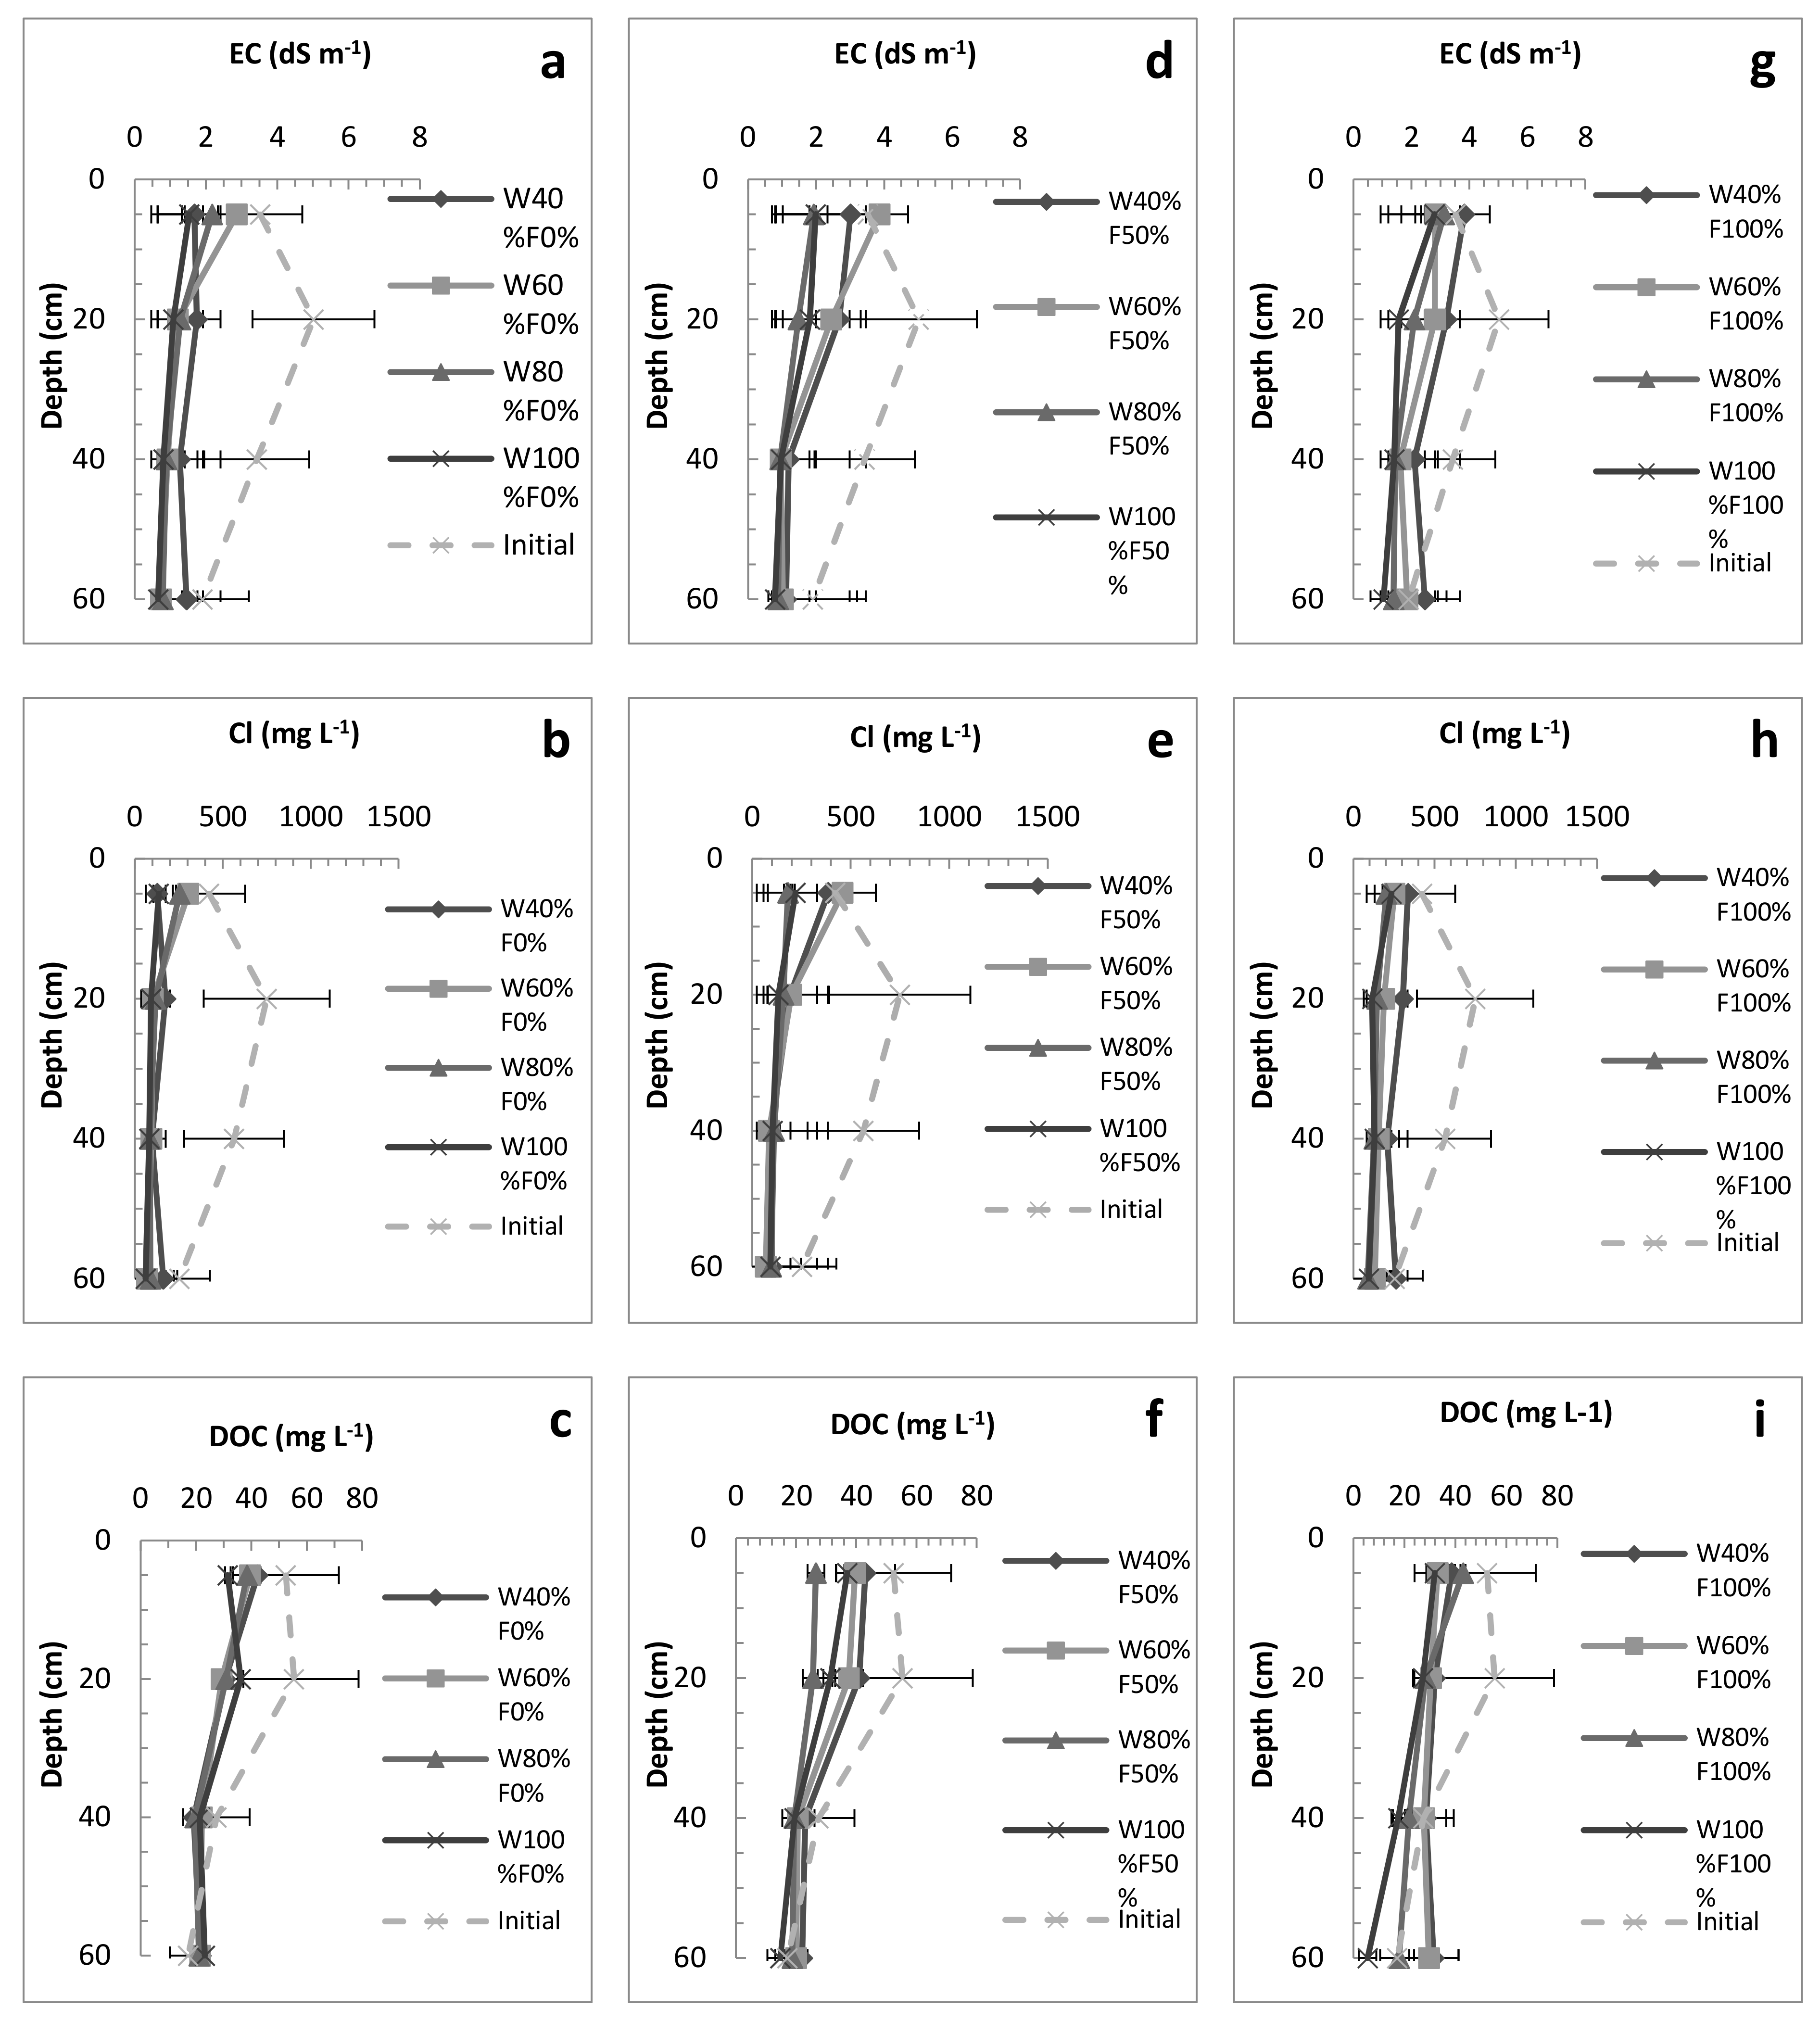
During the harvest, soil samples in proximity to a dripper were taken until a depth of 60 cm. The salinity (EC and Cl−) in the top 5 cm was similar to that at the beginning of the season and behaved similarly in all the treatments. Contrary to the top layer, the rest of the profile was washed.
The EC and Cl− distributions shown in Figure 7 show that accumulated topsoil salts were displaced by approximately 20 cm and this is in broad agreement with the solute transport/pore volume relationship mentioned above. The top soil layer EC and Cl−1 values (3.52 dS m−1 and 422 mg L−1 respectively) obtained from 1:1 (soil:DDW) extracts indicate a chemical equilibrium was being established in this system.
Figure 7 also shows the DOC concentration in the soil profile. The DOC sources are organic amendments and plant litter. DOC is an available carbon source for microbial activity, which in turn can increase the nitrogen demand and consumption by microorganisms [37]. It can be seen that the DOC concentrations are similar between the treatments. Similar to Cl−, DOC was also washed but with lower impact. This can be explained due to higher retardation of DOC in the soil because of the many DOC functional groups. From the C/N ratio (DOC/TN—data not shown), we observed that with higher fertigation and water dose we have more nitrogen in the soil profile and thus a lower C/N ratio. A low C/N ratio implies high nitrogen concentrations in the soil profile and thus can be interpreted as both a waste of fertilizer and an increased hazard for groundwater contamination.
With regard to the nitrogen, we examined the inorganic and organic fractions. The inorganic nitrogen includes NO3− and NH4+. The organic fraction is the dissolved organic nitrogen (DON) calculated by subtraction from the total nitrogen (TN): DON = TN − N-NO3− − N-NH4+.
It can be seen (Figure 8) that the TN was mainly compromised of NO3−, except for the F100% treatment that also had a higher fraction of DON. In general, NH4+ concentrations were significantly low or negligible for all treatments, both at the beginning and at the end of the season. TN was leached and/or consumed mainly in the F0% and F50% dose treatments, thus minimizing waste and N contamination of groundwater. More importantly, the F50% treatment was able to sustain profitable potato yield and quality. As for the F100% treatments, some accumulation of DON occurred in the top 5 cm. A similar trend was observed for all the irrigation doses with some higher values in the W100%F100% treatment, which showed significantly higher accumulation in this top layer. A possible explanation for this observation is the higher concentration of the mineral nitrogen as reflected by the lower C/N ratio (data not shown). Specifically, since mineral nitrogen was available for both plants and microbial activity, the DON was not consumed and thus accumulated in the root zone.
The soil NO3− concentration was most affected by fertigation due to its addition as the main source of nitrogen. The NO3− trend at the beginning and end of the season was similar to that of the TN. It can be seen that for the F0% and F50% doses, most of the nitrogen was consumed, while for the 100% treatment nitrate accumulated throughout the soil profile, with higher concentrations found in the top 5 cm.
As mentioned previously, the DON fraction was significantly higher for the F100% dose and exhibited a similar trend to the NO3−. As a result, when applying sprinkler irrigation between seasons when using the F100% treatments, the farmer may leach nitrogen components below the root zone, reducing the salinity but with possible groundwater contamination.
4. Summary and Conclusions
In arid regions, suitable irrigation techniques and regimes are highly important in order to acquire a profitable yield. Potato growth is mainly limited by two factors: Water and nitrogen availability. Excess irrigation can reduce tuber yield due to insufficient oxygen in the root zone and increase nutrient loss through leaching, which can also result in ground water contamination. Deficit irrigation may result in decreased tuber yield due to lack of water and a reduction in tuber quality through unavailability of nutrients or salt accumulation. Moreover, improper plant development will result in smaller foliage and thus reduced photosynthesis per unit leaf area.
Our results demonstrate that a sequential practice of sprinkler irrigation for the germination phase followed by low discharge drip irrigation can result in similar potato yields to traditional methods that utilize sprinkler irrigation, without unduly affecting marketable tuber size and quality. The W80%F50% treatment (438 mm water and 50 mg N L−1) showed that this dose is sufficient for optimal potato growth in conjunction with water and fertilizer savings. Furthermore, water productivity is higher under the lower irrigation regime and, with regard to the economics of food production, farmers may benefit from these findings. Greater efficiency can be achieved with even lower irrigation doses (40%) but at the cost of utilizing a greater area. This is feasible if the availability of soils is not limiting but with the condition that this strategy has to take into account other fixed and variable costs, as well the environmental consequences of utilizing saline irrigation water.
Author Contributions
The study was conceived and designed by G.A. and N.L. P.T. performed the field experiment. All authors took a part in the data analysis, interpretation, and writing the paper. All authors have read and approved the final manuscript.
Funding
The study was funded by the Chief Scientist of the Israeli Ministry of Agriculture (857069512), the Goldinger Trust, Jewish Federation of Delaware and the Frances and Elias Margolin Trust.
Acknowledgments
We thank O.M. and his team from Kibbutz Yotvata for providing the agricultural facilities.
We also appreciate the technical assistance and support of E.V. (Netafim LTD), Y.M., Y.S. and D.S.
Conflicts of Interest
The authors declare no conflict of interest.
References
- Ojala, J.C.; Stark, J.C.; Kleinkopf, G.E. Influence of irrigation and nitrogen management on potato yield and quality. Am. Potato J. 1990, 67, 29–43. [Google Scholar] [CrossRef]
- Waddell, J.T.; Gupta, S.C.; Moncrief, J.F.; Rosen, C.J.; Steele, D.D. Irrigation and nitrogen management effects on potato yield, tuber quality, and nitrogen uptake. Agron. J. 1999, 91, 991–997. [Google Scholar] [CrossRef]
- Westermann, D.T.; Kleinkopf, G.E.; Porter, L.K. Nitrogen Fertilizer Efficiencies on Potatoes. Am. Potato J. 1988, 65, 377–386. [Google Scholar] [CrossRef]
- Satchithanantham, S.; Krahn, V.; Sri Ranjan, R.; Sager, S. Shallow groundwater uptake and irrigation water redistribution within the potato root zone. Agric. Water Manag. 2014, 132, 101–110. [Google Scholar] [CrossRef]
- Zotarelli, L.; Rens, L.R.; Cantliffe, D.J.; Stoffella, P.J.; Gergela, D.; Burhans, D. Rate and timing of nitrogen fertilizer application on potato ‘FL1867’. Part I: Plant nitrogen uptake and soil nitrogen availability. Field Crops Res. 2015, 183, 246–256. [Google Scholar] [CrossRef]
- Ierna, A.; Pandino, G.; Lombardo, S.; Mauromicale, G. Tuber yield, water and fertilizer productivity in early potato as affected by a combination of irrigation and fertilization. Agric. Water Manag. 2011, 101, 35–41. [Google Scholar] [CrossRef]
- Watkins, K.B.; Lu, Y.; Huang, W. Economic and environmental feasibility of variable rate nitrogen fertilizer application with carry-over effects. J. Agric. Resour. Econ. 1998, 23, 401–426. [Google Scholar]
- Hou, Z.N.; Li, P.F.; Li, B.G.; Gong, J.; Wang, Y.N. Effects of fertigation scheme on N uptake and N use efficiency in cotton. Plant Soil. 2007, 290, 115–126. [Google Scholar] [CrossRef]
- Guo, S.; Wang, J.; Zhang, F.; Wang, Y.; Guo, P. An integrated water-saving and quality-guarantee uncertain programming approach for the optimal irrigation scheduling of seed maize in arid regions. Water 2018, 10, 908. [Google Scholar] [CrossRef]
- Papadopoulos, I. Nitrogen fertigation of trickle-irrigated potato. Fertil. Res. 1988, 16, 157–167. [Google Scholar] [CrossRef]
- Unlu, M.; Kanber, R.; Senyigit, U.; Onaran, H.; Diker, K. Trickle and sprinkler irrigation of potato (Solanum tuberosum L.) in the middle Anatolian Region in Turkey. Agric. Water Manag. 2006, 79, 43–71. [Google Scholar] [CrossRef]
- Ju, X.T.; Kou, C.L.; Zhang, F.S.; Christie, P. Nitrogen balance and groundwater nitrate contamination: Comparison among three intensive cropping systems on the North China Plain. Environ. Pollut. 2006, 143, 117–125. [Google Scholar] [CrossRef] [PubMed] [Green Version]
- Levallois, P. Groundwater contamination by nitrate associated with intensive potato culture in Québec. Sci. Total Environ. 1998, 217, 91–101. [Google Scholar] [CrossRef]
- Trifonov, P.; Lazarovitch, N.; Arye, G. Increasing water productivity in arid regions using low-discharge drip irrigation: A case study on potato growth. Irrig. Sci. 2017, 35, 287–295. [Google Scholar] [CrossRef]
- Dahan, O.; Babad, A.; Lazarovitch, N.; Eliani, E.; Kurtzman, D. Nitrate leaching from intensive organic farms to groundwater. Hydrol. Earth Syst. Sci. 2014, 18, 333–341. [Google Scholar] [CrossRef] [Green Version]
- Giménez, L.; Paredes, P.; Pereira, L.S. Water use and yield of soybean under various irrigation regimes and severe water stress. Application of AquaCrop and SIMDualKc models. Water 2017, 9, 393. [Google Scholar] [CrossRef]
- Rajput, T.B.S.; Patel, N. Water and nitrate movement in drip-irrigated onion under fertigation and irrigation treatments. Agric. Water Manag. 2006, 79, 293–311. [Google Scholar] [CrossRef]
- Mmolawa, K.; Or, D. Root zone solute dynamics under drip irrigation: A review. Plant Soil. 2000, 222, 163–190. [Google Scholar] [CrossRef]
- Shenker, M.; Ben-Gal, A.; Shani, U. Sweet corn response to combined nitrogen and salinity environmental stresses. Plant Soil. 2003, 256, 139–147. [Google Scholar] [CrossRef]
- Silber, A.; Xu, G.; Levkovitch, I.; Soriano, S.; Bilu, A.; Wallach, R. High fertigation frequency: The effects on uptake of nutrients, water and plant growth. Plant Soil 2003, 253, 467–477. [Google Scholar] [CrossRef]
- Lesczynski, D.B.; Tanner, C.B. Seasonal variation of root distribution of irrigated, field-grown Russet Burbank potato. Am. Potato J. 1976, 53, 69–78. [Google Scholar] [CrossRef]
- Opena, G.B.; Porter, G.A. Soil management and supplemental irrigation effects on potato. II. Root growth. Agron. J. 1999, 91, 426–431. [Google Scholar] [CrossRef]
- Aragüés, R.; Medina, E.T.; Martínez-Cob, A.; Faci, J. Effects of deficit irrigation strategies on soil salinization and sodification in a semiarid drip-irrigated peach orchard. Agric. Water Manag. 2014, 142, 1–9. [Google Scholar] [CrossRef] [Green Version]
- Rozema, J.; Flowers, T. Crops for a salinized world. Science 2008, 322, 1478–1480. [Google Scholar] [CrossRef] [PubMed]
- Sharma, B.R.; Minhas, P.S. Strategies for managing saline/alkali waters for sustainable agricultural production in South Asia. Agric. Water Manag. 2005, 78, 136–151. [Google Scholar] [CrossRef]
- Ben-Asher, J.; Yano, T.; Shainberg, I. Dripper discharge rates and the hydraulic properties of the soil. Irrig. Drain. Syst. 2003, 17, 325–339. [Google Scholar] [CrossRef]
- Elmaloglou, S.; Diamantopoulos, E. Soil water dynamics under surface trickle irrigation as affected by soil hydraulic properties, discharge rate, dripper spacing and irrigation duration. Irrig. Drain. 2010, 59, 254–263. [Google Scholar] [CrossRef]
- Hinnell, A.C.; Lazarovitch, N.; Furman, A.; Poulton, M.; Warrick, A.W. Neuro-Drip: Estimation of subsurface wetting patterns for drip irrigation using neural networks. Irrig. Sci. 2010, 28, 535–544. [Google Scholar] [CrossRef]
- Lazarovitch, N.; Poulton, M.; Furman, A.; Warrick, A.W. Water distribution under trickle irrigation predicted using artificial neural networks. J. Eng. Math. 2009, 64, 207–218. [Google Scholar] [CrossRef]
- Olfs, H.W.; Blankenau, K.; Brentrup, F.; Jasper, J.; Link, A.; Lammel, J. Soil and plant-based nitrogen fertilizer recommendations in arable farming. J. Plant Nutr. Soil Sci. 2005, 168, 414–431. [Google Scholar] [CrossRef]
- Expósito, A.; Berbel, J. Microeconomics of deficit irrigation and subjective water response function for intensive olive groves. Water 2016, 8, 254. [Google Scholar] [CrossRef]
- Sadras, V.O. Does partial root-zone drying improve irrigation water productivity in the field? A meta-analysis. Irrig. Sci. 2009, 27, 183–190. [Google Scholar] [CrossRef]
- Gardner, B.R.; Jones, J.P. Petiole analysis and the nitrogen fertilization of Russet Burbank potatoes. Am. J. Potato Res. 1975, 52, 195–200. [Google Scholar] [CrossRef]
- Shrestha, R.K.; Cooperband, L.R.; MacGuidwin, A.E. Strategies to reduce nitrate leaching into groundwater in potato grown in sandy soils: Case study from North Central USA. Am. J. Potato Res. 2010, 87, 229–244. [Google Scholar] [CrossRef]
- Matović, G.; Broćić, Z.; Djuričin, S.; Gregorić, E.; Bodroža, D. Profitability assessment of potato production applying different irrigation methods. Irrig. Drain. 2016, 65, 502–513. [Google Scholar] [CrossRef]
- Starr, G.C.; Rowland, D.; Griffin, T.S.; Olanya, O.M. Soil water in relation to irrigation, water uptake and potato yield in a humid climate. Agric. Water Manag. 2008, 95, 292–300. [Google Scholar] [CrossRef]
- Kalbitz, K.; Solinger, S.; Park, J.H.; Michalzik, B.; Matzner, E. Controls on the dynamics of dissolved organic matter in soils: A review. Soil Sci. 2000, 165, 227–304. [Google Scholar] [CrossRef]
Figure 1.
(a) Min. and max. Temperature; (b) cumulative evaporation (mm), and daily precipitation (mm) during the growing season starting from sowing date.
Figure 1.
(a) Min. and max. Temperature; (b) cumulative evaporation (mm), and daily precipitation (mm) during the growing season starting from sowing date.

Figure 2.
Potato tuber yield (ton ha−1) as a function of irrigation and fertigation regime. Values with the same letter are not significantly different (p < 0.05).
Figure 2.
Potato tuber yield (ton ha−1) as a function of irrigation and fertigation regime. Values with the same letter are not significantly different (p < 0.05).

Figure 3.
Water productivity (kg m−3) as a function of irrigation and fertigation regime. Values with the same letter are not significantly different (p < 0.05).
Figure 3.
Water productivity (kg m−3) as a function of irrigation and fertigation regime. Values with the same letter are not significantly different (p < 0.05).

Figure 4.
Nitrogen productivity (ton kg−1 N) as a function of irrigation and fertigation regime. Values with the same letter are not significantly different (p < 0.05).
Figure 4.
Nitrogen productivity (ton kg−1 N) as a function of irrigation and fertigation regime. Values with the same letter are not significantly different (p < 0.05).

Figure 5.
Cumulative frequency of tuber width according to the treatments. (a) F0%; (b) F50%; (c) F100%.
Figure 5.
Cumulative frequency of tuber width according to the treatments. (a) F0%; (b) F50%; (c) F100%.

Figure 6.
N-NO3 in petioles during the growing season.

Figure 7.
Mean values of soil sample analyses (1:1 soil:water) for EC, Cl−, and DOC at four different depths (5, 20, 40, and 60 cm) according to the irrigation regime. The dashed line (‘Initial’) represents the sampling at the beginning of the season. (a,b,c) F0%; (d,e,f) F50%; (g,h,i) F100%.
Figure 7.
Mean values of soil sample analyses (1:1 soil:water) for EC, Cl−, and DOC at four different depths (5, 20, 40, and 60 cm) according to the irrigation regime. The dashed line (‘Initial’) represents the sampling at the beginning of the season. (a,b,c) F0%; (d,e,f) F50%; (g,h,i) F100%.

Figure 8.
Mean values of soil sample analyses (1:1 soil:water) of TN, NO3−, NH4+ and DON at four different depths (5, 20, 40, and 60 cm) according to the irrigation regime. The dashed line (‘initial’) represents the sampling at the beginning of the season. (a–d) F0%; (e–h) F50%; (i–l) F100%.
Figure 8.
Mean values of soil sample analyses (1:1 soil:water) of TN, NO3−, NH4+ and DON at four different depths (5, 20, 40, and 60 cm) according to the irrigation regime. The dashed line (‘initial’) represents the sampling at the beginning of the season. (a–d) F0%; (e–h) F50%; (i–l) F100%.


Table 1.
Representative Yotvata irrigation water composition.
| Ca2+ | Mg+2ss | Na+ | K+ | PO4−3 | NO3− | NH4+ | SO4−2 | HCO3− | EC | pH |
|---|---|---|---|---|---|---|---|---|---|---|
| mg L−1 | dS m−1 | - | ||||||||
| 192.2 + 3.7 | 139.4 ± 5.1 | 290 ± 5.7 | 12.8 ± 2.6 | 0 | 4 ± 0.3 | 0 | 758.5 ± 17.6 | 226.7 | 2.5 ± 0.6 | 7.2 ± 0.1 |
Table 2.
Actual cumulative irrigation (mm) according to the irrigation and fertigation regime.
| W40% F0% | W60% F0% | W80% F0% | W100% F0% | W40% F50% | W60% F50% | W80% F50% | W100% F50% | W40% F100% | W60% F100% | W80% F100% | W100% F100% |
|---|---|---|---|---|---|---|---|---|---|---|---|
| 226.6 | 331.0 | 435.2 | 549.2 | 224.8 | 333.3 | 438.6 | 547.1 | 222.6 | 331.5 | 436.6 | 541.5 |
Table 3.
Representative Yotvata composted biosolids composition (source: Dairy barn).
| Ca+2 | Mg+2 | Na+ | K+ | P | OM | N | P | K | C | C/N | EC | pH |
|---|---|---|---|---|---|---|---|---|---|---|---|---|
| 103 × mg L−1 | %wt. | - | dS m−1 | - | ||||||||
| 120.5 | 5.8 | 11.2 | 21.1 | 5.5 | 35.7 ± 0.6 | 1.6 ± 0.2 | 1.0 ± 0.0 | 2.1 ± 0.1 | 21.0 ± 0.0 | 12.3 ± 1.1 | 37.3 ± 4.1 | 8.1 ± 0.1 |
© 2018 by the authors. Licensee MDPI, Basel, Switzerland. This article is an open access article distributed under the terms and conditions of the Creative Commons Attribution (CC BY) license (http://creativecommons.org/licenses/by/4.0/).
Share and Cite
MDPI and ACS Style
Trifonov, P.; Lazarovitch, N.; Arye, G. Water and Nitrogen Productivity of Potato Growth in Desert Areas under Low-Discharge Drip Irrigation. Water 2018, 10, 970. https://doi.org/10.3390/w10080970
AMA Style
Trifonov P, Lazarovitch N, Arye G. Water and Nitrogen Productivity of Potato Growth in Desert Areas under Low-Discharge Drip Irrigation. Water. 2018; 10(8):970. https://doi.org/10.3390/w10080970
Chicago/Turabian StyleTrifonov, Pavel, Naftali Lazarovitch, and Gilboa Arye. 2018. "Water and Nitrogen Productivity of Potato Growth in Desert Areas under Low-Discharge Drip Irrigation" Water 10, no. 8: 970. https://doi.org/10.3390/w10080970
Note that from the first issue of 2016, this journal uses article numbers instead of page numbers. See further details here.