
When it comes to workforce planning and baselining an organisation or forecasting a workforce over time, I’m often asked which is the better metric: headcount or FTE. I have found often that those with a background in finance tend to reach for FTE figures, whereas operational managers find comfort in headcount numbers. When it comes to forecasting and planning, those dealing in high volume resource planning have rightly focused on FTE. When this translates into multi-horizon workforce planning, those backgrounds (heavily influenced by the format and quality of workforce data) are shaping the metrics being used and impacting the subsequent interventions. In this short article I aim to share the truth that both need to be measured, monitored and modelled for different reasons and to highlight the intricacies in the metrics.
What are Headcount and FTE?
Headcount is the total number, the count, of people present at any given point in time. If you have 1,000 employees, your headcount is 1,000.
Full-Time Equivalent (FTE), occasionally Whole Time Equivalent (WTE), is the measure of time for a person in relation to a pre-defined ‘full-time’ rate i.e. 1.0 is the full-time equivalent of 1 employee, whereas 0.5 is the full-time equivalent of half an employee. If a full-time employee is contracted to work 40 hours, then all other hours are counted in relation to that metric.
Is it as simple as that?
Unfortunately not. Whereas headcount is subject only to the challenges of ‘who’ to count, FTE is much more complex and can be broken down into some specific types. Let’s imagine you are looking at the FTE for January.
Contracted FTE is calculated by looking at all employees and calculating the sum of their individual contracted FTE, it is probably the figure that your ERP provides as the FTE figure when you run an HR report for January,
Financial FTE may only be realised some weeks later based on what was actually worked and will take into account any additional paid hours or overtime that are worked, including the time for any casual employees or zero-hours contract workers. In this, a 0.8 Contracted FTE (four day week) who worked an additional day each week, would be recorded as a 1.0 Financial FTE.
Forecast FTE is informed by Financial FTE, whereby the trends in actual paid hours are used to forecast the coming FTE levels. For example, if a 1.0 Contracted FTE is routinely a 1.2 Financial FTE, then she may be considered a 1.2 Forecast FTE. The Forecast FTE level relates to the Bear Scotland ruling in 2014, which requires employers in the UK to use actual pay over a representative period to calculate holiday pay.
Planned FTE may well not sit in any official systems and, as a result, may be calculated in many different ways. At a first-line manager level this may include all hours expected to be worked by employees in January, including additional and overtime hours and casual staff / zero hours employees, but may well exclude those on annual leave. Whereas the Forecast FTE for January may have been calculated many months previously, the planned FTE may be calculated as little as days beforehand. Though this provides an indicative direct resource cost of work, or a particular project, the sum totals of Planned FTE across an organisation typically do not equate to Financial FTE.
Budgeted FTE is the number of FTE that the business has allocated in a budget for January.
Target FTE is the number of FTE that the business requires for January, which is based on mapping work against the subsets of Available Time to create a Target FTE.
What is Available Time?
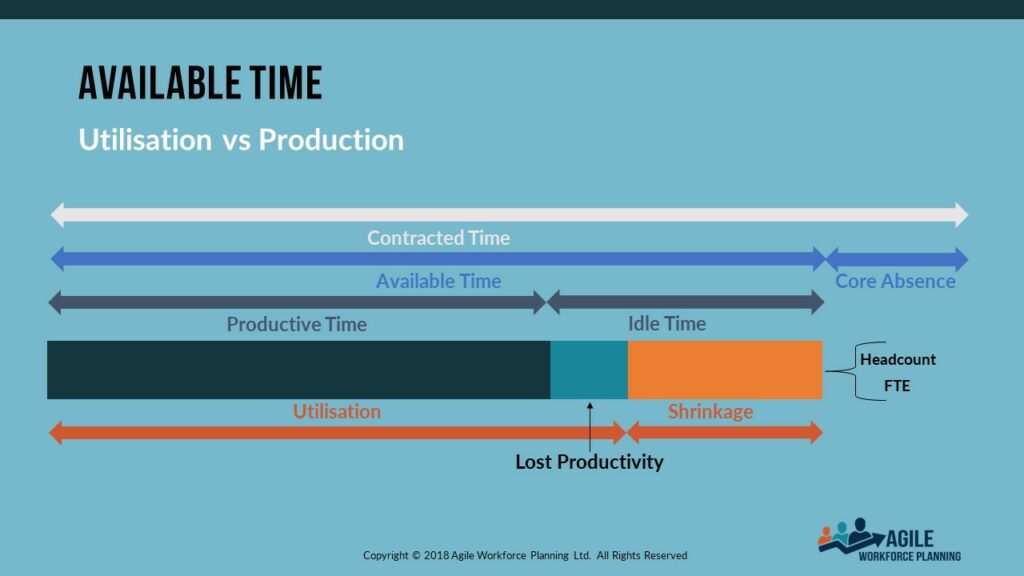
The starting point for Available Time is the Contracted FTE figure, for example 1,000 FTE (based on a 40 hour week), which equated as time over a year is 2,080,000 hours (1000 FTE x 40 hrs x 52 wks). As an employer, however, that is not the amount of time available to you; in the contract of employment will be an annual leave requirement of statutory holidays and a holiday entitlement. For a UK figure, let’s assume 33 days of Annual Leave (8 Bank Holidays and 25 days of holiday entitlement), or 264 hours (33 days x 8 hrs); this extrapolates to 264,000 hours across the workforce. Available Time is 1,816,000 hours (2,080,000 hrs minus 264,000 hours). This figure is the whole sum from which is derived Utilisation vs Shrinkage and Productive vs Idle.
Process heavily environments tend to focus on Utilisation vs Shrinkage, where Utilisation is time working on a core task and Shrinkage is lost time, which is typically regarded as a combination of two things:
- External – absence
- Internal – activity other than core work
Though this can be helpful in understanding where it can be reduced, there is a more effective way to view shrinkage:
- FTE Shrinkage – absences that impact as a percentage of planned working, for example sickness and temporary closure of premises (sickness of 0.5 FTE is half the loss of the sickness of 1.0 FTE)
- Headcount Shrinkage – absences and events that impact in absolute time, and not as an FTE percentage, for example staff meetings and system downtime (a 1hr meeting causes a higher rate of shrinkage to 0.5 FTE than to 1.0 FTE)
Many resource planning professionals will categorise all annual leave as External Shrinkage. This is usually based on the practical perspective that they will often deal in a short time horizon and will abstract pre-booked annual leave and statutory holidays as part of a single calculation. Whilst sensible in approach, this mis-categorisation drives the wrong business behaviours. Annual leave is a reduction to available time, as opposed to shrinkage that is a reduction from available time. Shrinkage is viewed as a negative reduction on management resource, and something to be reduced. By including annual leave within shrinkage, not only does annual leave come to be seen as a negative, but it also artificially inflates the shrinkage figures (often prompting an aim to reduce further).
In many businesses, utilisation is used interchangeably with Productive Time, however utilisation is better described as ‘being present’ (and hence known in some circles as ‘occupancy’). Assessments of average handling times and studies on time and motion will indicate the Processing Time (ie how long activity should take) and volume levels indicate the multiplier for productivity, the gap between utilisation and productive time is underperformance (either on the basis of a new starter becoming productive or an existing employee with performance dips). Equally, shrinkage plus lost productivity is Idle Time that does not result in core outputs being achieved.
How then do I calculate Target FTE?
To calculate Target FTE, first start with the volume levels and the processing time to establish the Productive Time (Volume x Processing Time = Productive Time).
Then, to create the Utilisation target, add toProductive Time a Lost Productivity multiple of:
- Speed to Competency – those new starters who are still undergoing coaching to be fully productive
- Underperformance – those existing workers who are not delivering at the productive level
(Productive Time + (Productive Time x Lost Productivity multiple) = Utilisation target)
Now add to the utilisation target a Shrinkage multiple based on the percentages of FTE and Headcount shrinkage to create the Available Time target (assuming the overall impact of Shrinkage on our 1.0 FTE is 8 hours, or 0.2 FTE, the multiple is 0.25) (Utilisation target + (Utilisation target x Shrinkage multiple) = Available Time target)
And then add to Available Time a Core Absence multiple, based on holiday levels (assuming 8 Bank Holidays and 25 days of holiday entitlement, the multiple is 0.145374449339207), to create the Target Time (Available Time target + (Available Time target x Core Absence multiple) = Target Time)
Then the Target Time is divided by the contract hours and time in weeks (for example, 40 hours and 52 weeks) to create the Target FTE (Target Time / (Contract Hours x Time in weeks) = Target FTE)
So which FTE calculation should I use?
Each of these metrics are important in understanding the business and their challenges. There will always be unhealthy tension if the Budgeted FTE is lower than the Target FTE. Effective demand forecasting will provide an accurate picture of Target FTE; if the budget is lower then demand needs to be reduced, reallocated or optimised. Unless the two figures can be balanced, a Financial FTE that is higher than Budget will result in an overspend and a Financial FTE that is lower than Target will result in a drop in service levels (eg volumes and quality). At a macro level, reviewing the gap between Contracted FTE and Target FTE is vital, particularly where ‘work demand’ is quantified in roles. If Contracted FTE is lower than Target FTE (ie a vacancy), then it must be treated as a business risk as there is no guarantee of closing that gap. Operational leaders may often downplay the risk where their Financial FTE consistently balances with Target FTE, so care must be taken in creating the Forecast FTE to mitigate that risk. Where the Forecast remains lower than the Target, the expectation will be to Buy (recruit permanent hires) or Borrow (bring in contingent labour).
Planned FTE can be very helpful at a local level in understanding resource availability, but only if properly calculated and used appropriately.
So is Headcount a useful metric?
Yes, headcount are people, and people are managed, FTE are a mathematical construct. Whereas FTE provides a great indication of available workforce supply and associated cost, headcount determines a great deal of associated demand. From a people management perspective, 0.5 FTE requires the same level of input as 1.0 FTE. Business headcount requirements, rather than FTE, will dictate the cost of recruitment, onboarding, training and other shared service functions (like helpdesks and payroll). Headcount scheduling will drive infrastructure (eg desks and IT systems) and at each level of business hierarchy will largely determine the headcount size of the next supervisory level.
Equally, certain activities may require a target headcount (eg minimum number of operators on a machine or number of workers at a location) or a maximum viable headcount (like the old adage that just because a woman can grow a baby in 9 months, does not mean that two women can grow one in 4.5 months).
Adam Gibson is a global leader in Workforce Planning, creator of the Agile Workforce Planning methodology and a popular keynote speaker. He has successfully implemented and transformed workforce planning and people analytics in businesses across both the public and private sector. As a consultant, he advises company executives on how to create a sustainable workforce that increases productivity and reduces cost; he is also the head of CIPD’s workforce planning faculty.